Structural Equation Modeling, Part 2
PSY 356
But first: what is SEM?
Structural equation modeling (SEM) "can be viewed as a combination of factor analysis and regression or path analysis." (Hox and Bechger, 2011)
...OK, but what are those?
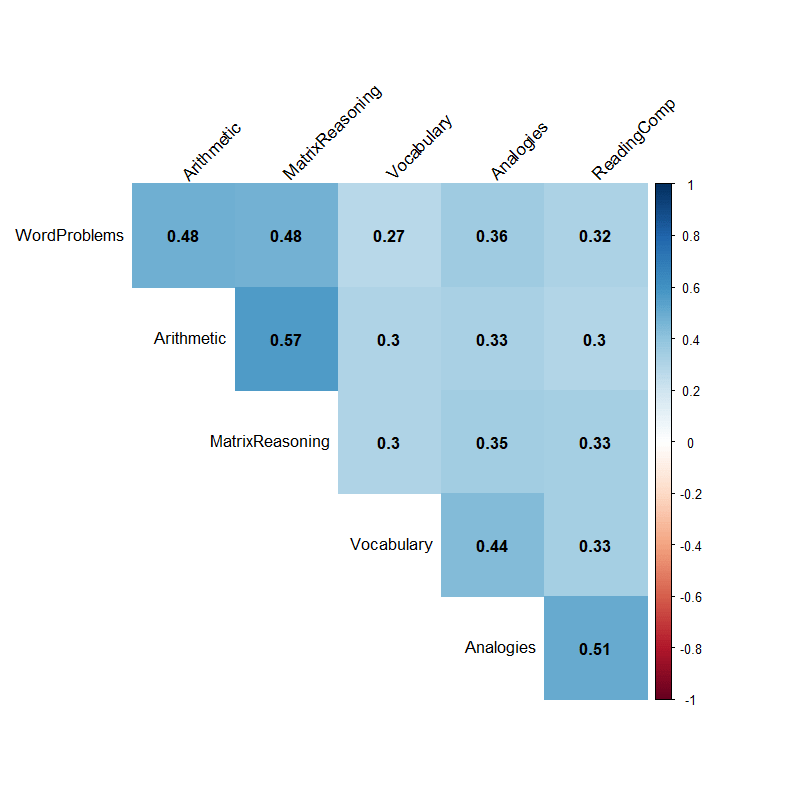
Factor analysis
Factor analysis aims to explain common variance among observed indicators in terms of latent variables. It is often referred to as a measurement model.
Math
Verbal
Arithmetic
Matrix reasoning
Word problems
Analogies
Reading comprehension
Vocabulary
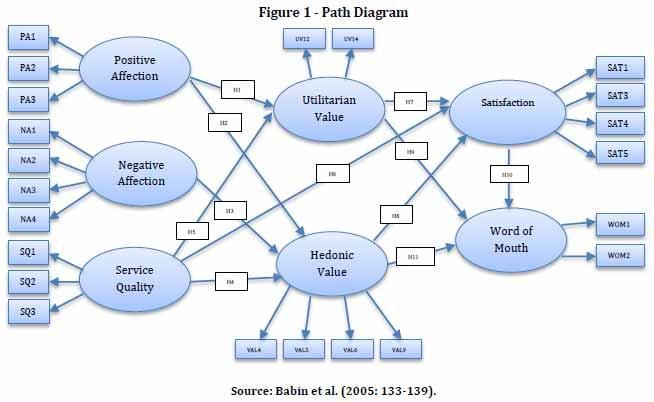
Path analysis
Path analysis aims to find directional paths from one observed variable to another. It is often referred to as a structural model.
Math instruction
Math self-efficacy
Math performance
Attitudes toward school
Structural equation modeling
Structural equation modeling is a general term that refers to any combination of a measurement model and a structural model.
Why use SEM?
- Some would say that SEM more closely corresponds to the theoretical mechanism of change than regression.
- ...but when there is just one predictor and one mediator (as in the example we just did) there isn't really a benefit.
- As we'll see in lab, we get the same results
- And the conceptual challenges and caveats are still the same!
- The benefit arises once things become more complicated -- i.e., once we start adding in more variables and paths between them. Then we can test model fit.
Model fit
- How well does our model replicate our data's means and covariances?
- Every model gives us a model-implied covariance matrix and model-implied means.
- The discrepancy between those model-implied values and our actual values indicates how well the model fits.
- The likelihood represents a function of this discrepancy, which gets higher if the model fits better and lower if the model fits worse
Back to our example
Math instruction
Math self-efficacy
Math performance
Attitudes toward school
Back to our example
Math instruction
Math self-efficacy
Math performance
Attitudes toward school
Means
Covariances
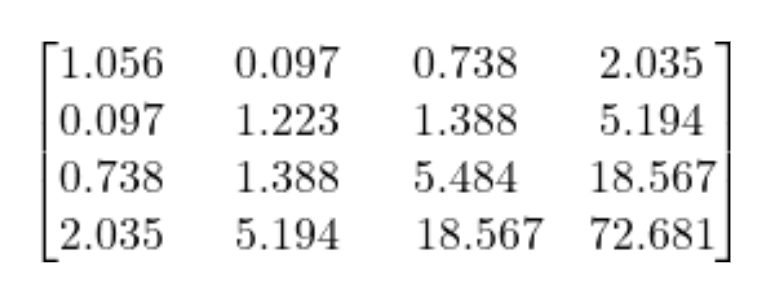
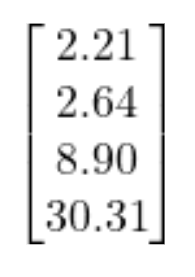
Means and covariances of school attitudes, math instruction, math self-efficacy, and math performance, respectively*
The key question is: how well does our model replicate these means and covariances?
*Note that these are not the actual values. You will see the real values in lab.
Model fit
- The basic premises:
- SEM implies that some set of relationships exists among the variables. This means that some relationships do not exist among the variables - i.e., that we aren't modeling every possible relationship that could exist.
- If we could model every possible relationship among the variables, we could replicate the means and covariances perfectly. We would also require a ton of parameters and the model would not be informative.
- How can we balance the fit of the model against not having too many parameters?
Fit indices
- Fit indices are a function of the likelihood and the number of parameters.
- We start with a \(\chi^2\) distribution.
-
Degrees of freedom are # means, variances, and covariances - # parameters in the model
- Significant test = model does not fit
- The \(\chi^2\) itself is almost always significant. What is interesting are the fit indices we can construct from this statistic.
-
Degrees of freedom are # means, variances, and covariances - # parameters in the model
"Absolute" fit indices
- Root mean squared error of approximation (RMSEA)
- Rule: Values between 0 and 0.08 are OK; below 0.10 are marginal.
- Tucker-Lewis Index (TLI) and Comparative Fit Index (CFI)
- Rule: Values above 0.9 are OK; above .95 is better.
- Squared Root Mean Residual (SRMR)
- Rule: Values below 0.08 are OK.
Honestly, these "rules" are highly subjective and fallible. You should at some point learn how these fit indices are formulated, but today doesn't need to be that day.
Factor analysis
Factor analysis aims to explain common variance among observed indicators in terms of latent variables. It is often referred to as a measurement model.
Math
Verbal
Arithmetic
Matrix reasoning
Word problems
Analogies
Reading comprehension
Vocabulary
Factor Analysis: EFA vs CFA
- Factor Analysis: Statistical method used to identify latent variables (factors) that explain the correlations among observed variables
- Two main approaches:
- Exploratory Factor Analysis (EFA): Explores the possible underlying factor structure without imposing a predetermined model
- Confirmatory Factor Analysis (CFA): Tests how well measured variables represent the number of constructs based on theory
- Key differences relate to:
- Purpose (explore vs. confirm)
- Theory requirements (minimal vs. substantial)
- Factor structure specification (determined by data vs. researcher)
Exploratory Factor Analysis (EFA)
- Purpose: Identify underlying factor structure when relationships are uncertain
-
Key choice points:
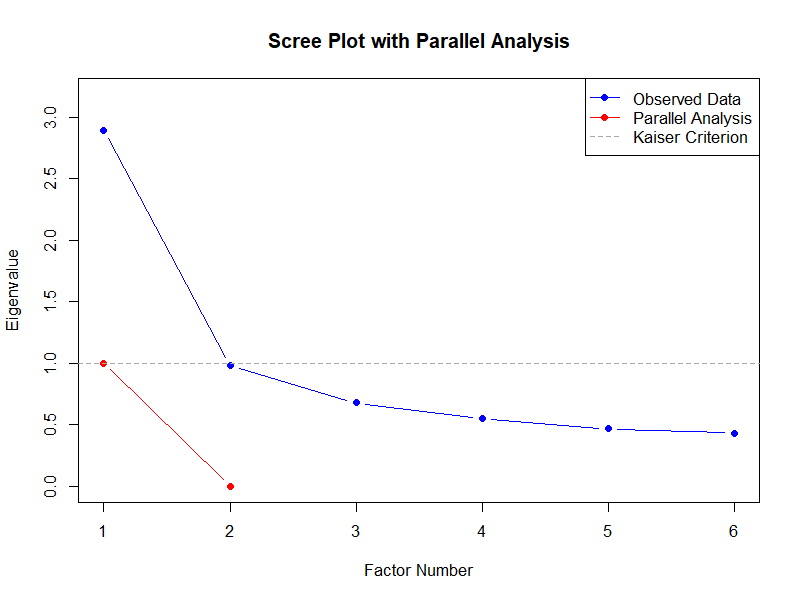
- Number of factors to extract (eigenvalues, scree plot, parallel analysis)
- Extraction method (Principal Components, Maximum Likelihood, etc.)
- Rotation method
- Interpretation: Based on pattern of factor loadings (correlations between items and factors)
-
Limitations:
- Subjective decisions required
- Sample-specific results
- Difficult to replicate exactly
A 2-factor EFA
??
??
Arithmetic
Matrix reasoning
Word problems
Analogies
Reading comprehension
Vocabulary
A 1-factor EFA
??
Arithmetic
Matrix reasoning
Word problems
Analogies
Reading comprehension
Vocabulary
EFA: Rotation Methods
Why rotate? To improve interpretability by maximizing high loadings and minimizing low loadings
-
Orthogonal rotations (assume factors are uncorrelated):
- Varimax: Maximizes variance of squared loadings within factors
- Quartimax: Simplifies rows of loading matrix
- Equamax: Combination of varimax and quartimax
-
Oblique rotations (allow factors to correlate):
- Promax: Computationally efficient rotation
- Direct oblimin: Control degree of correlation
- Geomin: Useful for complex factor structures
- Don't worry about all the -maxes and -mins. Just know that we need to use oblique rotation most of the time. Why do you think that is?
Confirmatory Factor Analysis (CFA)
- Purpose: Test how well measured variables represent constructs based on theory
-
Requirements:
- Strong theoretical foundation
- A priori specification of:
- Number of factors
- Which variables load on which factors
- Whether factors correlate
-
Features:
- Tests specific hypothesized measurement model
- Provides fit indices to evaluate model quality
- Allows for constraining or freeing parameters
- Can test competing theoretical models
CFA's are SEM's!
-
CFA is the measurement component of SEM
- Defines how latent variables are measured by observed variables
- Establishes construct validity before testing structural relationships
-
Two-step approach to SEM (Anderson & Gerbing, 1988):
- Step 1: Validate measurement model using CFA
- Step 2: Test structural model with paths between latent variables
-
Benefits of this approach:
- Separates measurement issues from structural issues
- Ensures valid measurement before testing structural relationships
- Makes identification problems easier to locate
- Reduces interpretational confounding
deck
By Veronica Cole


