OTel Me a Story
Observing code in production with OpenTelemetry (OTEL)

while True:
    try:
        x = int(input("Enter a number: "))
        break
    except ValueError:
        print("Oops!")

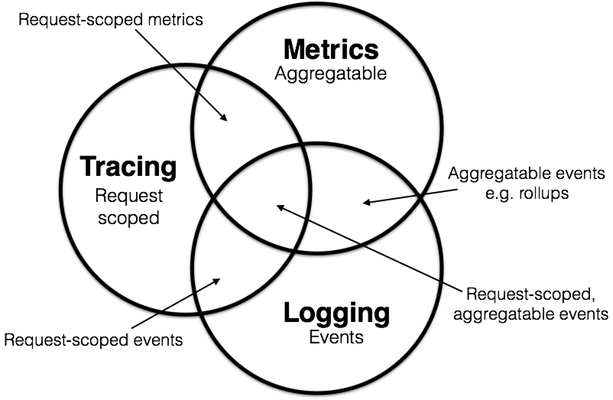
Observability
Observability

Metrics, Logs and Traces


Metrics
Photo by Altered Vision on Unsplash
Metrics
Logs

Photo by Oliver Paaske on Unsplash
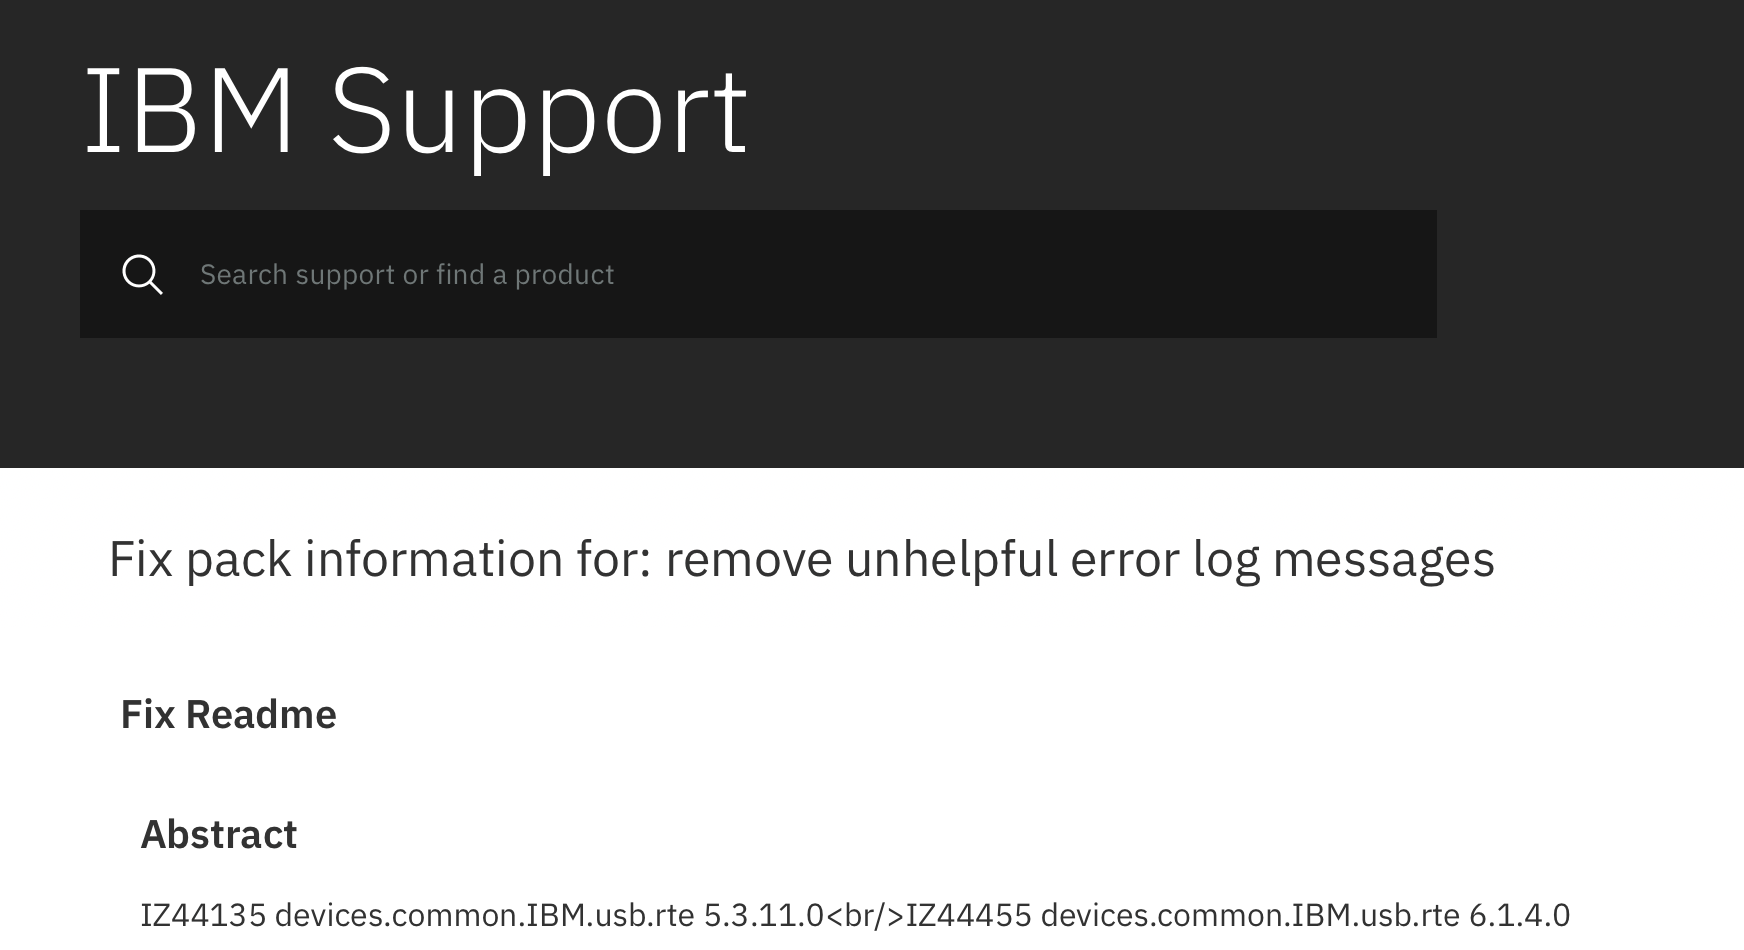
Logs
E0419 06:59:50.681167       1 reflector.go:138] pkg/mod/k8s.io/client-go@v0.22.4/tools/cache/reflector.go:167: Failed to watch *v1.Endpoints: the server has asked for the client to provide credentials (get endpoints)

time="2024-04-17T20:10:41Z" level=info msg="successfully synced configuration to kong." subsystem=proxy-cache-resolver
Logs
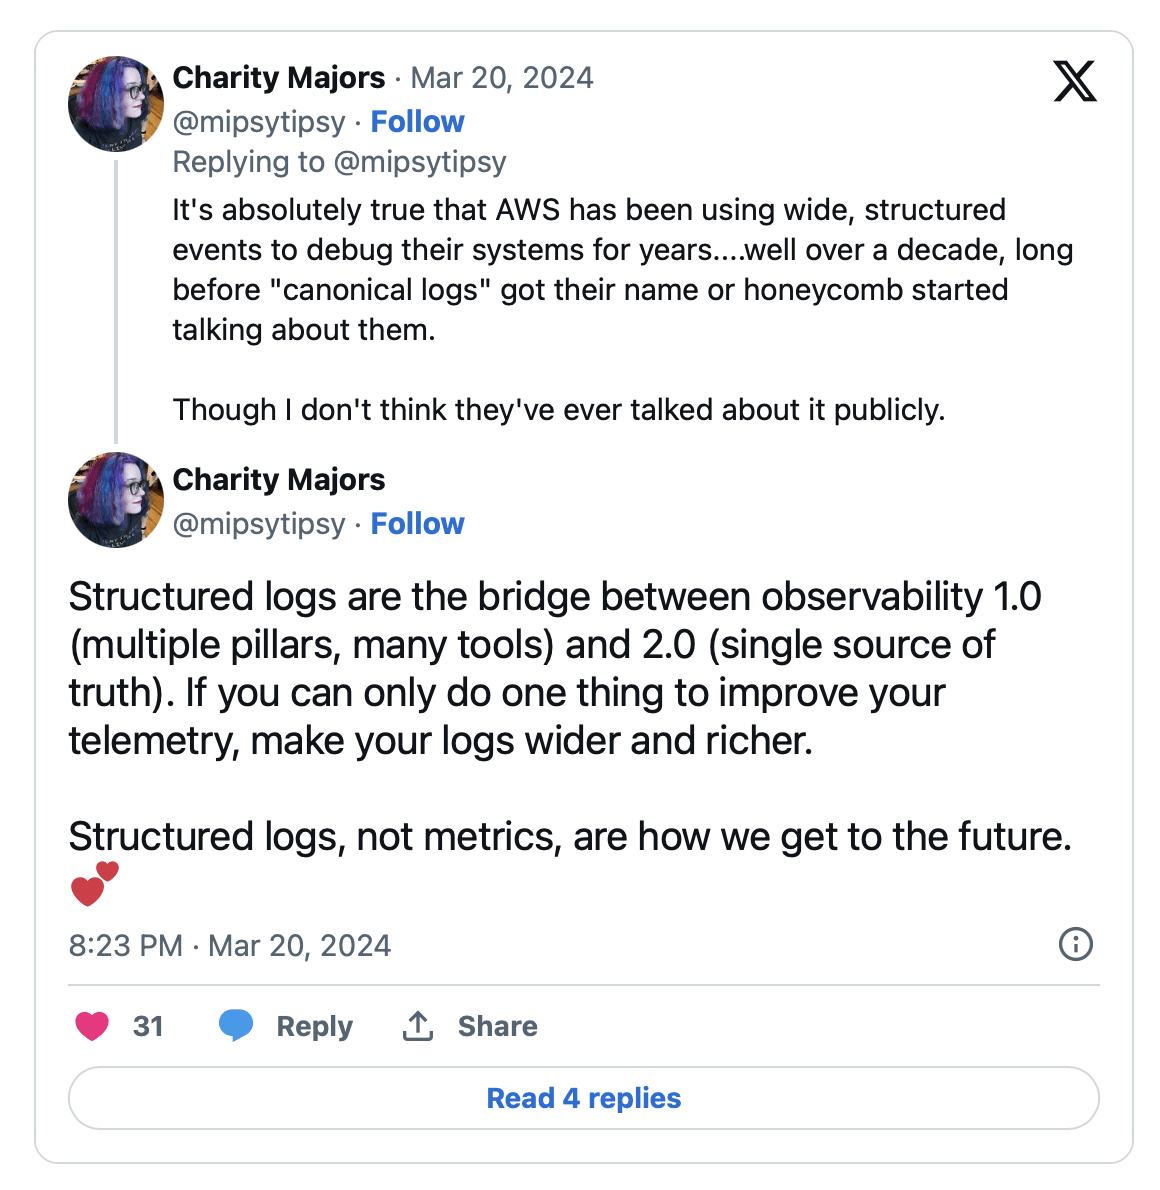
Logs
Logs
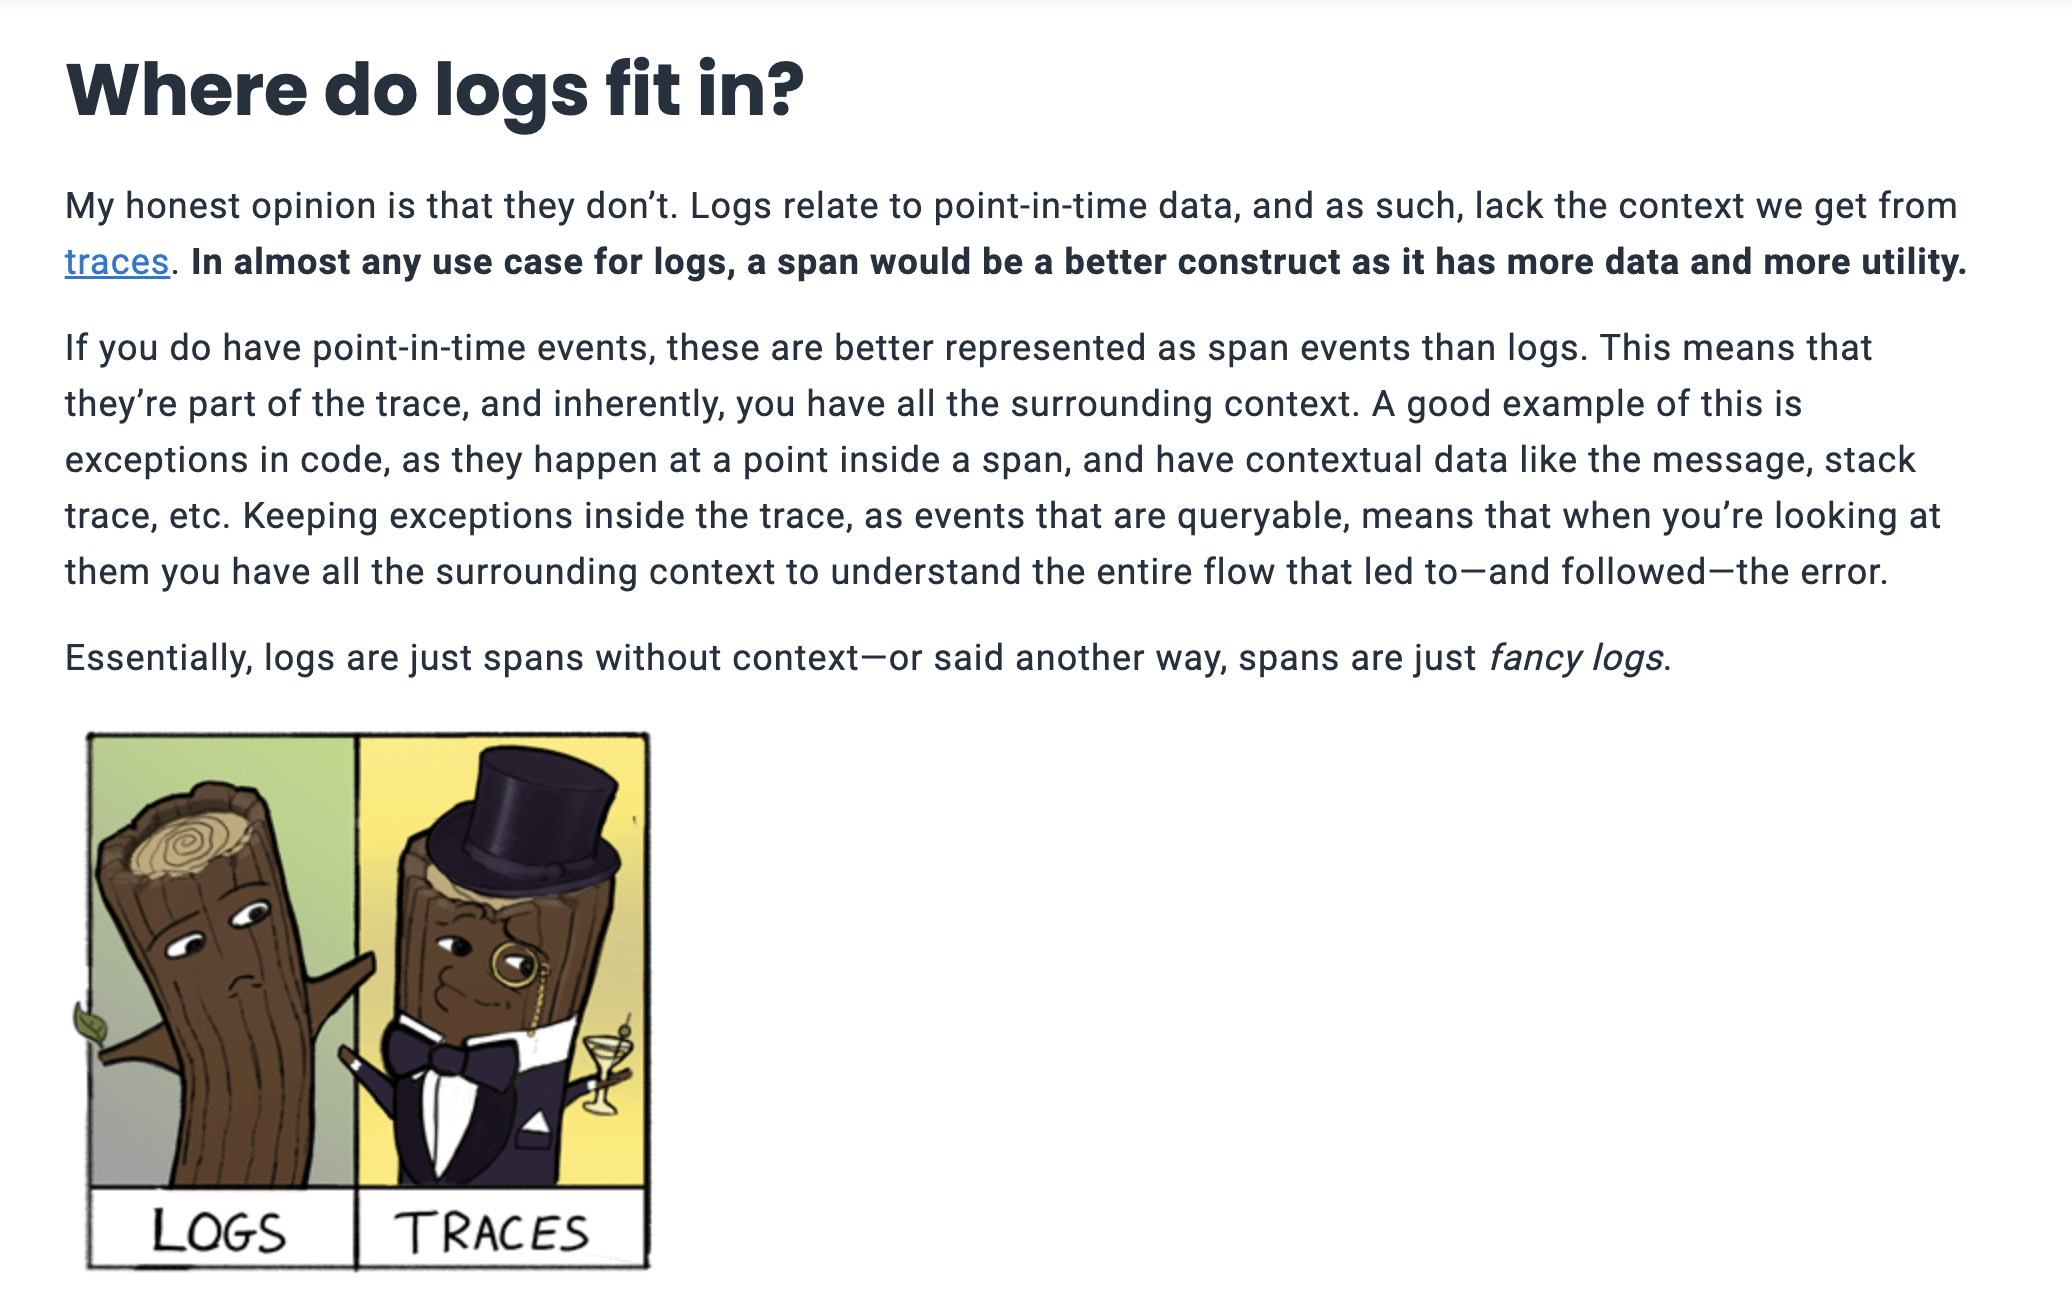
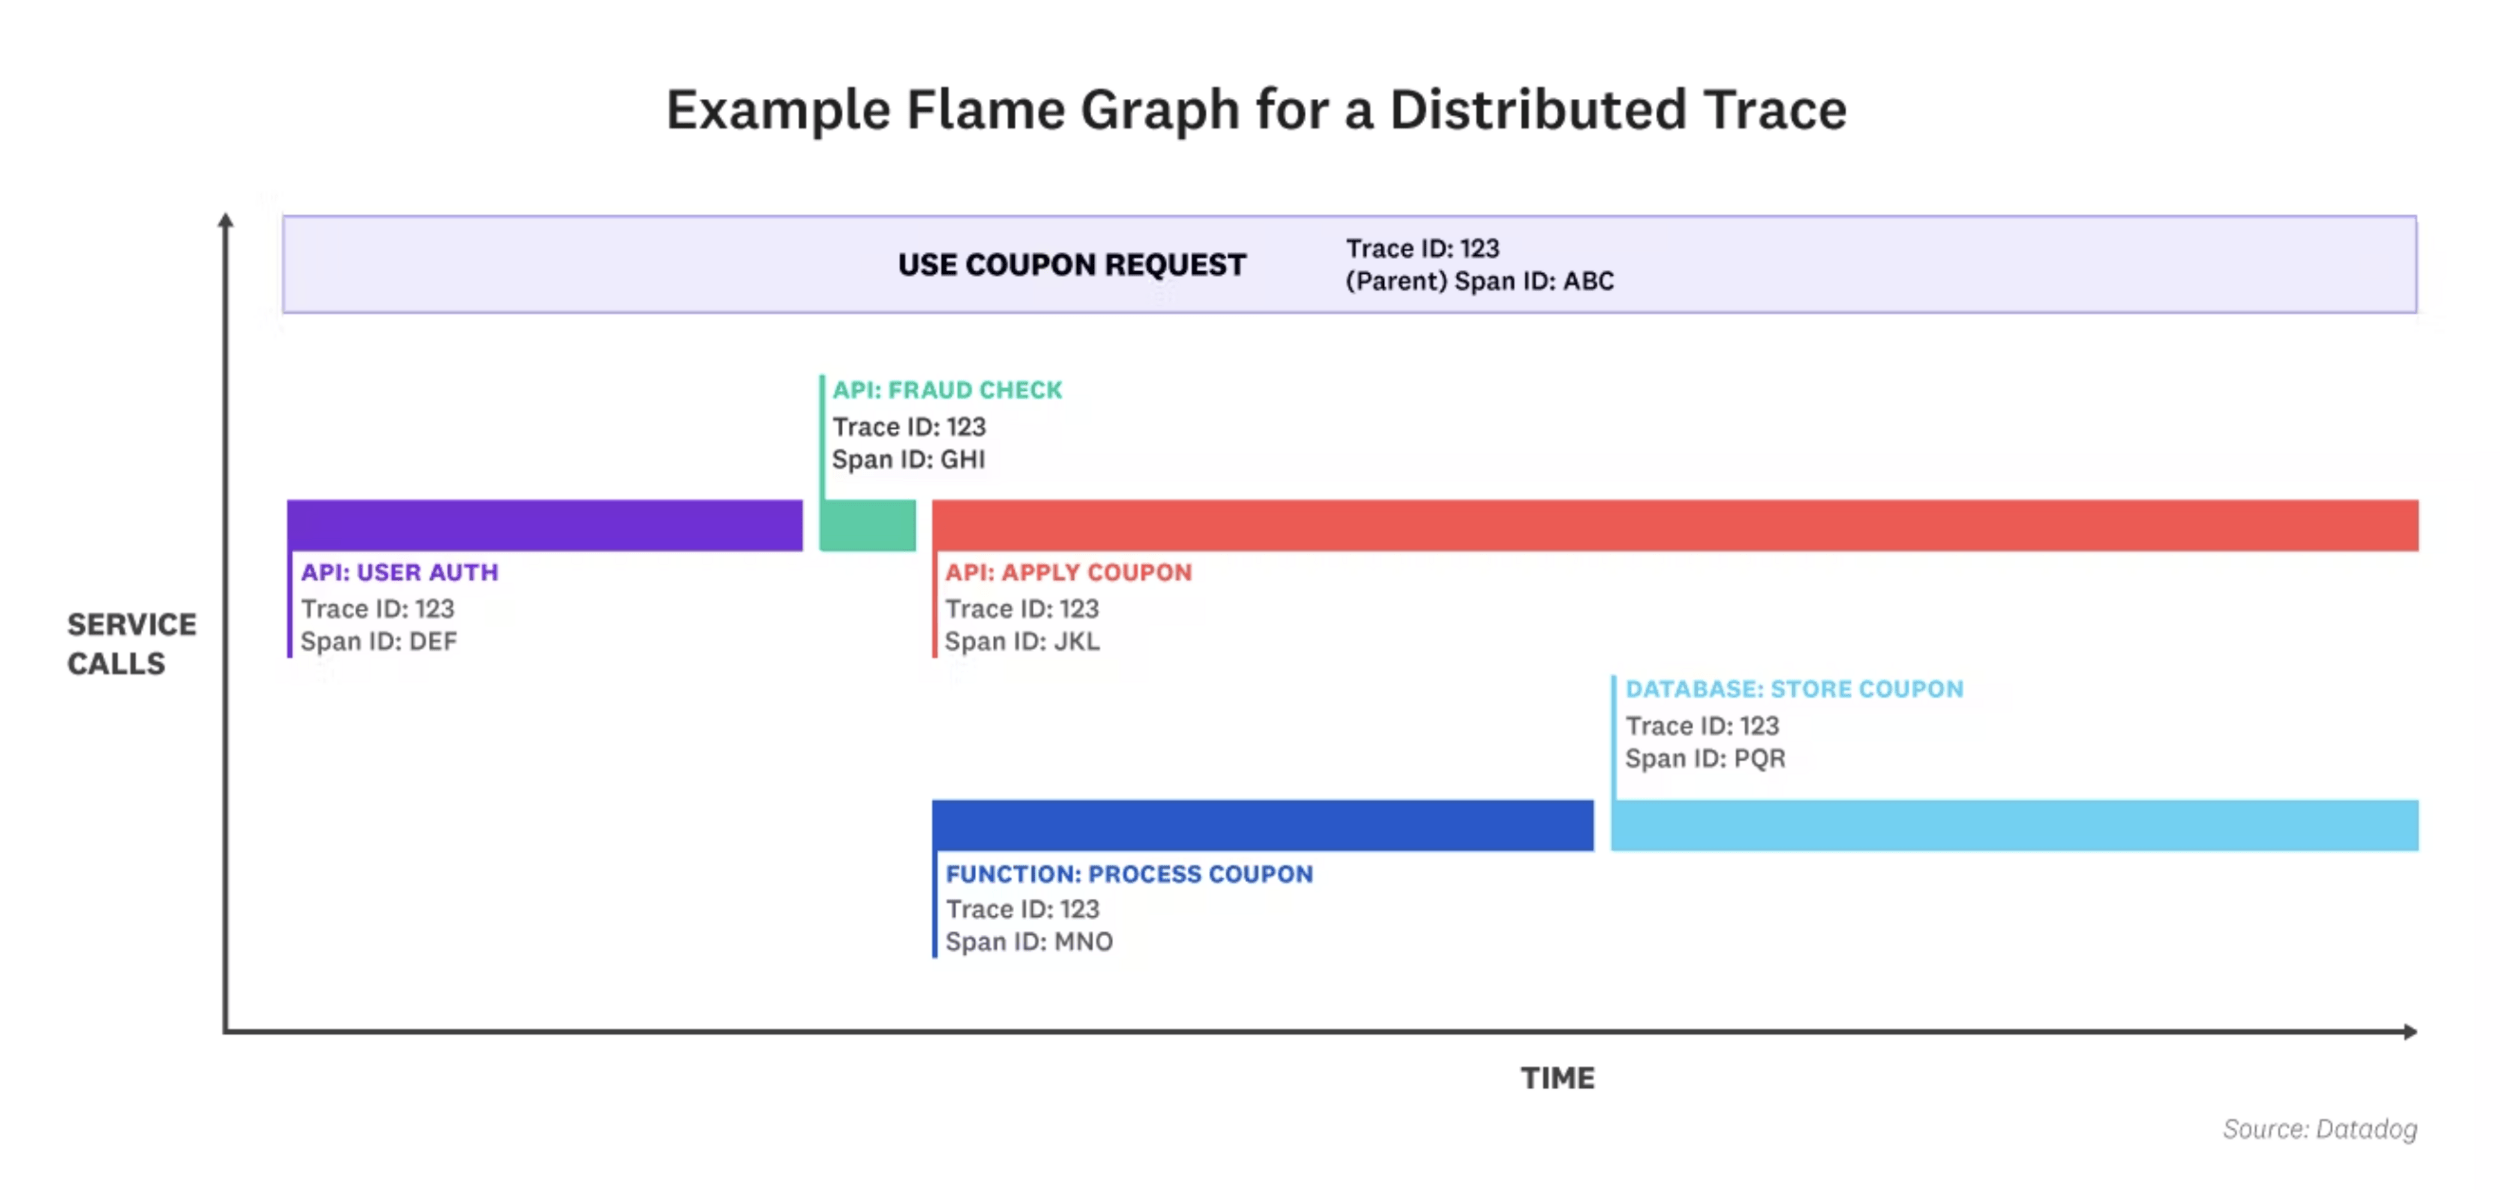
Traces
Traces
get '/posts' do
  Datadog::Tracing.trace('web.request', service: 'my-blog', resource: 'GET /posts') do |span|
    # Trace the activerecord call
    Datadog::Tracing.trace('posts.fetch') do
      @posts = Posts.order(created_at: :desc).limit(10)
    end

    # Add some APM tags
    span.set_tag('http.method', request.request_method)
    span.set_tag('posts.count', @posts.length)

    # Trace the template rendering
    Datadog::Tracing.trace('template.render') do
      erb :index
    end
  end
end
Traces
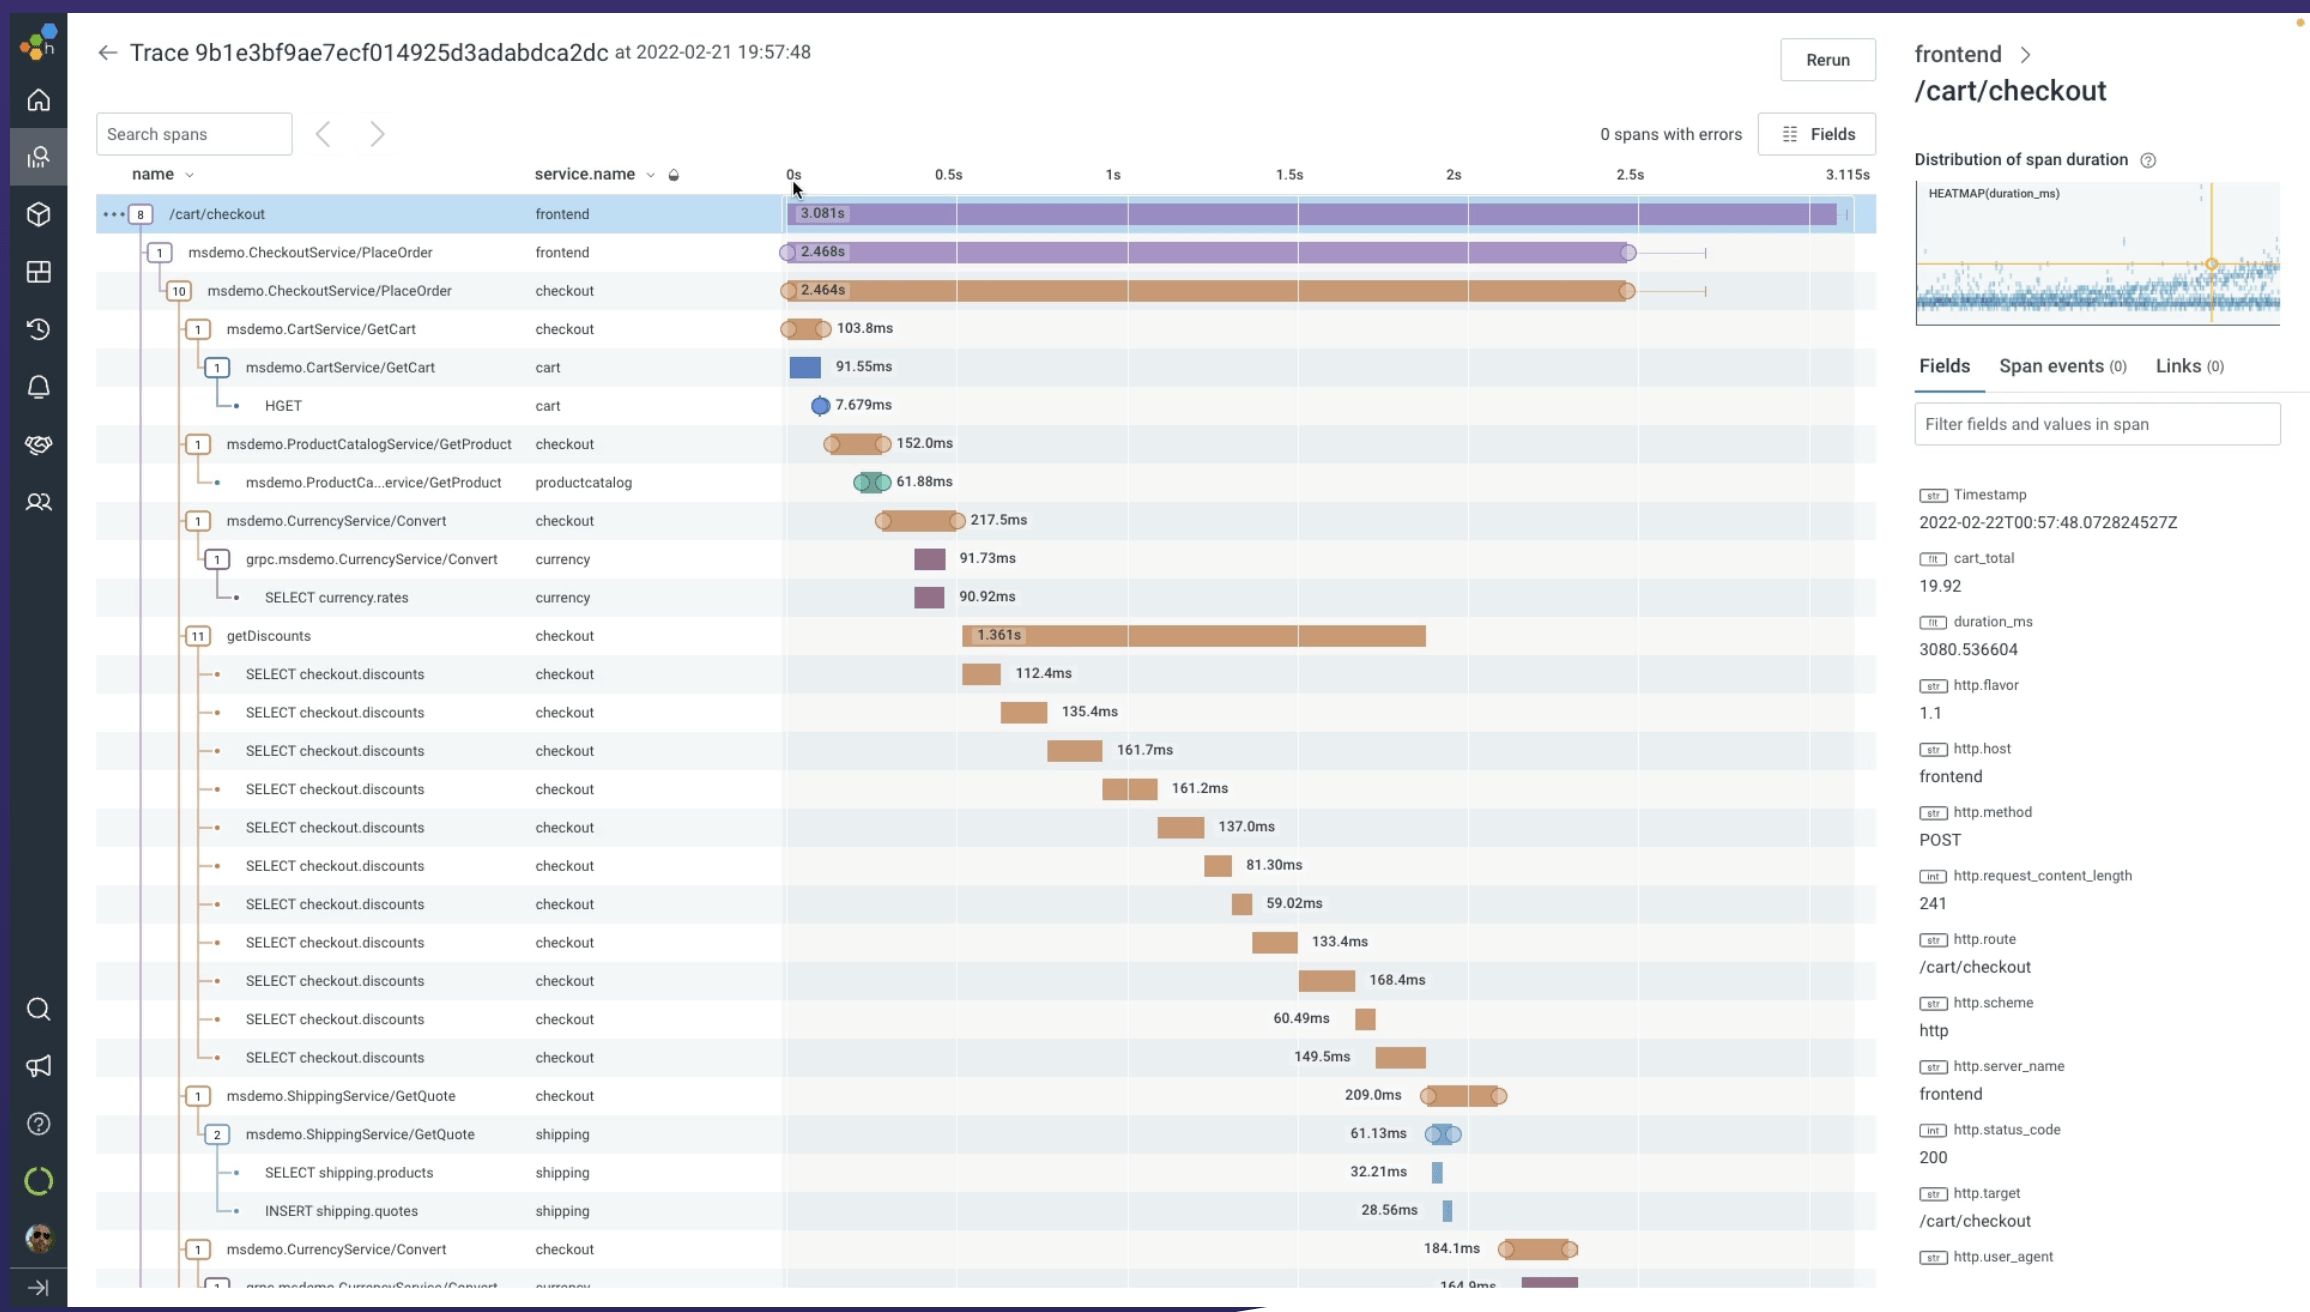
Traces
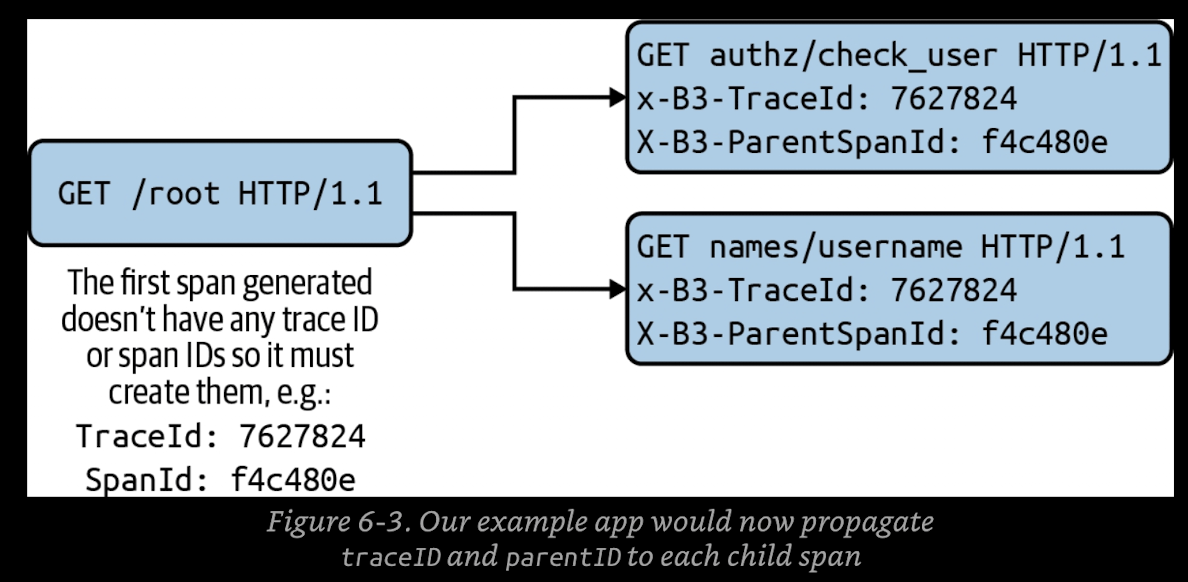
1.
2.
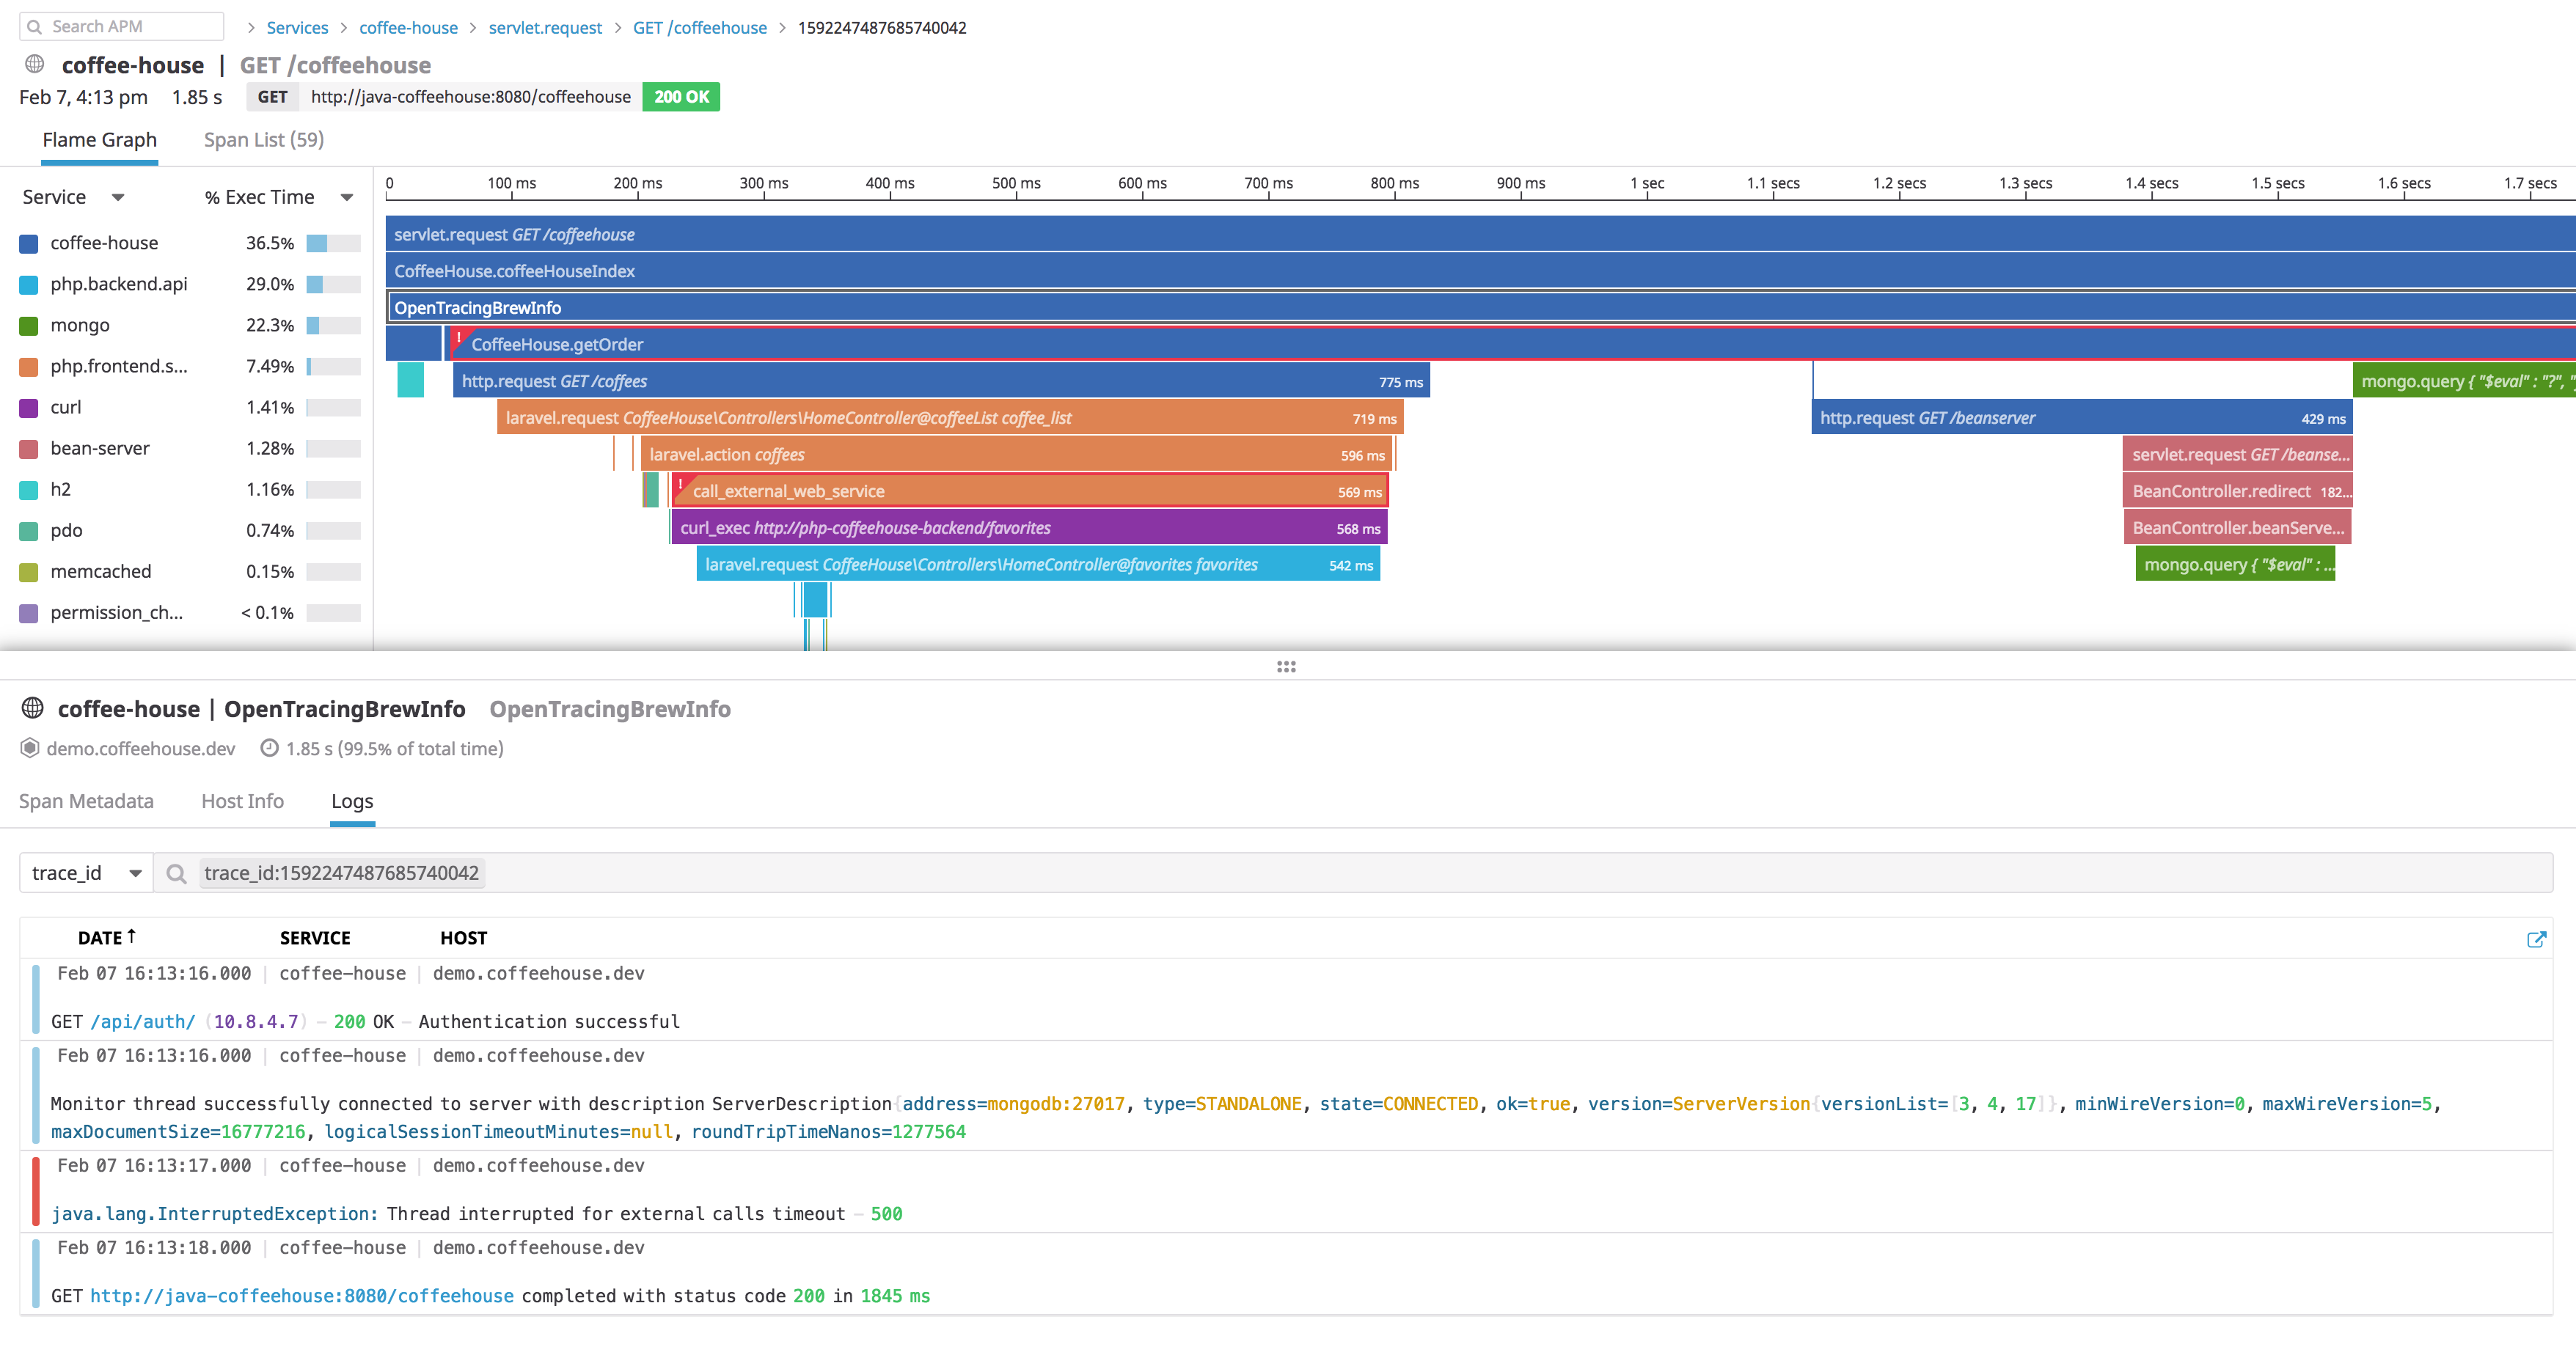
Traces
OpenTelemetry (OTEL)
OTel captures traces, metrics, logs, and other application telemetry data and lets you send it to the backend of your choice.
OTel ≈ Observability api + spec

OTel ≈ Observability api + spec
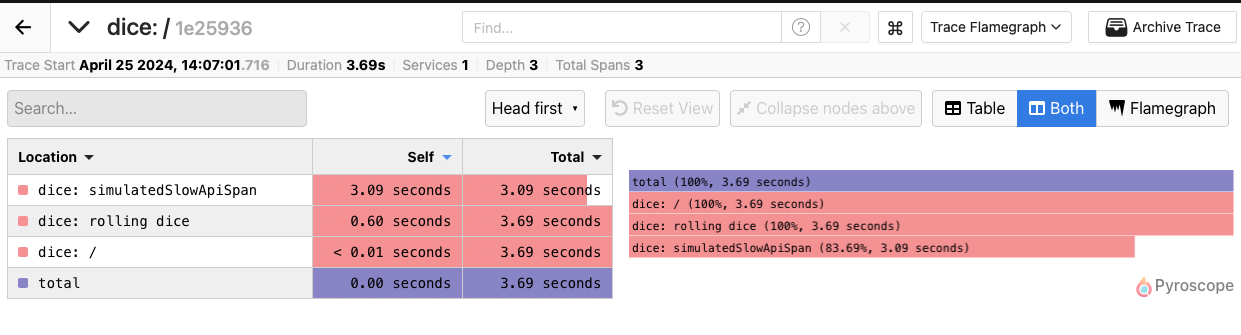
OTel me, code, why are you slow?
// main.go
func main() {
	http.HandleFunc("/rolldice", rolldice)
	log.Fatal(http.ListenAndServe(":8000", nil))
}
// rolldice.go
func rolldice(w http.ResponseWriter, r *http.Request) {
roll := 1 + rand.Intn(6)
// Sleep for a few seconds, so we can see longer traces
// And breakout the slow api call versus other work
// that might be done in this function, i.e. a DB query
time.Sleep(time.Millisecond * time.Duration(roll*100))
log.Println("simulating a call to external api")
err := simulateSlowAPI(500 * roll)
if err != nil {
log.Printf("Failed to make call to external api")
}
resp := strconv.Itoa(roll) + "\n"
if _, err := io.WriteString(w, resp); err != nil {
log.Printf("Write failed: %v\n", err)
}
}// > go run .
2024/08/12 20:45:09 running @ localhost:8000
2024/08/12 20:45:32 simulating a call to external api
2024/08/12 20:45:38 simulating a call to external api
2024/08/12 20:45:42 simulating a call to external api
2024/08/12 20:45:47 simulating a call to external api
// > watch -n 2 curl -s localhost:8000/rolldice
Every 2.0s: curl -s localhost:8000/rolldice
4## TODO: find out what is slow
_Assuming we didn't already know_ :)
- [ ] Add more logs
- [ ] Add metrics (response time, number of calls, etc)
*OR*
- [x] Add OTel// main.go
import "go.opentelemetry.io/contrib/instrumentation/net/http/otelhttp"
// Set up OpenTelemetry.
otelShutdown, err := setupOTelSDK(ctx)
if err != nil {
return
}
// Handle shutdown properly so nothing leaks.
defer func() {
err = errors.Join(err, otelShutdown(context.Background()))
}()
...
handleFunc := func(pattern string, handlerFunc func(http.ResponseWriter, *http.Request)) {
// Configure the "http.route" for the HTTP instrumentation.
handler := otelhttp.WithRouteTag(pattern, http.HandlerFunc(handlerFunc))
mux.Handle(pattern, handler)
handler := otelhttp.NewHandler(mux, "/")
// otel.go

func setupOTelSDK(ctx context.Context) (shutdown func(context.Context) error, err error) {

	// Set up trace provider.
	tracerProvider, err := newTraceProvider()
	if err != nil {
		handleErr(err)
		return
	}
	shutdownFuncs = append(shutdownFuncs, tracerProvider.Shutdown)
	otel.SetTracerProvider(tracerProvider)

    case "stdout":
	  exporter, err = stdouttrace.New(
        stdouttrace.WithPrettyPrint()
      )
// rolldice.go
var (
	tracer  = otel.Tracer("rolldice")
	meter   = otel.Meter("rolldice")
	rollCnt metric.Int64Counter
)

func rolldice(w http.ResponseWriter, r *http.Request) {
	ctx, span := tracer.Start(r.Context(), "rolling dice")
	defer span.End()

	roll := 1 + rand.Intn(6)

	// Sleep for a few seconds, so we can see longer traces
	// And breakout the slow api call versus other work
	// that might be done in this function, i.e. a DB query
	time.Sleep(time.Millisecond * time.Duration(roll*100))

	span.AddEvent("simulating a call to external api")
	err := simulateSlowAPI(500*roll, ctx)
	if err != nil {
		log.Printf("Failed to make call to external api")
	}

	rollValueAttr := attribute.Int("roll.value", roll)
	span.SetAttributes(rollValueAttr)
	rollCnt.Add(ctx, 1, metric.WithAttributes(rollValueAttr))
// rolldice.go

func simulateSlowAPI(sleepInMilliseconds int, ctx context.Context) error {
	ctx, childSpan := tracer.Start(ctx, "simulatedSlowApiSpan")
	defer childSpan.End()
	// Construct the URL with the sleep parameter
	baseURL := "https://fakeresponder.com/"
	sleepParam := "?sleep=" + strconv.Itoa(sleepInMilliseconds)
// ✗ go run .
{"Resource":[
{"Key":"service.name","Value":
{"Type":"STRING","Value":"dice"}
},
{"Key":"service.version","Value":
{"Type":"STRING","Value":"0.1.0"}
},
{"Key":"telemetry.sdk.language","Value":
{"Type":"STRING","Value":"go"}
},
{"Key":"telemetry.sdk.name","Value":
{"Type":"STRING","Value":"opentelemetry"}
},
{"Key":"telemetry.sdk.version","Value":
{"Type":"STRING","Value":"1.25.0"}
}
],"ScopeMetrics":[]}
{"Resource":[{"Key":"service.name","Value":{"Type":"STRING","Value":"dice"}},{"Key":"service.version","Value":{"Type":"STRING","Value":"0.1.0"}},{"Key":"telemetry.sdk.language","Value":{"Type":"STRING","Value":"go"}},{"Key":"telemetry.sdk.name","Value":{"Type":"STRING","Value":"opentelemetry"}},{"Key":"telemetry.sdk.version","Value":{"Type":"STRING","Value":"1.25.0"}}],"ScopeMetrics":[]}{
"Name": "/",
"SpanContext": {
"TraceID": "5a844fd338c4c00ec001fb28ea352c64",
"SpanID": "4908426582a52298",
},
"Parent": {
"TraceID": "00000000000000000000000000000000",
"SpanID": "0000000000000000",
},
"SpanKind": 2,
"StartTime": "2024-04-25T00:21:00.179788-06:00",
"EndTime": "2024-04-25T00:21:01.471713625-06:00",
"Attributes": [
{
"Key": "http.route",
"Value": {
"Type": "STRING",
"Value": "/rolldice"
}
},{
"Name": "rolling dice",
"SpanContext": {
"TraceID": "5a844fd338c4c00ec001fb28ea352c64",
"SpanID": "7e394450317027c5",
},
"Parent": {
"TraceID": "5a844fd338c4c00ec001fb28ea352c64",
"SpanID": "4908426582a52298",
},
"Attributes": [
{
"Key": "roll.value",
"Value": {
"Type": "INT64",
"Value": 2
}
}
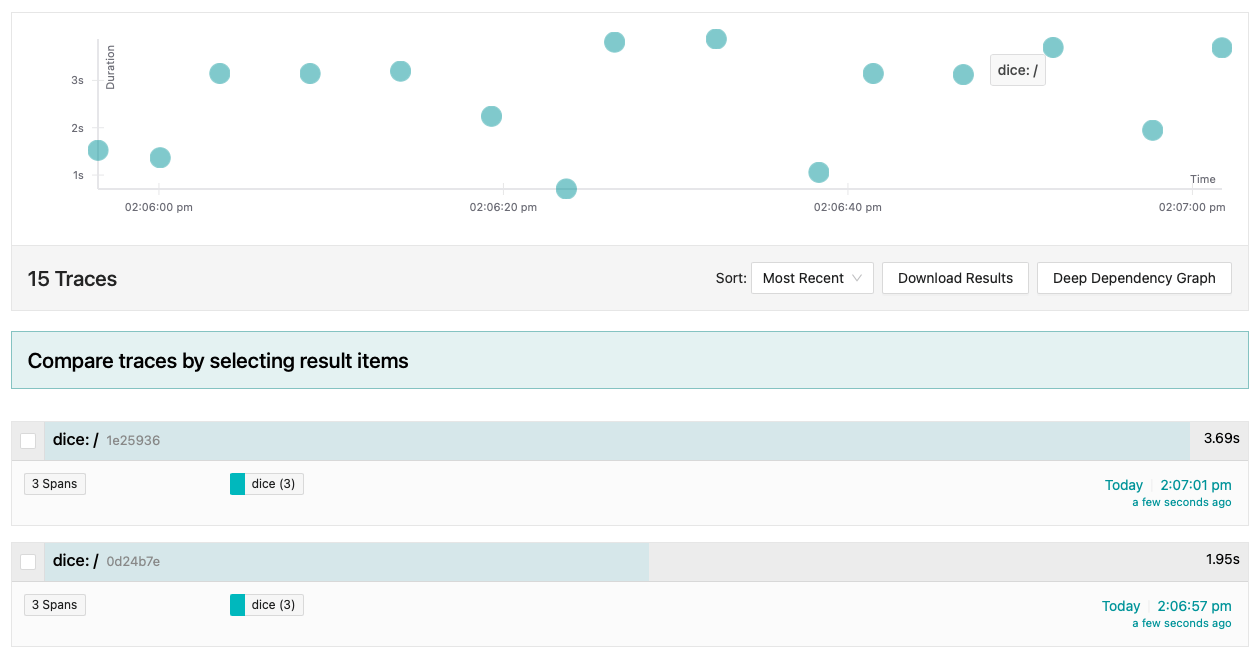
],🎲
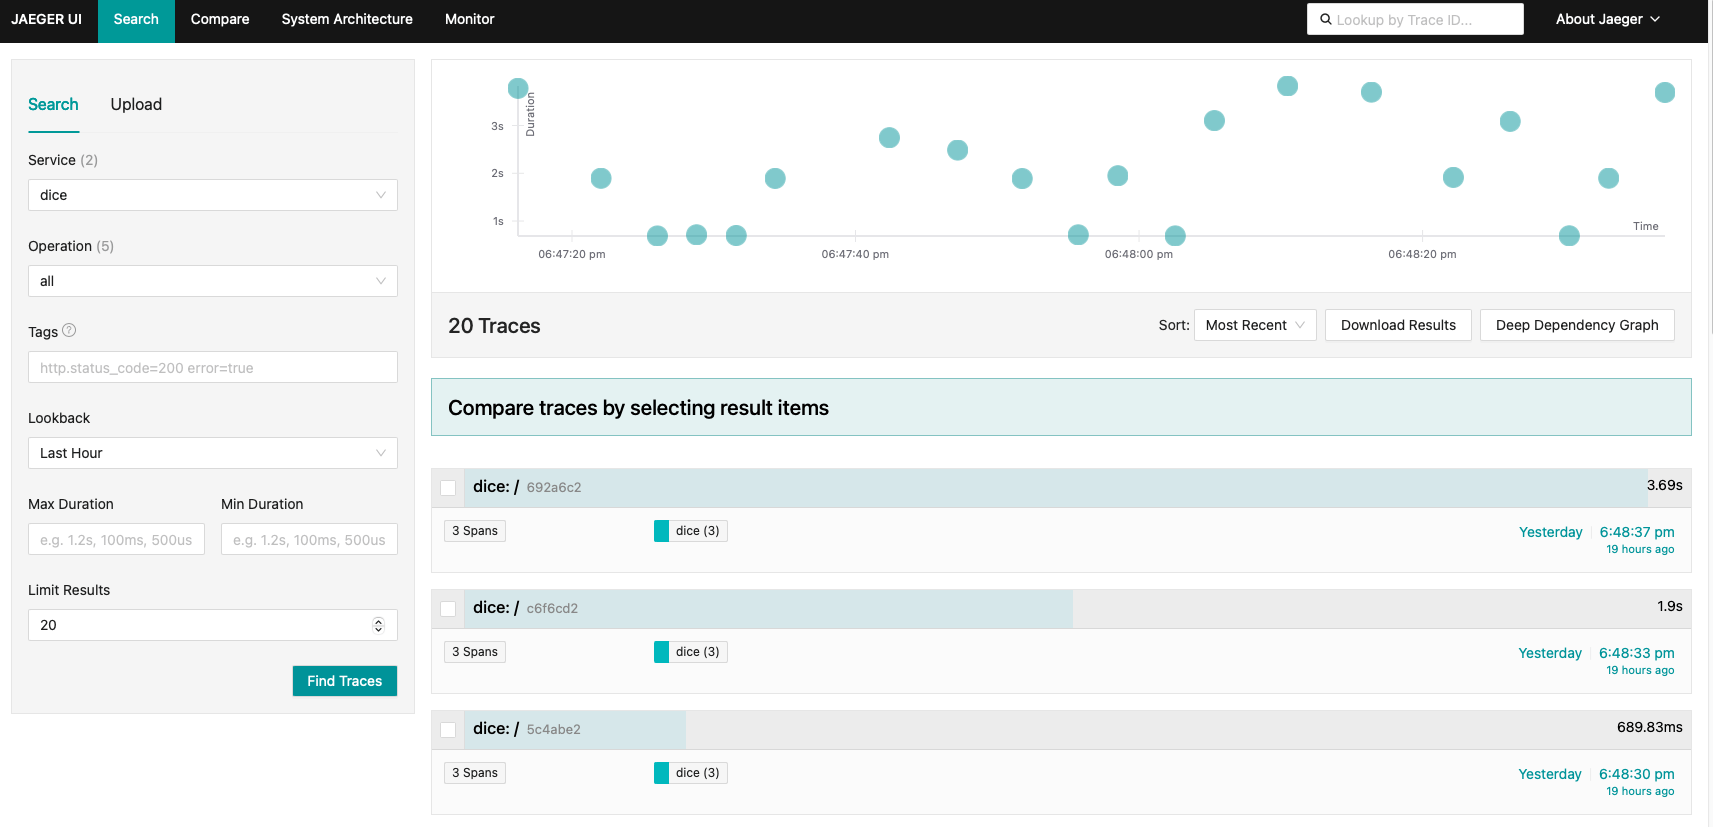
> docker run -d --name jaeger \
  -e COLLECTOR_OTLP_ENABLED=true \
  -p 16686:16686 \
  -p 4317:4317 \
  -p 4318:4318 \
  jaegertracing/all-in-one:latest


> OTEL_EXPORTER_OTLP_ENDPOINT=http://localhost:4318 go run .
// otel.go
func createOtelExporter(exporterType string) (trace.SpanExporter, error) {
case "otlp":
var opts []otlptracehttp.Option
exporter, err = otlptrace.New(
context.Background(),
otlptracehttp.NewClient(opts...),
)
case "stdout":
exporter, err = stdouttrace.New(stdouttrace.WithPrettyPrint())
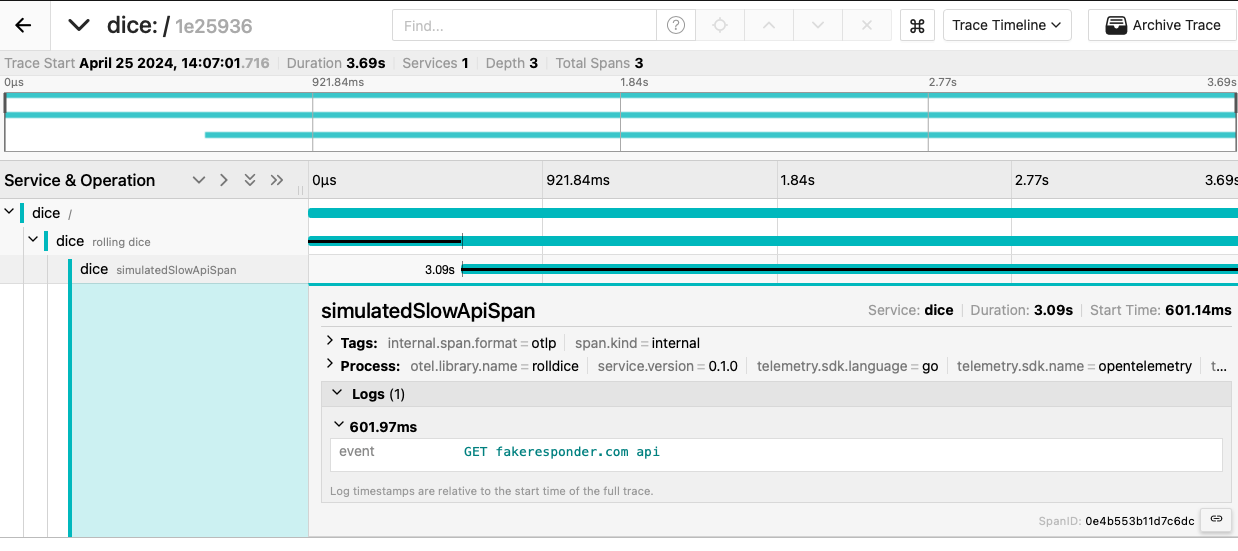
// rolldice.go

// A function for simulating slowness with an external http call
func simulateSlowAPI(sleepInMilliseconds int, ctx context.Context) error {
	_, childSpan := tracer.Start(ctx, "simulatedSlowApiSpan")
	defer childSpan.End()
	// Construct the URL with the sleep parameter
	baseURL := "https://fakeresponder.com/"
	sleepParam := "?sleep=" + strconv.Itoa(sleepInMilliseconds)

	// Create the full URL
	fullURL := baseURL + sleepParam

	// Make the GET request
	childSpan.AddEvent("GET fakeresponder.com api")
resp, err := http.Get(fullURL)// .env
# Honeycomb API key. Find one at https://ui.honeycomb.io/environments
export HONEYCOMB_API_KEY="your-Honeycomb-api-key-goes-here"
# Service name (opentelemetry standard field). Can be any string
export OTEL_SERVICE_NAME=sequence-of-numbers// ✗ go run main.go
Sending to Honeycomb with API Key <ykds> and service name intro-to-otel-sequence-of-numbers
Initializing the server... look for the app on http://localhost:3001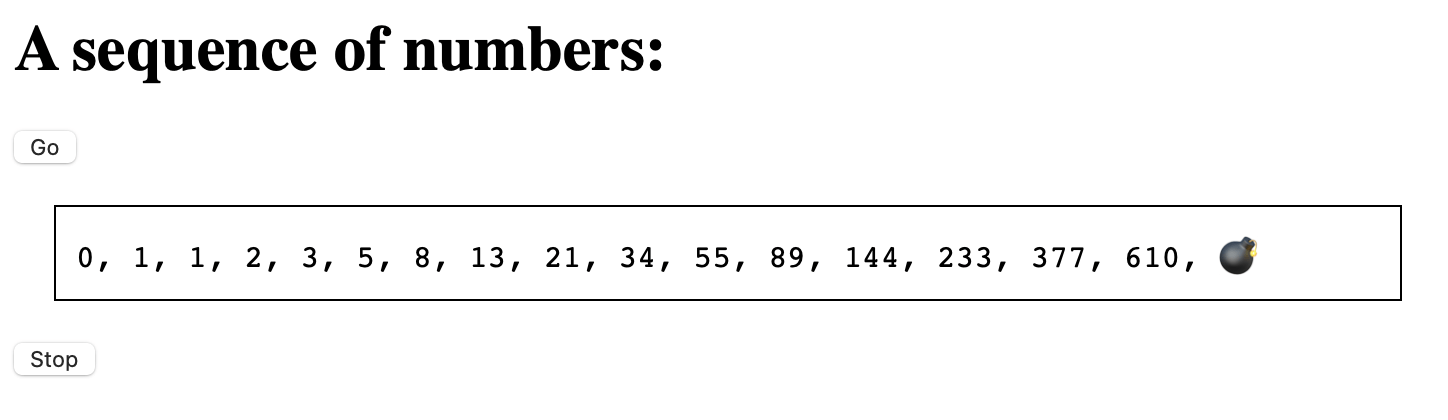
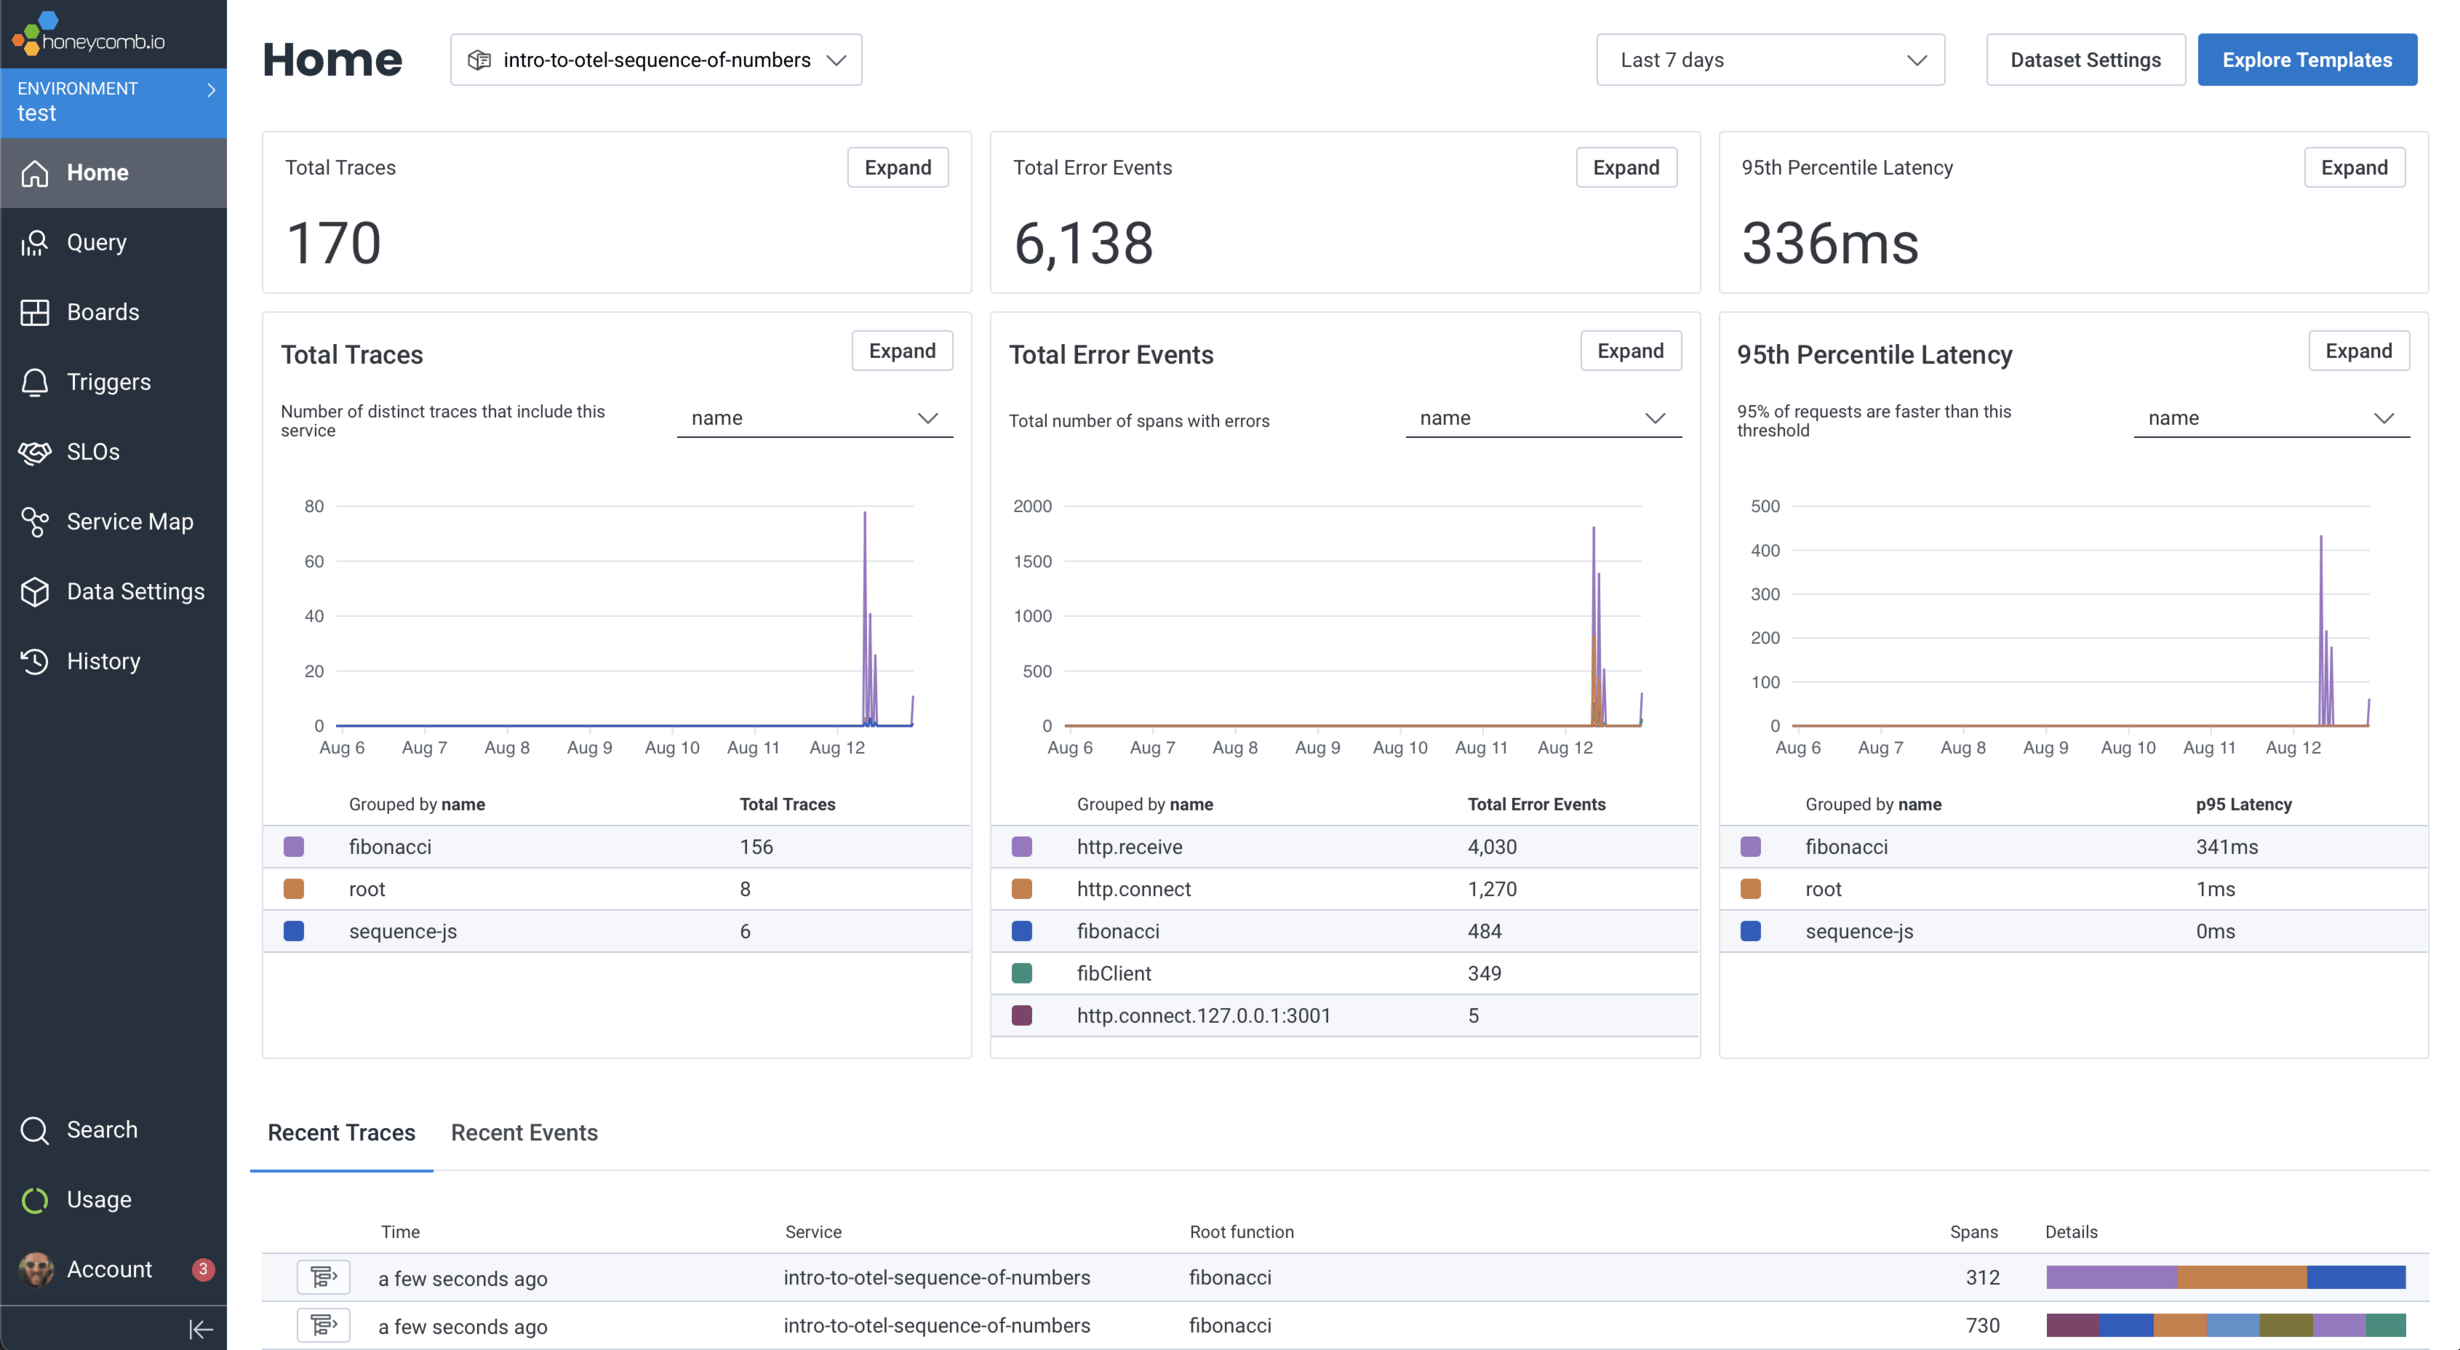
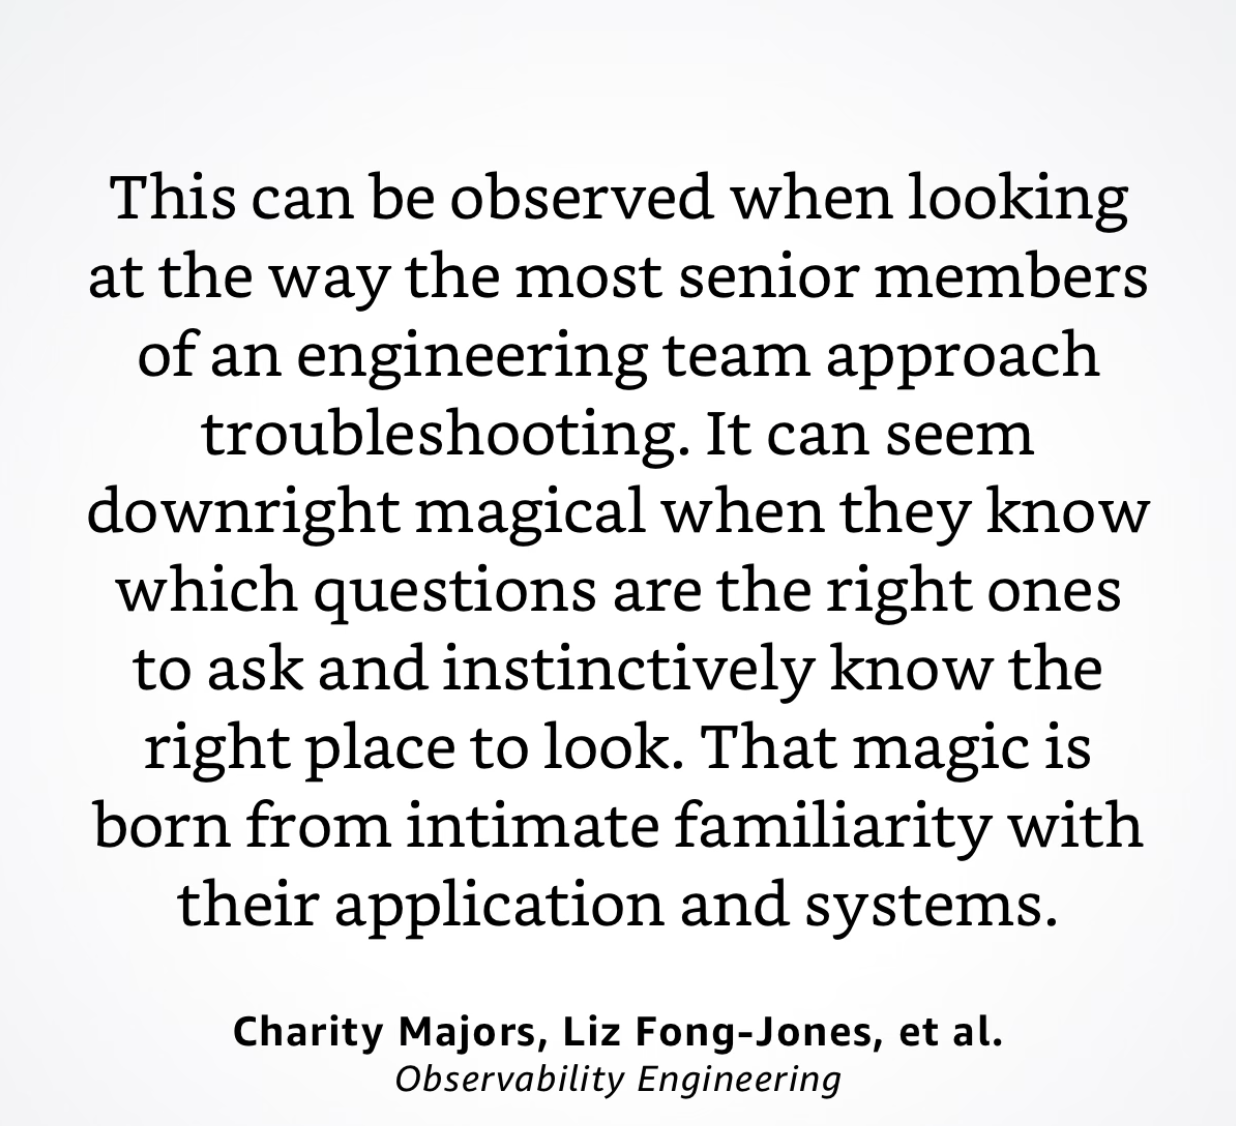
OTel your future self
Win a print copy of Observability Engineering
Observability
Thank you!
Photo by Frederick Marschall on Unsplash
OTel Me a Story: Observing Code in Production (DevOps Denver)
By virtualandy
OTel Me a Story: Observing Code in Production (DevOps Denver)
You shipped your code and someone says it’s busted. How can it be?! Observability is a super power to help you diagnose your systems. OpenTelemetry - or OTEL - is a set of APIs, SDKs and specs for observability. We’ll briefly cover Observability and how to get started so you can analyze and improve your software.


