Google Earth Engine
Britta Ricker, PhD
2023
(Press space bar to advance slides in order)
- Google Earth Engine
- Forest Data
- Call salb boundaries
- Calculate area
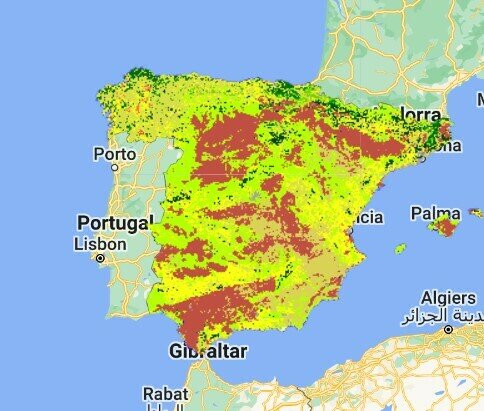
Final Result will look something like this
Outline
- What is Google Earth Engine?
- User Interface
- Basics of JavaScript
- Browse and add Data
- Sentinel (EU), LandSat (USA)
- Land use, Forest cover, Urban, Elevation
- Other?
- Clip to your country
- Change Colors
- Basic calculate area of land use
- Export data to use in QGIS
- make a legend (on your own)
What is Google Earth Engine?
- Computing platform and runs in your internet browser
- with a code editor,
- offers a compiler that runs in the Google cloud,
- hosts data on Google servers.
- Integrated Development Environment (IDE)
- Read more here
want more tutorials? https://tutorials.geemap.org/Image/image_visualization/
advanced https://courses.spatialthoughts.com/end-to-end-gee.html
Google Earth Engine is a
Data Repository (data as a service)
Software as a Service (SaaS)
Platform as a service (PaaS)
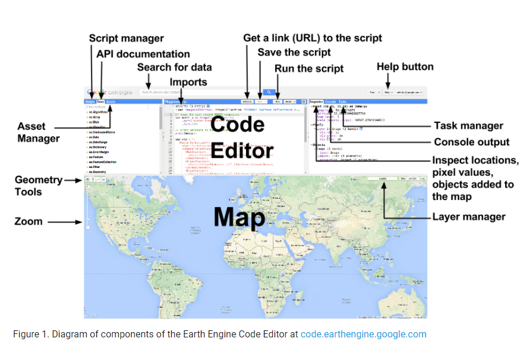
User Interface
{JavaScript}
is an interactive front-end scripting language
Statements - individual instruction or steps
statements end with a ;
Comments - explains what code does
// Displays a map
JavaScript is case sensitive
Variable - tell the system to remember or store data or a value
First Declare a variable
Then assign a value to a variable
Adding Data in Google Earth Engine
data types
ee.Image
ee.ImageCollection
ee.FeatureCollection
Image - is just that - bands
Image Collection - only images but lots of them
Feature- features and elements - rasters and or polygons
Basic of JavaScript
for GEE
Feel free to dig deeper on your own here
https://developers.google.com/earth-engine/tutorials/tutorials
click this link
scroll down at the bottom of the page in blue click "Open in Code Editor"
when the code editor opens
then hit run
in the map pane
when you hover over layers - toggle on and off the layers to make them visible
// Load a country border to a region of interest (roi).These are recognized boardings of the USA
var countries = ee.FeatureCollection('USDOS/LSIB_SIMPLE/2017');
var roi = countries.filterMetadata('country_na', 'equals', 'Spain');

//center the map on the coutnry identified by the ROI

Map.centerObject(roi);
# PRESENTING CODE
Now add the following lines of code to the top of the demo code to center the map on your country - change the country name "Spain" to your country
Forest Cover Example - Full script including Clip data to your country - and code comments
# PRESENTING CODE
// Load a country border to a region of interest (roi).These are recognized boardings of the USA

var countries = ee.FeatureCollection('USDOS/LSIB_SIMPLE/2017');
var roi = countries.filterMetadata('country_na', 'equals', 'Ethiopia');

//center the map on the coutnry identified by the ROI

Map.centerObject(roi);

var dataset = ee.Image('UMD/hansen/global_forest_change_2022_v1_10');

//select your country of interest by country
var datasetClip = dataset.clip(roi);

//style the clipped tree cover black no trees and green to trees. If you want global coverage call the dataset instead of clipped variable

var treeCoverVisParam = {
  bands: ['treecover2000'],
  min: 0,
  max: 100,
  palette: ['black', 'green']
};
Map.addLayer(datasetClip, treeCoverVisParam, 'tree cover');

//Style the clipped tree loss layer from yellow to red
var treeLossVisParam = {
  bands: ['lossyear'],
  min: 0,
  max: 22,
  palette: ['yellow', 'red']
};

//only add clipped forest loss area
Map.addLayer(datasetClip, treeLossVisParam, 'tree loss year');
hit run
- toggle on and off the layers
- you can change the transparency of the layers with the slider to the right of the layer name
- scroll around your country
- What do you notice?
Ok we added forest cover and loss
Now let's add
- Elevation
- Urban
- Land Cover
- Rivers
- What else?
not always easy to get everything to run together...
For this next part - let's start with a clean code editor
next to the "reset" button click the down arrow and select clear script.
# CHAPTER 2
About MODIS
Moderate Resolution Imaging Spectroradiometer (MODIS) Land Cover Type (MCD12Q1) Version 6.1 data product provides global land cover types at yearly intervals.
500 M resolution global
2001 to present
Let's add Modis Land Cover Data for the entire world for the year 2019 - is there another year you would like to search?
//Call Modis land cover dataset
var modisLandcover = ee.ImageCollection("MODIS/006/MCD12Q1")
//filter by date
var filtered = modisLandcover.filter(
  ee.Filter.date('2019-01-01', '2019-12-31'))

//landcover for the year 2019
var landcover2019 = ee.Image(filtered.first())
//classify data based on land class type 1
var classified = landcover2019.select('LC_Type1')

 //color palette for the classification - this matches the Modus official color pallet but feel free to play here
var palette = ['05450a', '086a10', '54a708',
 '78d203', '009900', 'c6b044','dcd159',
 'dade48', 'fbff13', 'b6ff05', '27ff87',
 'c24f44', 'a5a5a5', 'ff6d4c', '69fff8',
 'f9ffa4', '1c0dff']

//add the visualized modis data to the map and label name landcover 2019 the entire world
Map.addLayer(classified,
{min:1, max:17, palette: palette},
'Land cover entire world 2019');
# CHAPTER 2
Save your work
click Save in the code editor.
pick a name you will remember
Code will be saved to your google account
Highlighting Japan
// Load a country border to a region of interest (roi).These are recognized boardings of the USA

var countries = ee.FeatureCollection('USDOS/LSIB_SIMPLE/2017');
var roi = countries.filterMetadata('country_na', 'equals', 'Japan');

//center the map on the coutnry identified by the ROI

Map.centerObject(roi);

var dataset = ee.Image('UMD/hansen/global_forest_change_2022_v1_10');

//select your country of interest by country
var datasetClip = dataset.clip(roi);

//Style the clipped tree loss layer from yellow to red
var treeLossVisParam = {
  bands: ['lossyear'],
  min: 0,
  max: 22,
  palette: ['yellow', 'red']
};
//style the clipped tree cover black no trees and green to trees. If you want global coverage call the dataset instead of clipped variable

var treeCoverVisParam = {
  bands: ['treecover2000'],
  min: 0,
  max: 100,
  palette: ['#edf8fb',  '#b2e2e2', '#66c2a4','#2ca25f','#006d2c']
};
Map.addLayer(datasetClip, treeCoverVisParam, 'tree cover');

//only add clipped forest loss area
Map.addLayer(datasetClip, treeLossVisParam, 'tree loss year');
# PRESENTING CODE
Highlighting Japan - color pallet
// Load a country border to a region of interest (roi).These are recognized boardings of the USA

var countries = ee.FeatureCollection('USDOS/LSIB_SIMPLE/2017');
var roi = countries.filterMetadata('country_na', 'equals', 'Japan');

//center the map on the coutnry identified by the ROI

Map.centerObject(roi);

var dataset = ee.Image('UMD/hansen/global_forest_change_2022_v1_10');

//select your country of interest by country
var datasetClip = dataset.clip(roi);

//Style the clipped tree loss layer from yellow to red
var treeLossVisParam = {
  bands: ['lossyear'],
  min: 0,
  max: 22,
  palette: ['yellow', 'red']
};
//style the clipped tree cover black no trees and green to trees. If you want global coverage call the dataset instead of clipped variable

var treeCoverVisParam = {
  bands: ['treecover2000'],
  min: 0,
  max: 100,
  palette: [
'#77a37a',
'#5f926a',
'#587e60',
'#485e52',
'#3a4f3f'
    ]
};
Map.addLayer(datasetClip, treeCoverVisParam, 'tree cover');

//only add clipped forest loss area
Map.addLayer(datasetClip, treeLossVisParam, 'tree loss year');
# PRESENTING CODE
Here is the full script with a clip to your country - region of interest (roi) this time using FAO polygons instead of US State Department (does this matter?)
What is commented out here?
//Call Modis land cover dataset
var modisLandcover = ee.ImageCollection("MODIS/006/MCD12Q1")
//filter by date
var filtered = modisLandcover.filter(
  ee.Filter.date('2019-01-01', '2019-12-31'))

//landcover for the year 2019
var landcover2019 = ee.Image(filtered.first())
//classify data based on land class type 1
var classified = landcover2019.select('LC_Type1')

 //color palette for the classification - this matches the Modus official color pallet but feel free to play here
var palette = ['05450a', '086a10', '54a708',
 '78d203', '009900', 'c6b044','dcd159',
 'dade48', 'fbff13', 'b6ff05', '27ff87',
 'c24f44', 'a5a5a5', 'ff6d4c', '69fff8',
 'f9ffa4', '1c0dff']

//add the visualized modis data to the map and label name landcover 2019 the entire world - commenting this out bc we only want our country
//Map.addLayer(classified,
// {min:1, max:17, palette: palette},
 //'Land cover entire world 2019');

 // add roi using FAO countries

var gaul = ee.FeatureCollection("FAO/GAUL_SIMPLIFIED_500m/2015/level1")
var roi = gaul.filter(
  ee.Filter.eq('ADM0_NAME', 'Spain'))
//Map.addLayer(roi, {color: 'purple'}, 'UN Country Name')

 // clip to only your country
 var roiLandcover = classified.clip(roi)
Map.addLayer(roiLandcover,
 {min:1, max:17, palette: palette},
 'ROI Land Cover 2019')
//don't forget to center the map on your country
Map.centerObject(roi);
Let's clip to your country - region of interest (roi) with the US State dept data
// Load a country border to a region of interest (roi).These are recognized boardings of the USA
var countries = ee.FeatureCollection('USDOS/LSIB_SIMPLE/2017');
var roi = countries.filterMetadata('country_na', 'equals', 'Spain');

//center the map on the coutnry identified by the ROI

Map.centerObject(roi);

//Call Modis land cover dataset
var modisLandcover = ee.ImageCollection("MODIS/006/MCD12Q1")
//filter by date
var filtered = modisLandcover.filter(
  ee.Filter.date('2019-01-01', '2019-12-31'))

//landcover for the year 2019
var landcover2019 = ee.Image(filtered.first())
//classify data based on land class type 1
var classified = landcover2019.select('LC_Type1')


 // clip to only your country
 var roiLandcover = classified.clip(roi)


 //color palette for the classification - this matches the Modus official color pallet but feel free to play here
var palette = ['05450a', '086a10', '54a708',
 '78d203', '009900', 'c6b044','dcd159',
 'dade48', 'fbff13', 'b6ff05', '27ff87',
 'c24f44', 'a5a5a5', 'ff6d4c', '69fff8',
 'f9ffa4', '1c0dff']

//add the visualized modis data to the map and label name landcover 2019 the entire world
Map.addLayer(roiLandcover,
{min:1, max:17, palette: palette},
'Land cover entire world 2019');
Now add another dataset - this is elevation
read comments carefully
make changes you see fit
 //add elevation data
var dem = ee.Image('CGIAR/SRTM90_V4');
var elevation = dem.select('elevation');

 // clip to only your country
 var elevationclip = elevation.clip(roi)
//add to map you can play with the color pallet and the max numbers to make the varation stick out
Map.addLayer(elevationclip, {min: 0, max: 1000, palette: ['#000004', '#50127b', '#b63679', '#fc8761', '#fdfd65']}, 'Elevation');
All together now
Land Cover
Elevation
Clipped to your ROI
// Load a country border to a region of interest (roi).These are recognized boardings of the USA
var countries = ee.FeatureCollection('USDOS/LSIB_SIMPLE/2017');
var roi = countries.filterMetadata('country_na', 'equals', 'Spain');

//center the map on the coutnry identified by the ROI

Map.centerObject(roi);

//Call Modis land cover dataset
var modisLandcover = ee.ImageCollection("MODIS/006/MCD12Q1")
//filter by date
var filtered = modisLandcover.filter(
  ee.Filter.date('2019-01-01', '2019-12-31'))

//landcover for the year 2019
var landcover2019 = ee.Image(filtered.first())
//classify data based on land class type 1
var classified = landcover2019.select('LC_Type1')


 // clip to only your country
 var roiLandcover = classified.clip(roi)


 //color palette for the classification - this matches the Modus official color pallet but feel free to play here
var palette = ['05450a', '086a10', '54a708',
 '78d203', '009900', 'c6b044','dcd159',
 'dade48', 'fbff13', 'b6ff05', '27ff87',
 'c24f44', 'a5a5a5', 'ff6d4c', '69fff8',
 'f9ffa4', '1c0dff']

//add the visualized modis data to the map and label name landcover 2019 the entire world
Map.addLayer(roiLandcover,
{min:1, max:17, palette: palette},
'Land cover 2019');

//add elevation data
var dem = ee.Image('CGIAR/SRTM90_V4');
var elevation = dem.select('elevation');

 // clip to only your country
 var elevationclip = elevation.clip(roi)
//add to map you can play with the color pallet and the max numbers to make the varation stick out
Map.addLayer(elevationclip, {min: 0, max: 1000, palette: ['#000004', '#50127b', '#b63679', '#fc8761', '#fdfd65']}, 'Elevation');
{hex colors}
Change colors using hex codes
Color Schemes
Qualitative
Land use classification are qualitative or normative data
1.
2.
Sequential
Useful for ordinal data
GEE-stretched between 2 values
3.
Diverging
Best when their is a known zero, but also can be helpful to show variation
# CHAPTER 2
#e5f5f9
#99d8c9
#2ca25f
Color Schemes
Qualitative
Land use classification are qualitative or normative data
1.
2.
Sequential
Useful for ordinal data
3.
Diverging
Best when their is a known zero, but also can be helpful to show variation
# CHAPTER 2
Calculate area of urban areas based on the modis data
add this to your existing code from last slide
//now we will calculate the area of your country from this tutorial https://spatialthoughts.com/2020/06/19/calculating-area-gee/


var stateArea = roi.geometry().area()
var stateAreaSqKm = ee.Number(stateArea).divide(1e6).round()
print(stateAreaSqKm)
// Result can be seen in the console on the right: Spain 505195

//next calculate the area of urban areas

var urban = roiLandcover.eq(13)

//visualize urban areas as blue and everything else as grey name of layer is Urban
Map.addLayer(urban,
 {min:0, max:1, palette: ['grey', 'blue']},
 'Urban')
 //here we calculate the pixel area - changing the pixel value to 0 or 1 urban or not
var areaImage = urban.multiply(ee.Image.pixelArea())
var area = areaImage.reduceRegion({
  reducer: ee.Reducer.sum(),
  geometry: roi.geometry(),
  scale: 500,
  maxPixels: 1e10
  })
var urbanAreaSqKm = ee.Number(
  area.get('LC_Type1')).divide(1e6).round()
print(urbanAreaSqKm)
// Result: Spain = 5584
What happened?
Area Urban
print will calculate a value and show in the Console, in this case it is total urban area
1.
2.
Reducer
Reduced data from 1 is urban and 0 non urban
Use the inspector and click on a pixel and see LC_type 1 value
3.
New Layer
Urban in blue (change the color)
Non-Urban grey (make transparent!)
# CHAPTER 2
// Export a cloud-optimized GeoTIFF.
Export.image.toDrive({
  image: urban,
  description: 'urban',
  region: roi,
  fileFormat: 'GeoTIFF',
  formatOptions: {
    cloudOptimized: true
  }
});
# PRESENTING CODE
Export your new layer
it is stored in your root directory of Google Drive
see this extremely advanced example example https://code.earthengine.google.com/?scriptPath=Examples%3AUser%20Interface%2FForest%20Change
Code
By Britta Ricker


