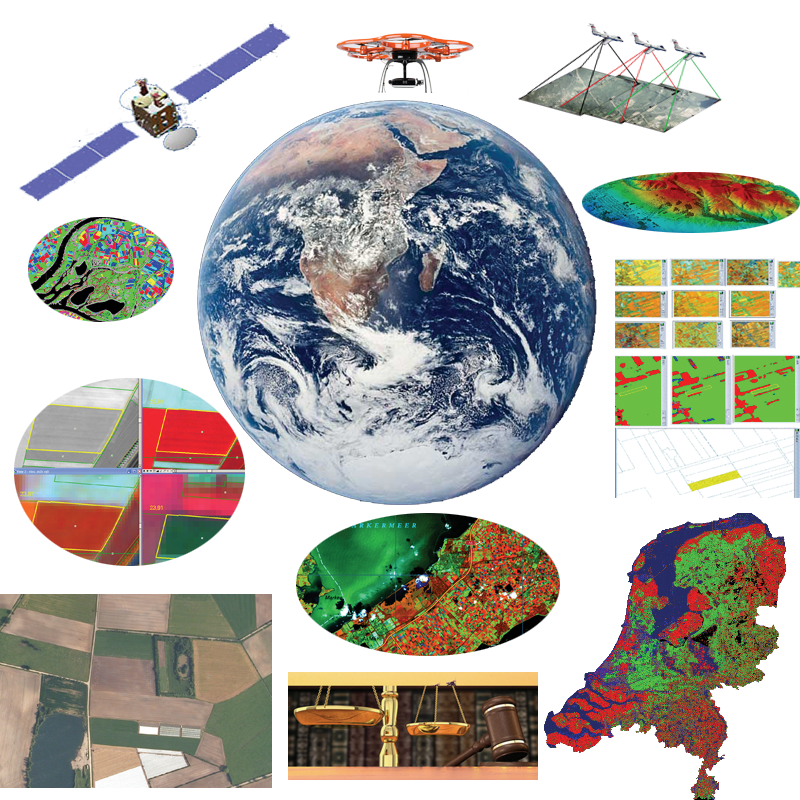
Basics of
Remote Sensing


Britta Ricker, PhD
Today in Class
- GIS & Remote Sensing
- Color Composites
- CyberGIS and Big Data
- Supervised and Unsupervised Classification
- How can remote sensing be used to monitor the SDGs?
- Review: How do these concepts relate to land use change?
Disaster and Land Use


Maps can help reduce complexity

Vanacker (2016) Impact of deforestation on slope stability

McSweeney (2017) Cocaine trafficking is destroying Central Americ's forests
Geographic Information
Science
Geographic Information Systems(GIS)

Geographic Information Systems (GIS)


Online "slippy" maps

Remote Sensing
Temporal Resolution: Revisit Every 5 days
True Color

Details
From Sentinel 2
Date of image: 22 Feb 2017
Spatial Resolution:
Each pixel represents 20 m
2325 columns
2960 rows of pixels

Sentinel 2
Active Sensor
Passive Sensor

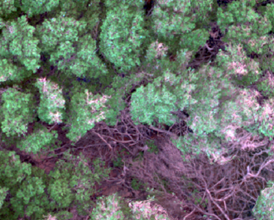
Lidar


1 m resolution!
Electromagnetic Energy
Features on the Earth reflect, absorb, transmit, and emit electromagnetic energy from the sun.

Properties of electromagnetic energy
Multispectral imagery
wavelength, fequency, amplitude

The visible spectrum is small!

What else is collected?
Bands and spectral ranges

Spectral signature

How are images rendered on our screen?
3 bands projected light
The primary colors are Red, Green, Blue
True Color
= Band 4 Red
= Band 3 Green
= Band 2 Blue

False Color Composites

Urban areas

Urban=Purple
= Band 12 SWIR II
= Band 11 SWIR I
= Band 4 Red
Vegetation
= Band 8 NIR
= Band 4 Blue
= Band 3 Red

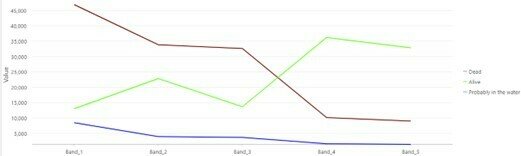
Spectral signature
Bands and spectral signatures


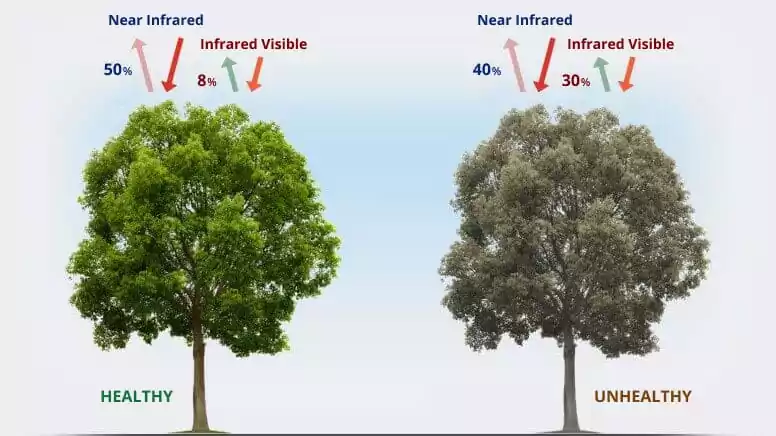
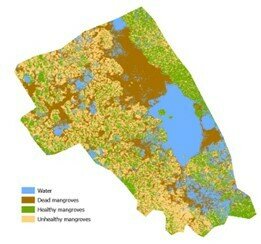
Healthy vegetation


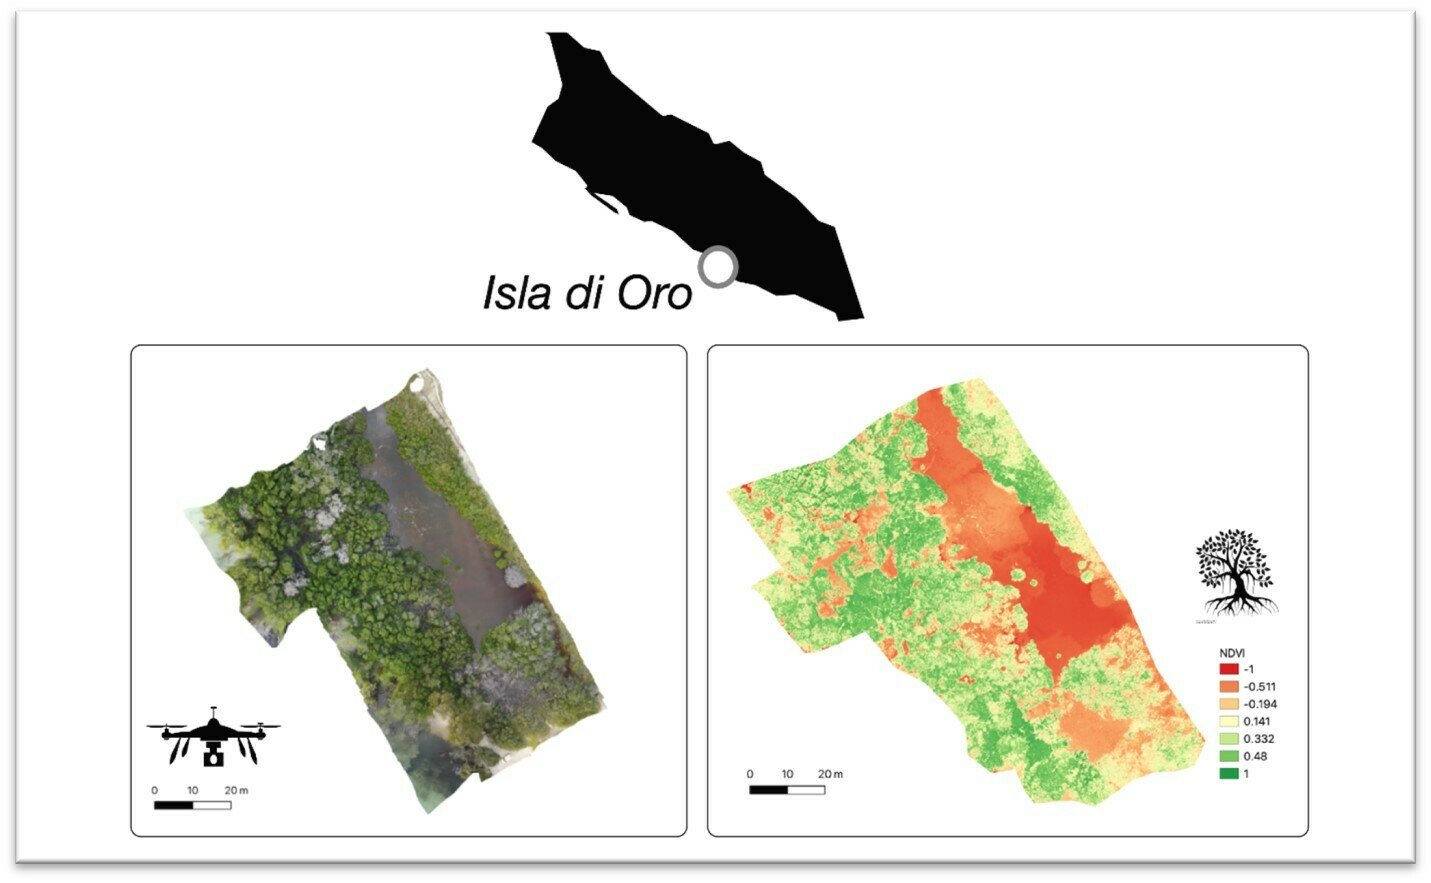
Normalized Difference Vegetation Index
NDVI=NIR-IR/NIR+IR
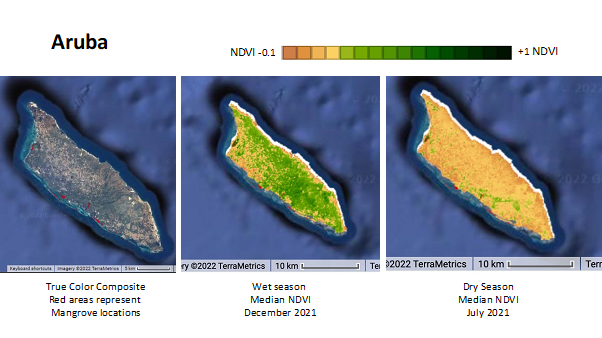
Healthy vegetation
Normalized Difference Vegetation Index
NDVI=NIR-IR/NIR+IR
Healthy vegetation
Normalized Difference Vegetation Index
NDVI=NIR-IR/NIR+IR
Other indices
- Leave Area Index (LAI)
- Net Primary Production (NPP)
- Vegetation Fraction (VF)
- Chlorophyll Index Green
- Chlorophyll Index Rededge
- this list goes on...
Animation
Animation
Slider
Sentinel-1 images track the major flooding in Kerala during the 2018 monsoon season
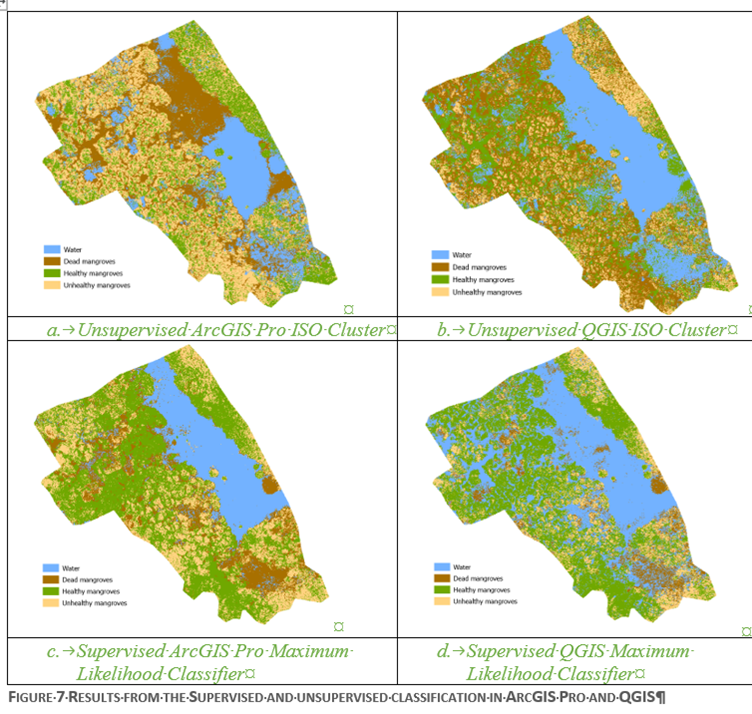
Supervised & Unsupervised
Classification

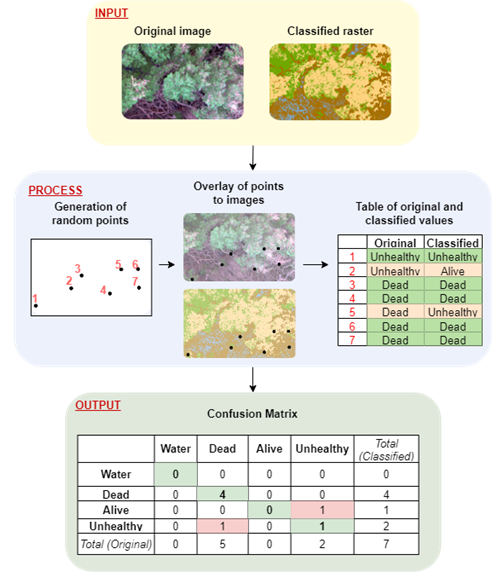
Digital image classification
Assigning pixels to classes
tip: Classes should be homogenous (the same)
Digital image classification
Digital image classification
Unsupervised vs supervised classification
Supervised Classification
Human guide the classification by identifying areas on the image that are known to belong to each category
Process of using samples of known identify
(pixels assigned to classes) to classify
pixels of an unknown identity
benefits
- Analyst has control over selecting categories to specific purpose
- specific areas of known identify - local knowledge
- errors can be detected early (hopefully)
- no need to match spectral categories on the final map
drawbacks
- imposed classification structure
- training areas often vague - secondarily to spectral properties
- training areas may not be representative of conditions on the ground
- training data is time consuming
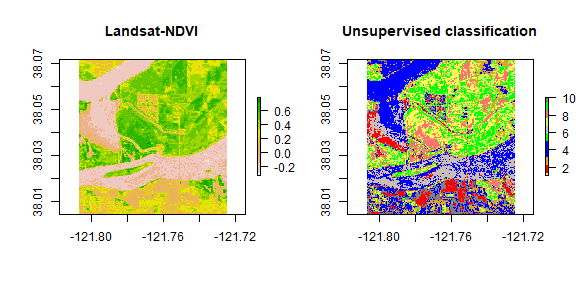
Unsupervised Classification
Identify natural groups or structures based on the multispectral data alone
Minimal human input

Unsupervised Classification
benefits
- no prior knowledge of region required
- reduce likelihood of human error biased
- unique classes as distinct units
drawbacks
- spectrally homogeneous classes may not correspond to informational categories of interest
- analysis has limited control over menu of classes
- spectral properties of specific classes may change over time (seasons)
Big Data and
CyberGIS
Cloud Computing


-
valuable for information dissemination
-
faster and more data processing that was not previously possible
-
data access
- data storage
Google Earth Engine
-
Cloud-based platform for geospatial analysis
-
Access over 40 years of satellite imagery
-
Upload own data sets to integrate with publicly available data
-
Export images, tables, charts, map outputs
- All in your internet browser!

Integrated Development Environment (IDE) Code Editor features are designed to make developing complex geospatial workflows fast and easy. The Code Editor has the following elements:
- JavaScript code editor
- Map display for visualizing geospatial datasets
- API reference documentation (Docs tab)
- Git-based Script Manager (Scripts tab)
- Console output (Console tab)
- Task Manager (Tasks tab) to handle long-running queries
- Interactive map query (Inspector tab)
- Search of the data archive or saved scripts
- Geometry drawing tools

Title Text
// Load Sentinel-2 TOA reflectance data.
var dataset = ee.ImageCollection('COPERNICUS/S2')
                  .filterDate('2018-01-01', '2018-12-30')
                  // Pre-filter to get less cloudy granules.
                  .filter(ee.Filter.lt('CLOUDY_PIXEL_PERCENTAGE', 20))


//true color
var rgbVis = {
  min: 0.0,
  max: 2500,
  bands: ['B4', 'B3', 'B2'],
};
//urban visualization
var urbanVis = {
  min: 0.0,
  max: 2500,
  bands: ['B12', 'B11', 'B4'],
};

//Agriculture visualization
var agVis = {
  min: 0.0,
  max: 2500,
  bands: ['B11', 'B8', 'B2'],
};
//Healthy vegitation visualization
var VegVis = {
  min: 0.0,
  max: 2500,
  bands: ['B8', 'B11', 'B2'],
};

//Land Water visualization
var WaterVis = {
  min: 0.0,
  max: 2500,
  bands: ['B8', 'B11', 'B4'],
};

//Utrecht
Map.setCenter(5.104480, 52.092876, 11);

//different layers
Map.addLayer(dataset.median(), rgbVis, 'RGB');
Map.addLayer(dataset.median(), urbanVis, 'Urban');
Map.addLayer(dataset.median(), agVis, 'Agriculture');
Map.addLayer(dataset.median(), VegVis, 'Vegitation');
Map.addLayer(dataset.median(), WaterVis, 'Water');

//END
Summary
Benefits of CyberGIS
- Data access
- Distributed data processing
- Information dissemination through interactive visualizations
Remote Sensing to Monitor the SDGs
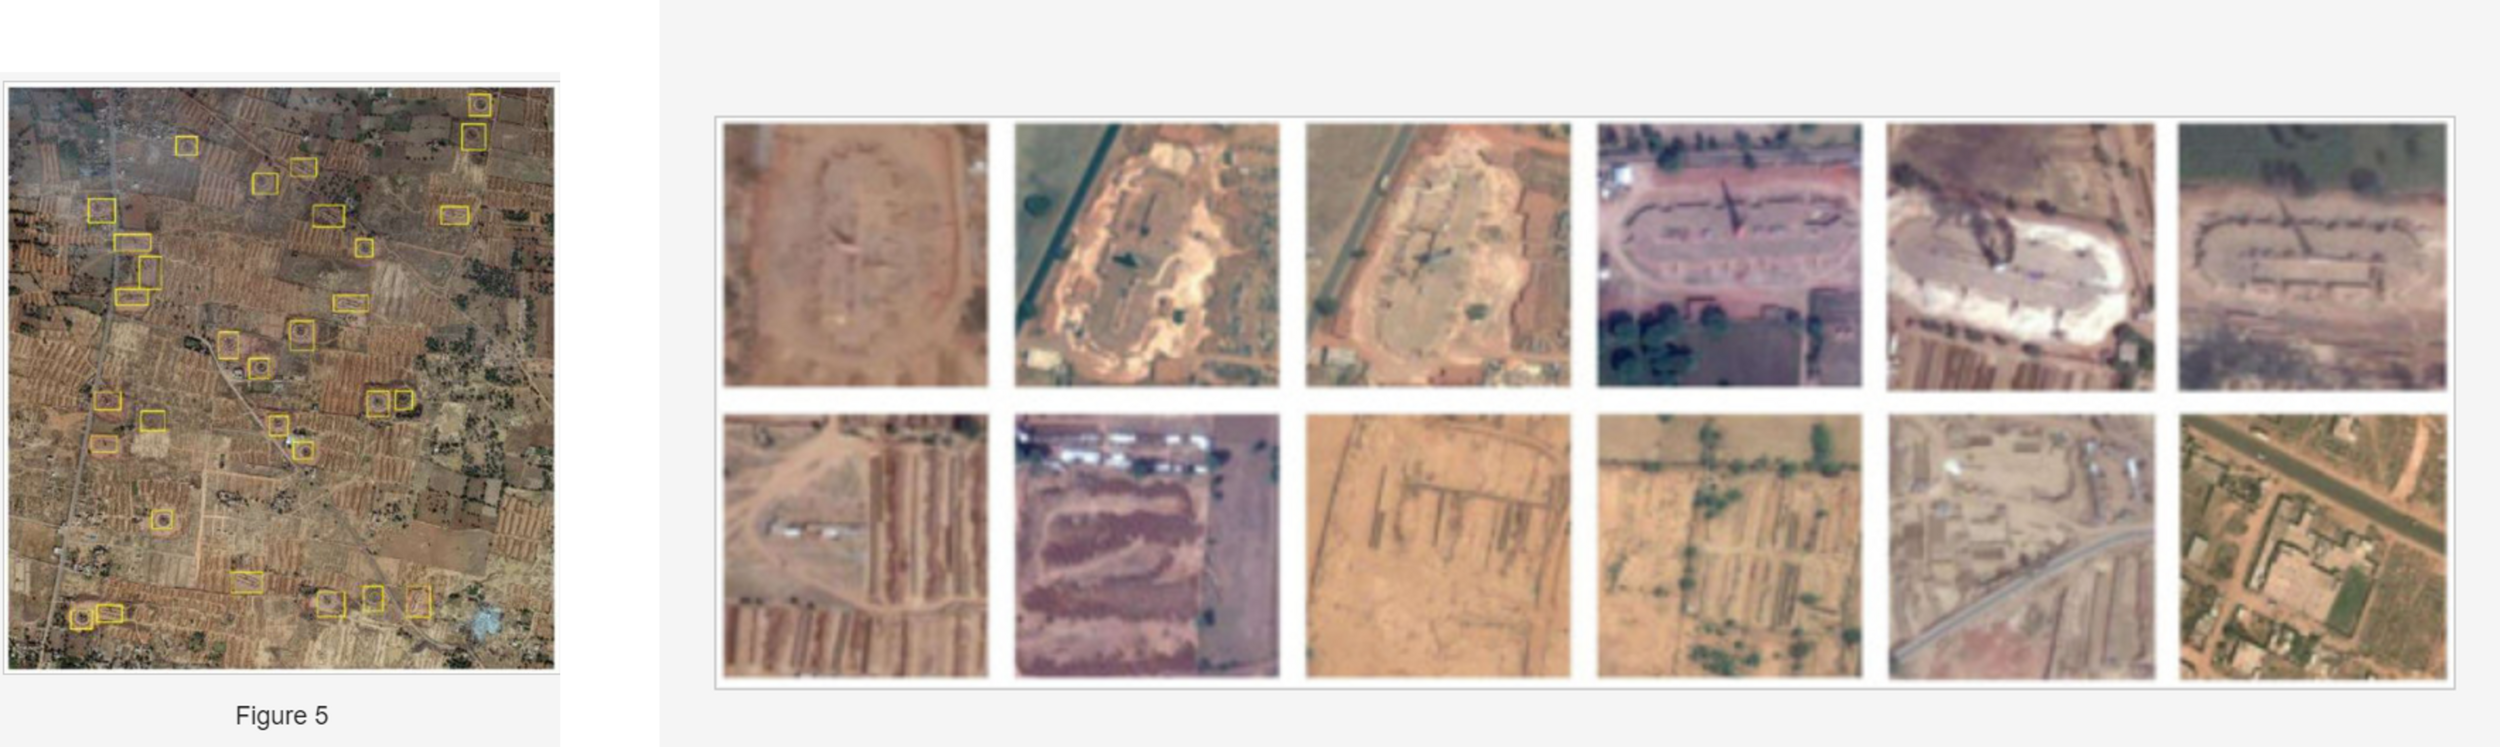
Earth Observation and Machine Learning to Meet Sustainable Development Goal 8.7: Mapping Sites Associated with Slavery from Space. Foody GM, Ling F, Boyd DS, et al. 2019 Remote Sensing . DOI: 10.3390/rs11030266.
Subtitle
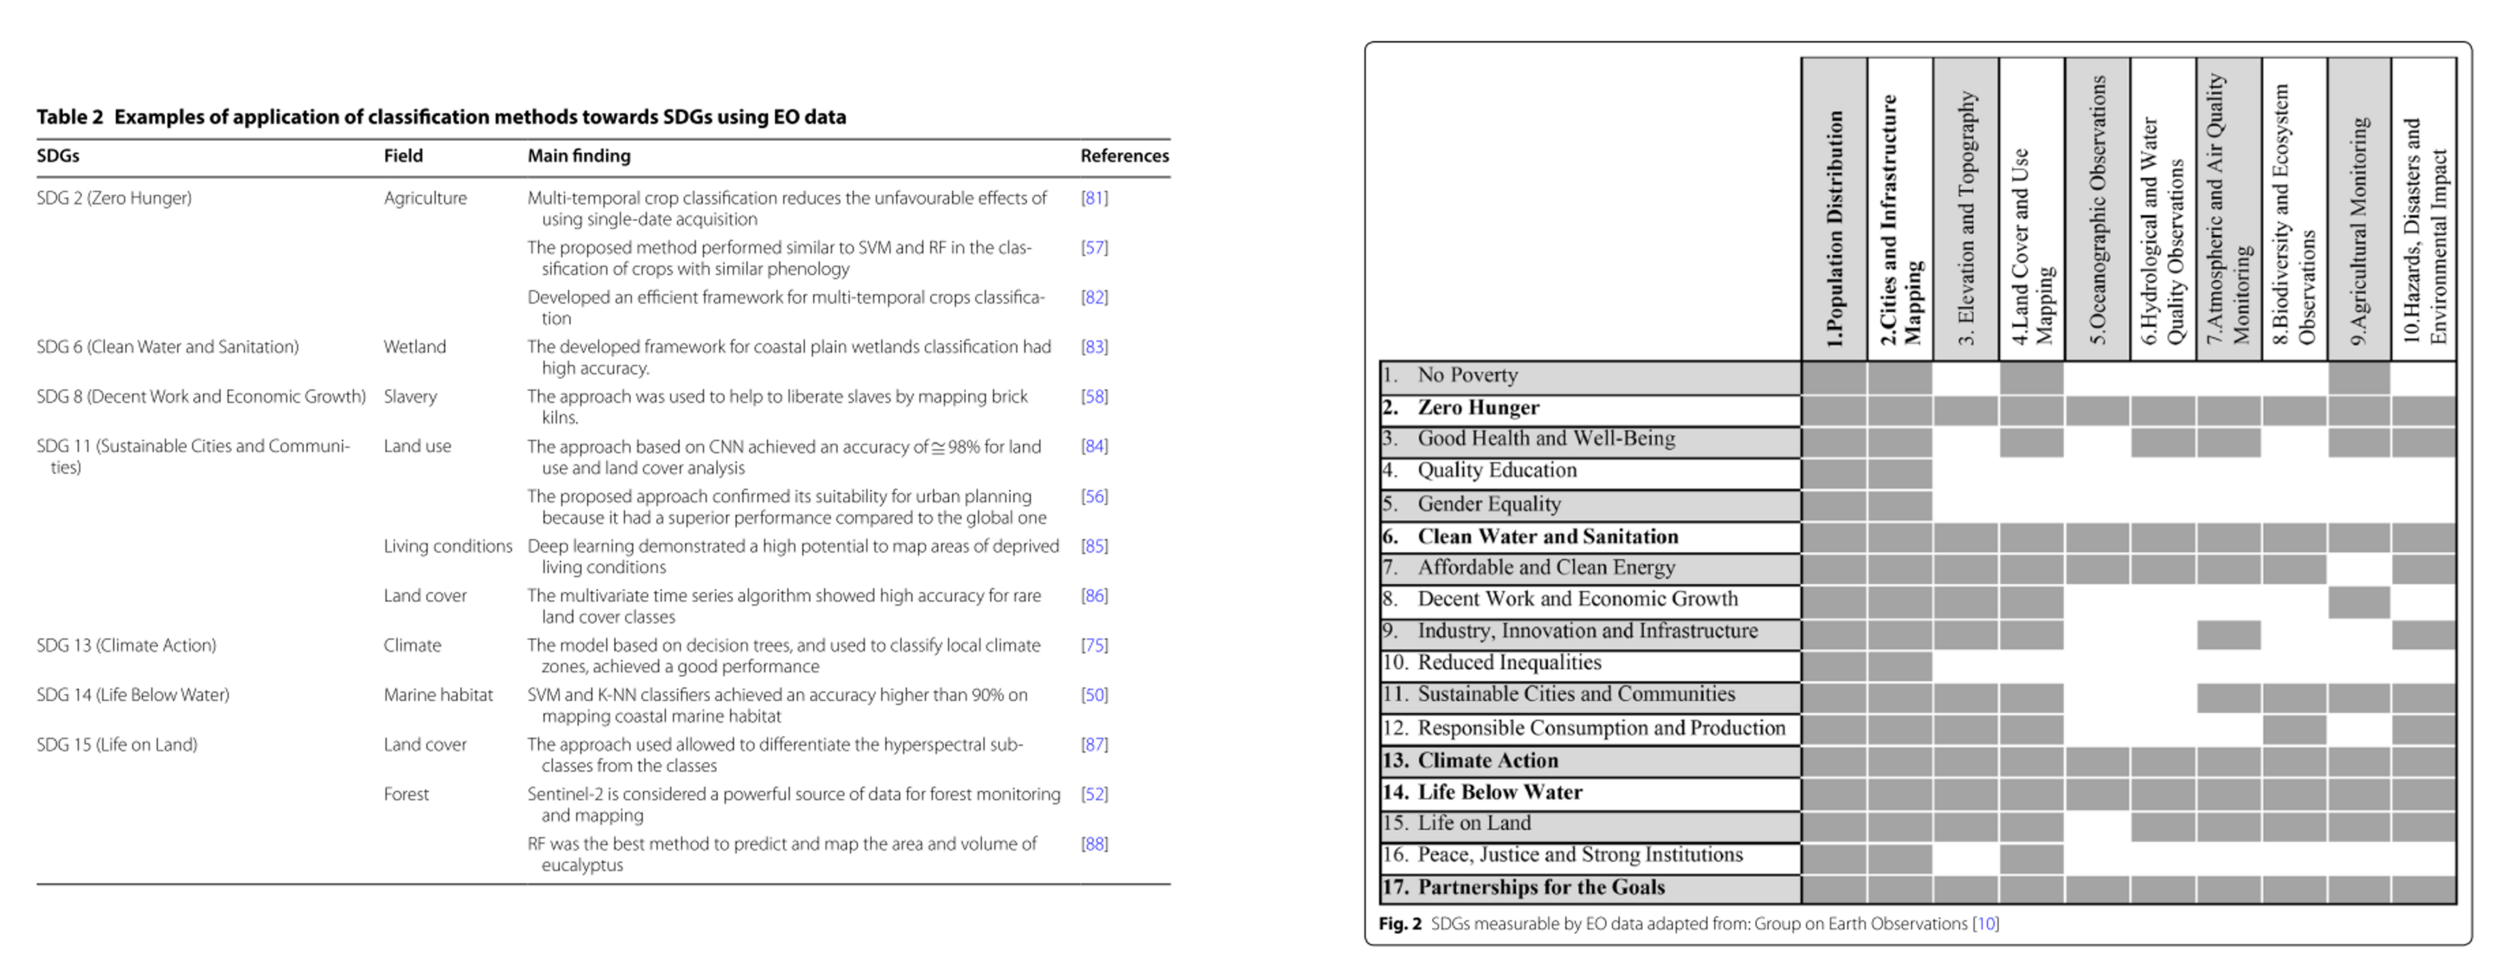
Ferreira, B., Iten, M., & Silva, R. G. (2020). Monitoring sustainable development by means of earth observation data and machine learning: a review. Environmental Sciences Europe, 32(1). https://doi.org/10.1186/s12302-020-00397-4
Examples from the web
Hansen et al (2013)
High-Resolution Global Maps of 21st-Century Forest Cover Change, Science
15 Nov. Vol. 342, Issue 6160, pp. 850-853 DOI: 10.1126/science.1244693.
Review!
In your own words...
What is the difference between an active and passive sensor?
What is a spectral signature?
What is a false-color composite?
How are they useful for land use change monitoring?
Spatial and
temporal resolution
What do these terms mean and how are they different?

Name two strengths of CyberGIS and cloud computing?
What is the difference between supervised and unsupervised classification?
Name two different Visualization techniques to show change over time.
Thank you!

RS_UCU
By Britta Ricker


