Google Earth Engine
An Introduction
for Land Use Change Science
Outline
- What is Google Earth Engine?
- User Interface
- define polygon or bounding box on your country
- Browse and add Data
- Modis
- Sentinel
- processed datasets
- Looking up data parameters
- Color scheme and legend
- Export data
What is Google Earth Engine?
- Computing platform and runs in your internet browser
- with a code editor,
- offers a compiler that runs in the Google cloud,
- hosts data on Google servers.
- Integrated Development Environment (IDE)
- Read more here
want more tutorials? https://tutorials.geemap.org/Image/image_visualization/
advanced https://courses.spatialthoughts.com/end-to-end-gee.html
Google Earth Engine is a
Data Repository (data as a service)
Software as a Service (SaaS)
Platform as a service (PaaS)
Examples of output in apps
Basic of JavaScript
for GEE
Feel free to dig deeper on your own here
https://developers.google.com/earth-engine/tutorials/tutorials
Quick tip
copy code and keep notes in a text editor,
save as js files
keep what works
I like to use https://www.sublimetext.com/3
Any text editor will due!
Tutorial
Let's get started
first open Google Earth Engine
I hope you signed up for an account already!
https://code.earthengine.google.com/
User Interface
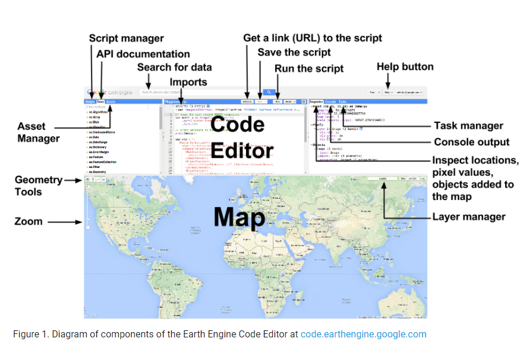
Quick tip: Find lat long
Click anywhere in the map pane and then
look in the "Inspector" window
Two ways to add data
Import the data (search within GEE)
Add it manually (cut and paste)
Search and the
Add data
there are many ways to do this...
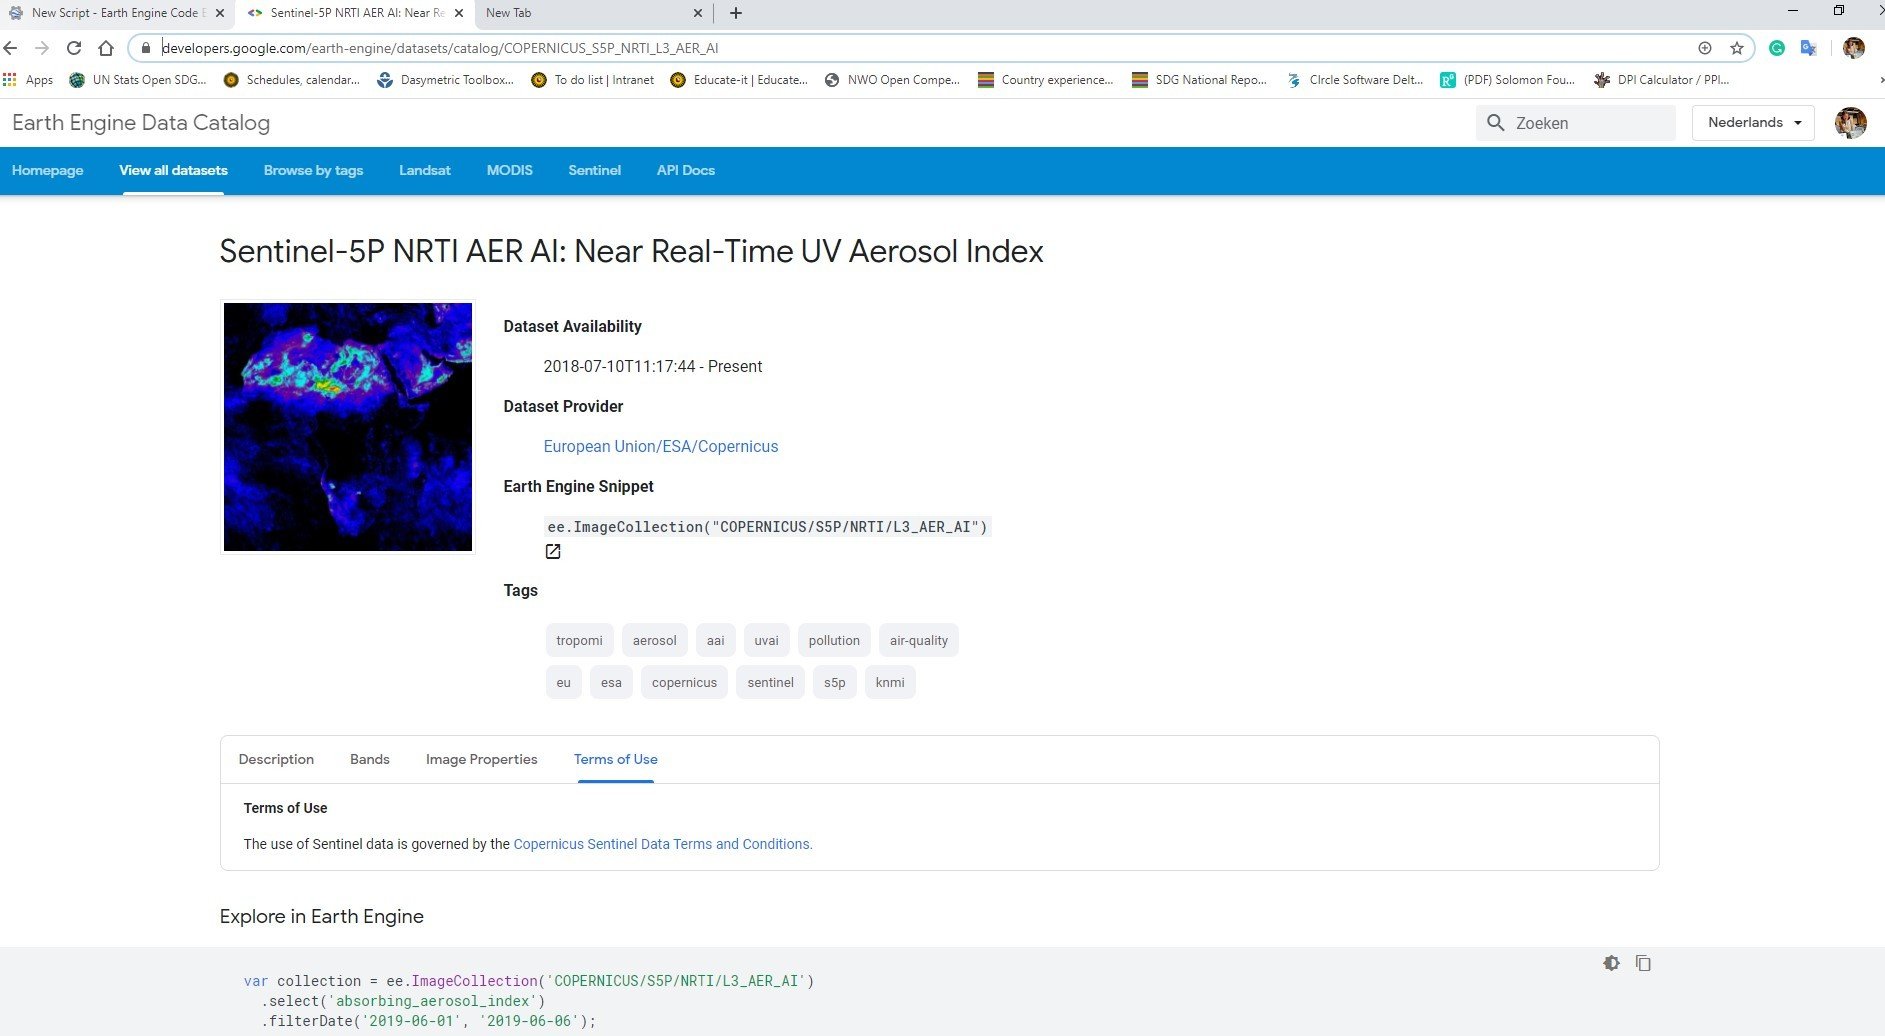
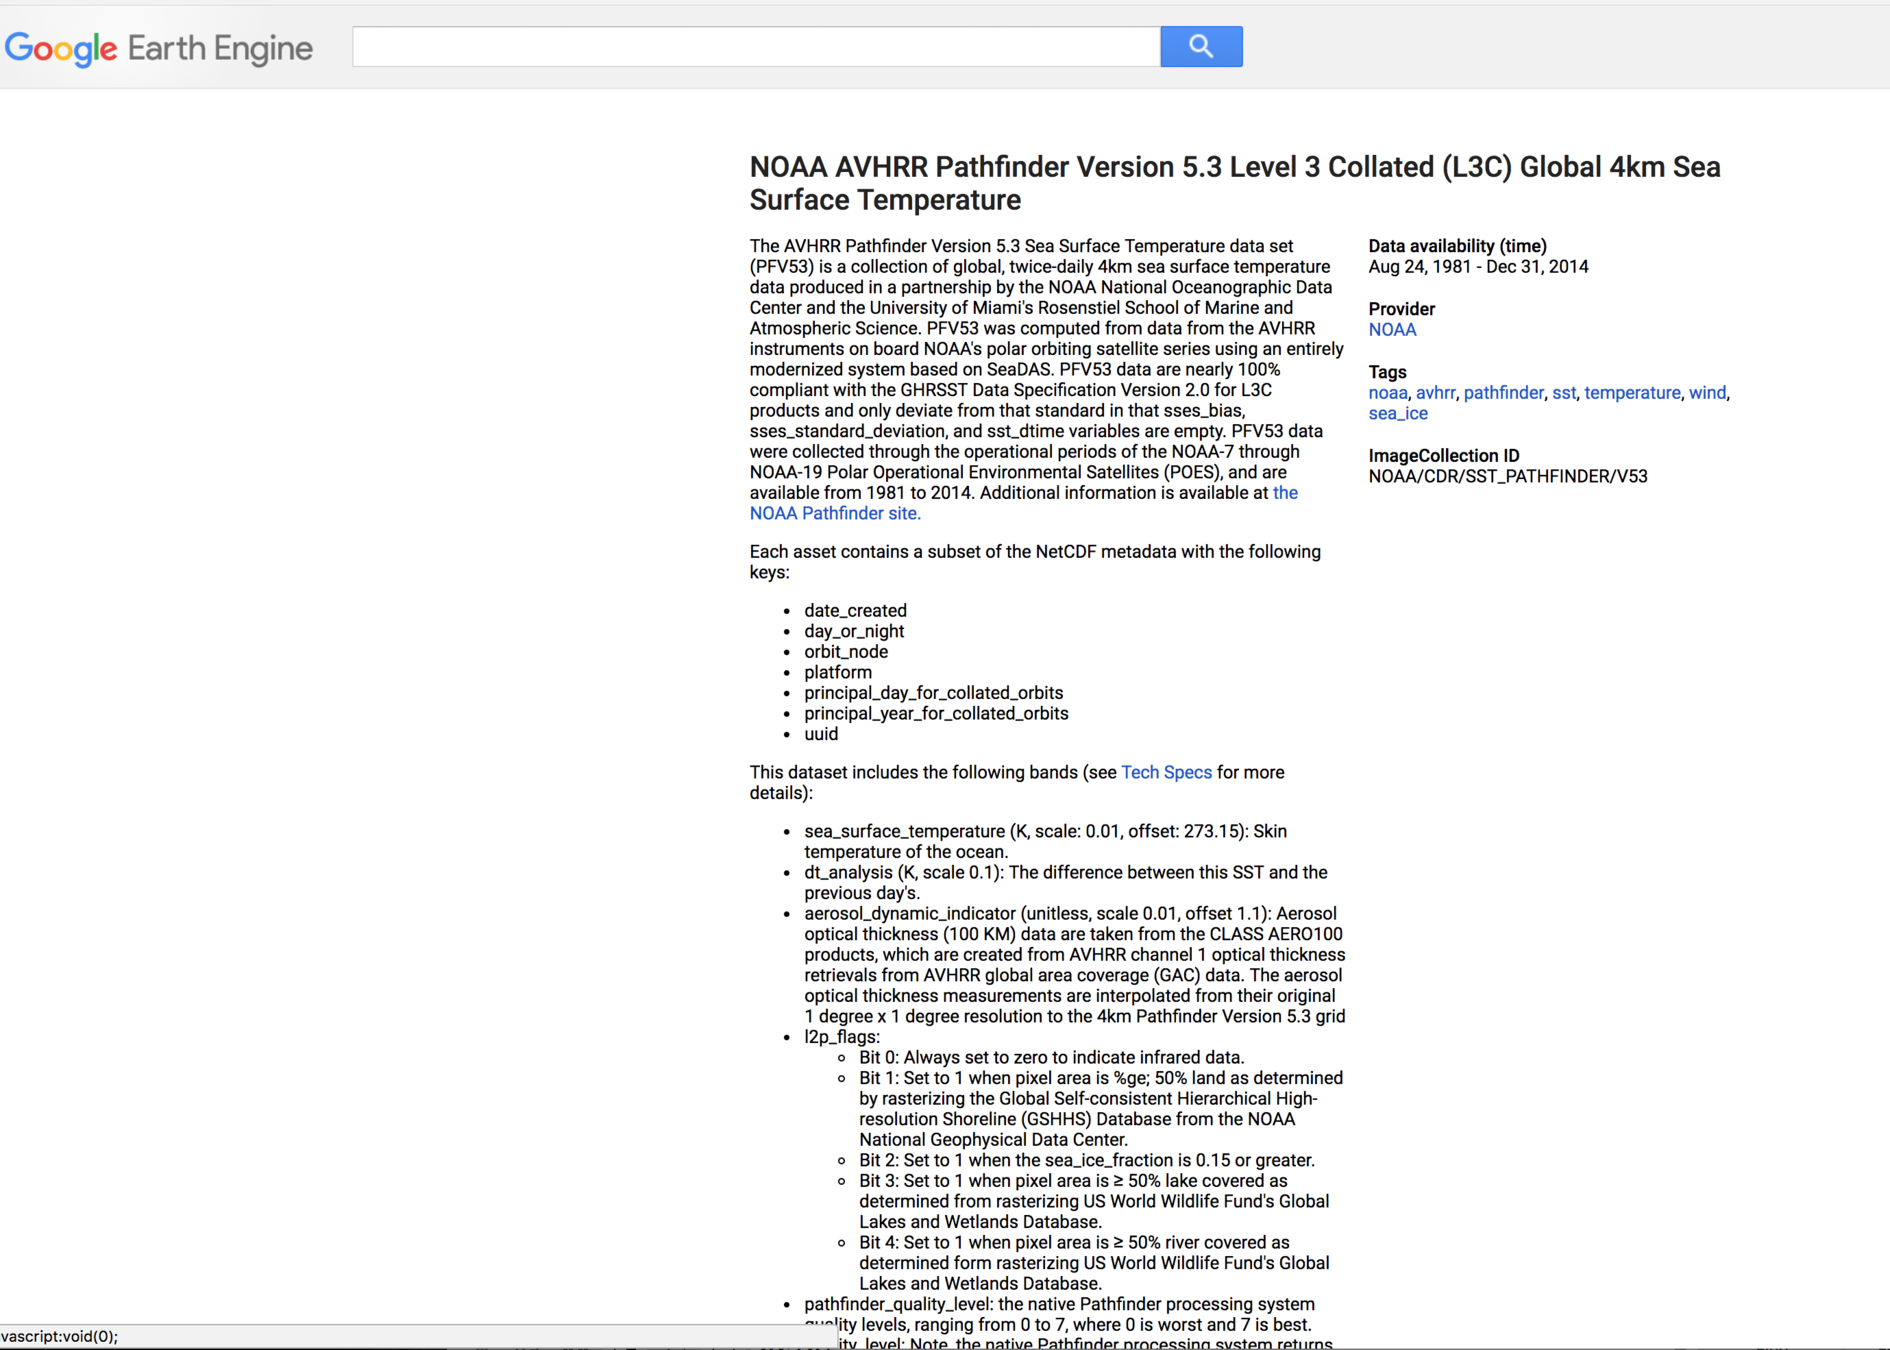
- Search for data
- Let's look at the data available
- https://developers.google.com/earth-engine/datasets/catalog/
Text
Text
Text
Search Land Use datasets in the Google Earth Engine Data Catelog
Generate a bounding box
Find lat long coordinates for your country.
I will show you how to:
Zoom to your country.
Place a box around it using the "geometry tools".
Change the color to transparent
it will create a new variable called "geometry"
alternatively - Use this tool geojson.io
Center the map on your country
change to:
Map.centerObject(geometry);
Then click Run
What do you think this script does?
var image = ee.Image('CGIAR/SRTM90_V4');
Map.setCenter(-112.8598, 36.2841, 9);
Map.addLayer(image);
Do the comments match what you thought?
// define the variable to instantiate an image with the Image constructor - calling a Digital Elevation Model
var image = ee.Image('CGIAR/SRTM90_V4');
// Center on the Grand Canyon and zoom there.
Map.setCenter(-112.8598, 36.2841, 9);
// Display the image on the map.
Map.addLayer(image);
cut and paste this into
Google Earth Engine and run it!
Now let's clip the region to your country
// define the variable to instantiate an image with the Image constructor - calling a Digital Elevation Model
var image = ee.Image('CGIAR/SRTM90_V4');

// Load a country border as a region of interest (roi) and then select your country
var countries = ee.FeatureCollection('USDOS/LSIB_SIMPLE/2017');
var roi = countries.filterMetadata('country_na', 'equals', 'Aruba');

//center map on that country
Map.centerObject(roi);
//render it to the map
Map.addLayer(image);
Now let's add some visualizations based on elevation and slope
// define the variable to instantiate an image with the Image constructor - calling a Digital Elevation Model
var image = ee.Image('CGIAR/SRTM90_V4');

// Calculate slope.
var slope = ee.Terrain.slope(image);
var elevation = image.select('elevation');

// Load a country border as a region of interest (roi).
var countries = ee.FeatureCollection('USDOS/LSIB_SIMPLE/2017');
var roi = countries.filterMetadata('country_na', 'equals', 'Aruba');

// Clip the image to the region of interest.
slope = slope.clip(roi);
var DEM = elevation.clip(roi)

// Displaying slope and elevation for the region of interest and naming the layers
var visualization_slope = {min: 0, max: 45, palette:'yellow,red'};
Map.centerObject(roi);
Map.addLayer(slope, visualization_slope, "slope");

//display elevation - stretch based on the highest and lowest value in the country
var visualization_DEM = {min: 0, max: 190, palette:'yellow,red'};
Map.addLayer(DEM, visualization_DEM, "DEM");
Add a legend
// define// define the variable to instantiate an image with the Image constructor - calling a Digital Elevation Model
var image = ee.Image('CGIAR/SRTM90_V4');

// Calculate slope.
var slope = ee.Terrain.slope(image);
var elevation = image.select('elevation');

// Load a country border as a region of interest (roi).
var countries = ee.FeatureCollection('USDOS/LSIB_SIMPLE/2017');
var roi = countries.filterMetadata('country_na', 'equals', 'Aruba');

// Clip the image to the region of interest.
slope = slope.clip(roi);
var DEM = elevation.clip(roi)

// Displaying slope and elevation for the region of interest and naming the layers
var visualization_slope = {min: 0, max: 40, palette:'yellow,red'};
Map.centerObject(roi);
Map.addLayer(slope, visualization_slope, "slope");

var visualization_DEM = {min: 0, max: 190, palette:'yellow,red'};
Map.addLayer(DEM, visualization_DEM, "DEM");

//you will need to update this value based on the highest elevation in your country
var palette = ["yellow", "red"]
var vis = {min: 0, max: 190, palette: palette};

var nSteps = 10
// Creates a color bar thumbnail image for use in legend from the given color palette
function makeColorBarParams(palette) {
  return {
    bbox: [0, 0, nSteps, 0.1],
    dimensions: '100x10',
    format: 'png',
    min: 0,
    max: nSteps,
    palette: palette,
  };
}

var nSteps = 10
// Create the colour bar for the legend
var colorBar = ui.Thumbnail({
  image: ee.Image.pixelLonLat().select(0).int(),
  params: makeColorBarParams(vis.palette),
  style: {stretch: 'horizontal', margin: '0px 8px', maxHeight: '24px'},
});

// Create a panel with three numbers for the legend
var legendLabels = ui.Panel({
  widgets: [
    ui.Label(vis.min, {margin: '4px 8px'}),
    ui.Label(
        ((vis.max-vis.min) / 2+vis.min),
        {margin: '4px 8px', textAlign: 'center', stretch: 'horizontal'}),
    ui.Label(vis.max, {margin: '4px 8px'})
  ],
  layout: ui.Panel.Layout.flow('horizontal')
});

// Legend title
var legendTitle = ui.Label({
  value: 'Elevation (meters)',
  style: {fontWeight: 'bold'}
});

// Add the legendPanel to the map
var legendPanel = ui.Panel([legendTitle, colorBar, legendLabels]);
Map.add(legendPanel);
Let's change the visualization parameters to make it pop
two ways to do this...
click on the layer itself,
or programmatically
Want to export the Digital Elevation Model to incorporate in ArcGIS?
/ Export the image
Export.image.toDrive({
  image: slope,
  region: roi,
  description: 'Slope',
  scale: 30,

});


Export.image.toDrive({
image: DEM,
region: roi,
description: 'DEM',
scale: 30,

});
style will not export
unless you convert the file
We are not going to worry about this right now...
Let's add Sentinel 2 data
Modify this example code to
1. center on your country
2. Then also render a false color composite layer
3. Change the date of images
Aruba Example of a true color composite
// What does each line of code do?
var S2_collection = ee.ImageCollection("COPERNICUS/S2")
  .filterBounds(geometry)
  .filterDate('2020-01-01', '2020-12-31')
  .filterMetadata('CLOUDY_PIXEL_PERCENTAGE', 'less_than', 10);

var S2_display = {bands: ['B4', 'B3', 'B2'], min: 0, max: 3000};

print(S2_collection);

var S2_mosaic = S2_collection.median().clip(geometry);

Map.addLayer(S2_mosaic, S2_display, "Sentinel-2");
NDVI example with Modis Data
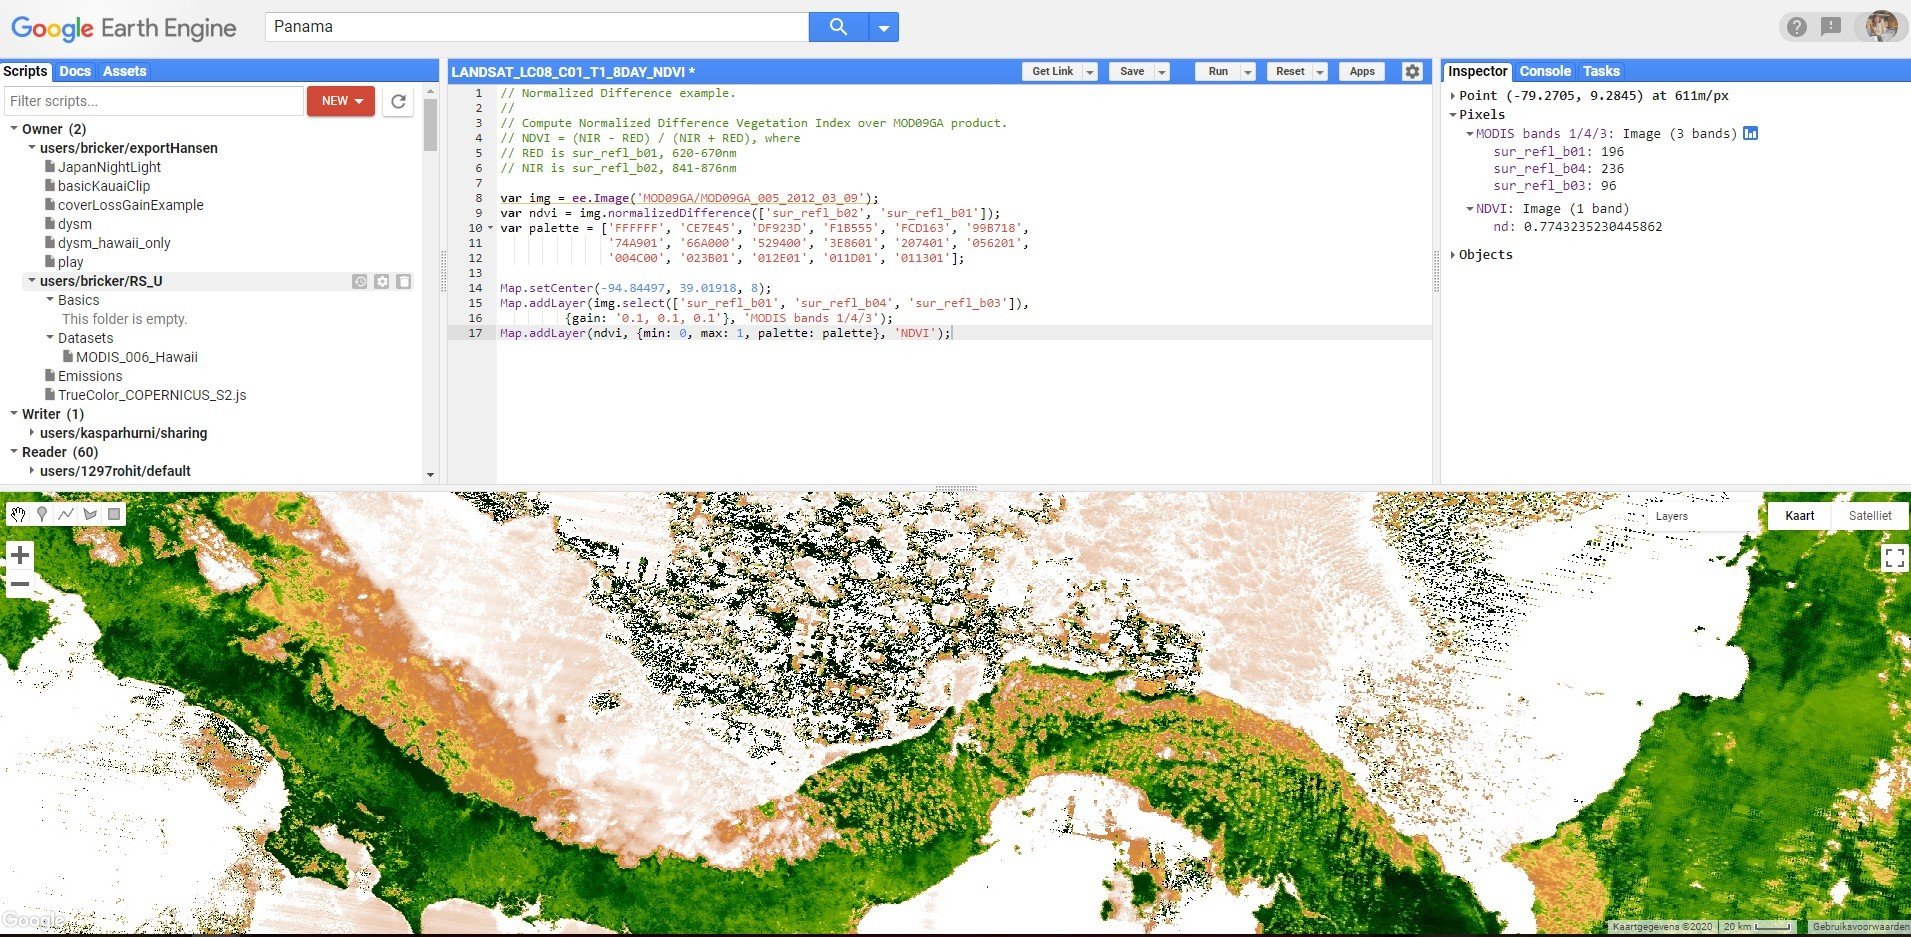
// Normalized Difference example.
//
// Compute Normalized Difference Vegetation Index over MOD09GA product.
// NDVI = (NIR - RED) / (NIR + RED), where
// RED is sur_refl_b01, 620-670nm
// NIR is sur_refl_b02, 841-876nm

var img = ee.Image('MOD09GA/MOD09GA_005_2012_03_09');
var ndvi = img.normalizedDifference(['sur_refl_b02', 'sur_refl_b01']);
var palette = ['FFFFFF', 'CE7E45', 'DF923D', 'F1B555', 'FCD163', '99B718',
               '74A901', '66A000', '529400', '3E8601', '207401', '056201',
               '004C00', '023B01', '012E01', '011D01', '011301'];

Map.setCenter(-94.84497, 39.01918, 8);
Map.addLayer(img.select(['sur_refl_b01', 'sur_refl_b04', 'sur_refl_b03']),
         {gain: '0.1, 0.1, 0.1'}, 'MODIS bands 1/4/3');
Map.addLayer(ndvi, {min: 0, max: 1, palette: palette}, 'NDVI');
Call data from a different dataset
then more change parameters
https://developers.google.com/earth-engine/datasets/catalog
notice how many datasets focus on the Netherlands!
Run through and example:
I need the following
- Pick dataset
- Find and area
- date range and filter clouds
- Clip area
- NDVI
- export
Center on Aruba
Make True color composite
//calling landsat 8 images - only looking for imagery that covers a single point. Searching for images between these dates
var aruba = ee.ImageCollection('LANDSAT/LC08/C01/T1')
                 .filterBounds(ee.Geometry.Point(-69.9735, 12.5037))
                  .filterDate('2014-01-01', '2019-12-31');

  // Sort by a cloud cover property, get the least cloudy image. The print statements means I can use the console and inspector window to read metadata
var image = ee.Image(aruba.sort('CLOUD_COVER').first());
print('Least cloudy image: ', image);

//only show me the following bands represetned as a true color composite in the map display

var trueColor432 = image.select(['B4', 'B3', 'B2']);
var trueColor432Vis = {
  min: 0.0,
  max: 30000.0,
};

//Centered on Aruba
Map.setCenter(-69.9735, 12.5037, 10);

//add map layer
Map.addLayer(trueColor432, trueColor432Vis, 'True Color (432)');
What do you see in the map?
Why do you think this happened?
What needs to be fixed?LANDSAT/LC08/C01/T1/LC08_069075_20190705
make false color composite
what is possible?
examples
https://gisgeography.com/landsat-8-bands-combinations/
This band combination is also called the near infrared (NIR) composite. It uses near-infrared (5), red (4) and green (3). Because chlorophyll reflects near infrared light, this band composition is useful for analyzing vegetation. In particular, areas in red have better vegetation health. Dark areas are water and urban areas are white.
//calling landsat 8 images - only looking for imagery that covers a single point. Searching for images between these dates
var tonga = ee.ImageCollection('LANDSAT/LC08/C01/T1')
                 .filterBounds(ee.Geometry.Point(-175.2312, -21.1612))
                  .filterDate('2014-01-01', '2019-12-31');

  // Sort by a cloud cover property, get the least cloudy image.
var image = ee.Image(tonga.sort('CLOUD_COVER').first());
print('Least cloudy image: ', image);

//only show me the following bands to highlight vegitation NIR composite in the map display - notice I change the variable names

var NIR = image.select(['B5', 'B4', 'B3']);
var NIRColor543Vis = {
  min: 0.0,
  max: 30000.0,
};

//Centered on Tonga and show me in the map changed variable names
Map.setCenter(-175.2312, -21.1612, 6);
Map.addLayer(NIR, NIRColor543Vis, 'veg (543)');
Calculate NDVI for this specific image
Export your data
lots of options!
https://developers.google.com/earth-engine/exportingYou may want to export data to use in ArcGIS/QGIS
Make a map for your wall
share on social media...
Export your data
lots of options!
Fill in this quiz related to the cartography lecture and
Share ideas and an example of your work
Google Earth Engine and Land Use Change
By Britta Ricker
Google Earth Engine and Land Use Change
Introduction to GEE for Land Use Science course at UU


