Visualizing Taxonomic Reports from Biological Sequence Alignments


Thesis by
Meili Vanegas-Hernandez
In Partial Fulfillment of the Requirements for the Degree of
M.S. Systems and Computing Engineering
Advisors
John Guerra-Gomez
José Tiberio Hernández
Universidad de los Andes
Universidad de los Andes, UC.Berkeley
Main Contributions
1
taxonomy of analysis tasks regarding the state of the art
BioCicle: visual analytics tool
web-based and open source
connected to NCBI/EBI and UniProt API's
(AT2 a,b) summarize and compares single or multiple taxonomic reports from sequence alignments
designed and tested with a real end user
Why BioCicle?
2
sequence extraction is a common practice in bioinformatics
BLAST, HMM
algorithms for comparing primary biological sequence information
how can we characterize them?
i.e. metagenomics:
studies genetic material from environmental samples


Biological Sequence Comparisons
3
misclassifications
erroneous data stored in database
widespread
future comparisons consider innacurate information


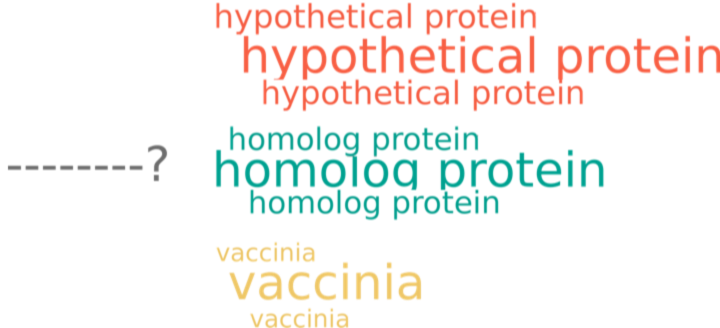
Biological Sequence Comparisons RESULTS
4

VS.
output
________?
homolog protein
RS1
RS2
RS3
Regions of similarity
Taxonomic profile
Sequence description
5
VS.
RS1
RS2
RS3
Regions of similarity
Taxonomic profiles
Sequences description
output

6
Analysis Tasks Identification
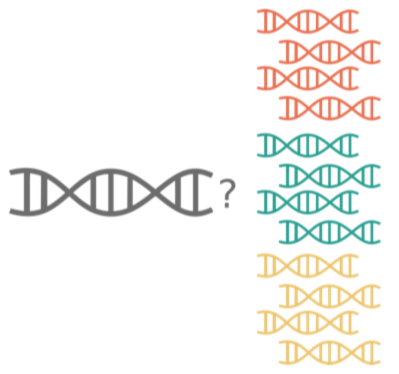
Classify an
unknown
Identify
relationships
between
multiple
SEQUENCES
SEQUENCE
ATb
ATa
VS.
VS.
Related Work
7
RS1
RS2
RS3
Regions of similarity
Taxonomic profile
Sequence description
BOV, Blast2Go, Artemis, HMM Editor
CLANS, GenoPlotR
Circoleto, Clustal W, Hmmer, GeneCluster VIZ, Megan, Blast Grabber
MG Rast
Amphora Vizu, MetaPHlAn, KRONA
MEGAN, METAREP, Blast Grabber
NCBI
AT1b
AT1a
AT2b
AT2a
AT3b
AT3a
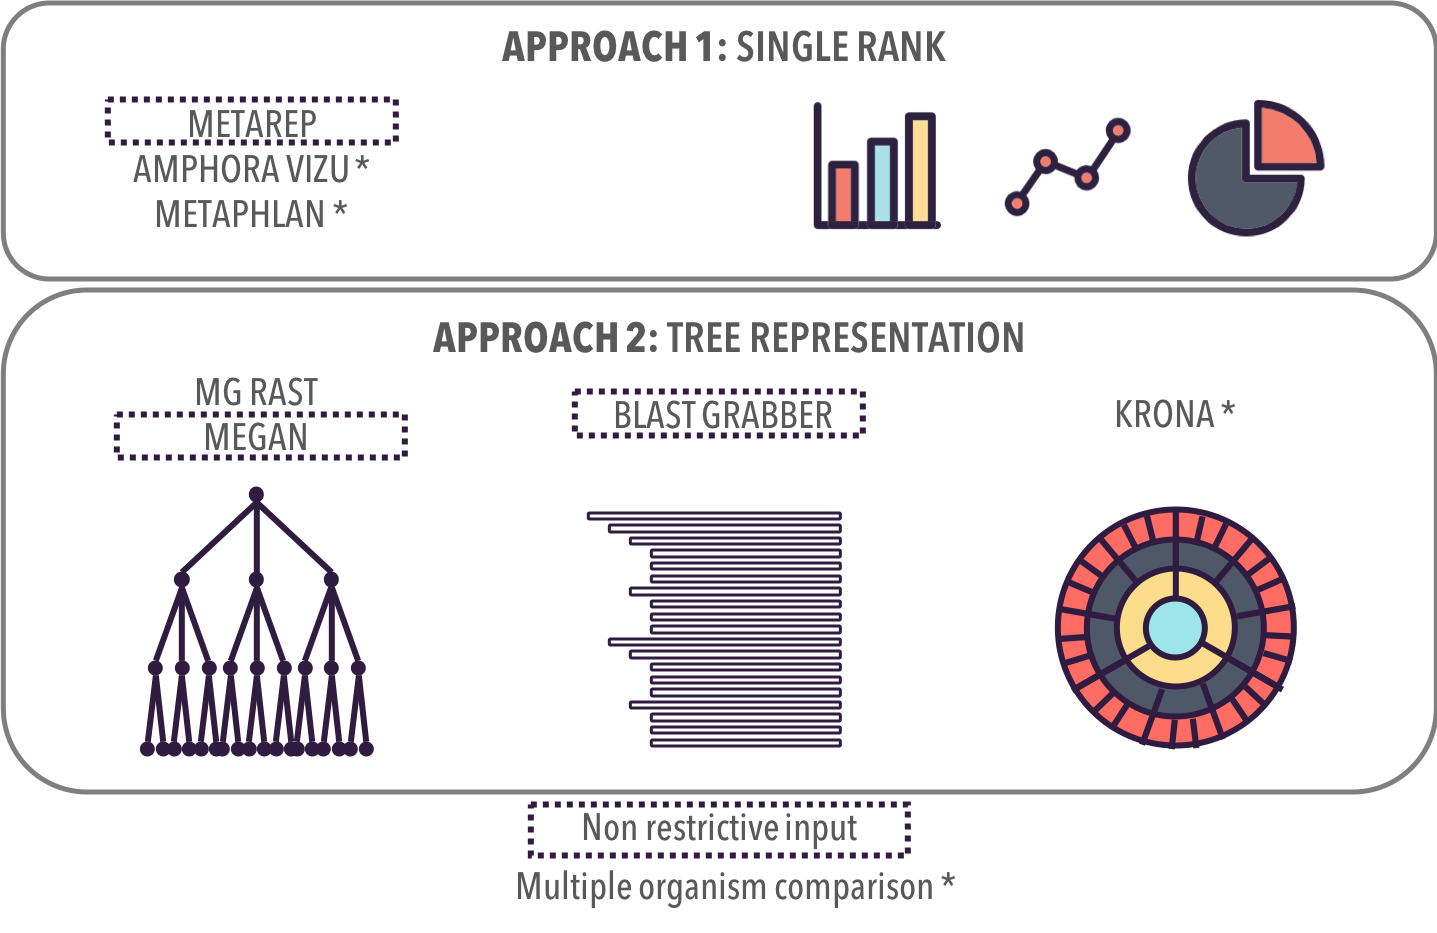
Non-restrictive input: independant from the algorithm used for the comparison
8
* Non-restrictive input: independant from the algorithm used for the comparison
METAREP **
Amphora Vizu *
MetaPHlAn *
UNIQUE RANK: TRADITIONAL GRAPHS
ALL RANKS:
TREE REPRESENTATIONS
** Multiple Comparison: Supports analysis task AT2b
MG Rast
MEGAN **
Blast Grabber **
KRONA *


Related Work
Taxonomic Profiles
9
* Non-restrictive input: independant from the algorithm used for the comparison
METAREP **
Amphora Vizu *
MetaPHlAn *
UNIQUE RANK: TRADITIONAL GRAPHS
ALL RANKS:
TREE REPRESENTATIONS
** Multiple Comparison: Supports analysis task AT2b
MG Rast
MEGAN **
Blast Grabber **
KRONA *
No overview first
Detailed information
No score representation
Hard to read nodes
Overview
No score representation
Overview
Readable nodes
Related Work
Taxonomic Profiles
No overview
Hard to read leaves
Overview
Score representation
Efficient space filling
BioCicle
10
Web-based & Open source
application
1
Visualizes
2
Visualizes
taxonomic profiles
3
multiple
taxonomic profiles
single
Input formats
API's: accession id, FASTA
Pregenerated comparisons
4
11
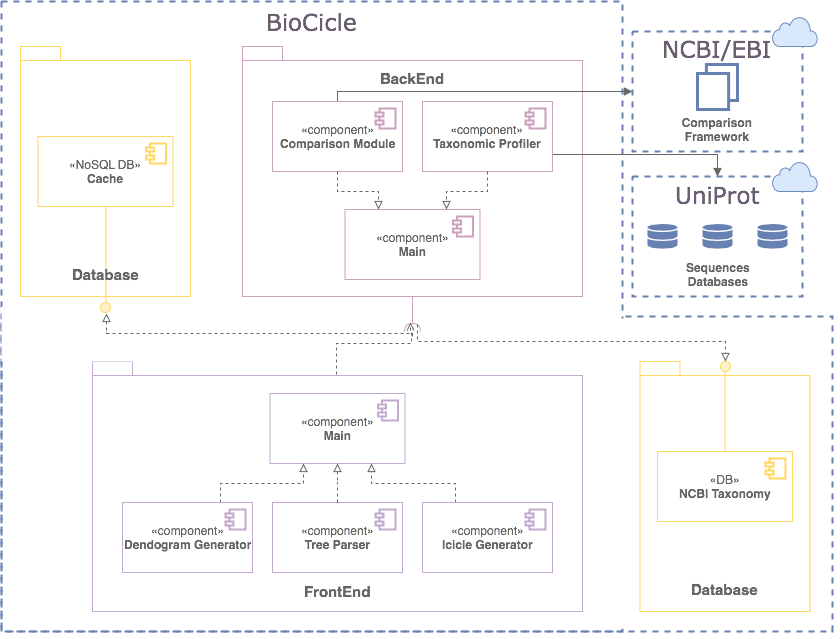
IMPLEMENTATION
12
VISUAL DESIGN
taxonomic profiles for a single taxonomic profile
assigned to

score value
(numeric)
{
max score for sequences assigned to that specie
ranks
(categorical)
score value
(numeric)
ranks
(categorical)
position on common or unaligned scale
spatial region
length
phylum, class, order, family, genus, specie
13
VISUAL DESIGN
taxonomic profiles for single query comparison
Less efficient space filling than KRONA
Score representation
Overview of the results
Readable nodes
Details on demand
14
VISUAL DESIGN
taxonomic profiles for multi-query comparisons
Not scalable: Relies in user's memory
No details on demand
Overview
Independent visualizations for each query-result
15
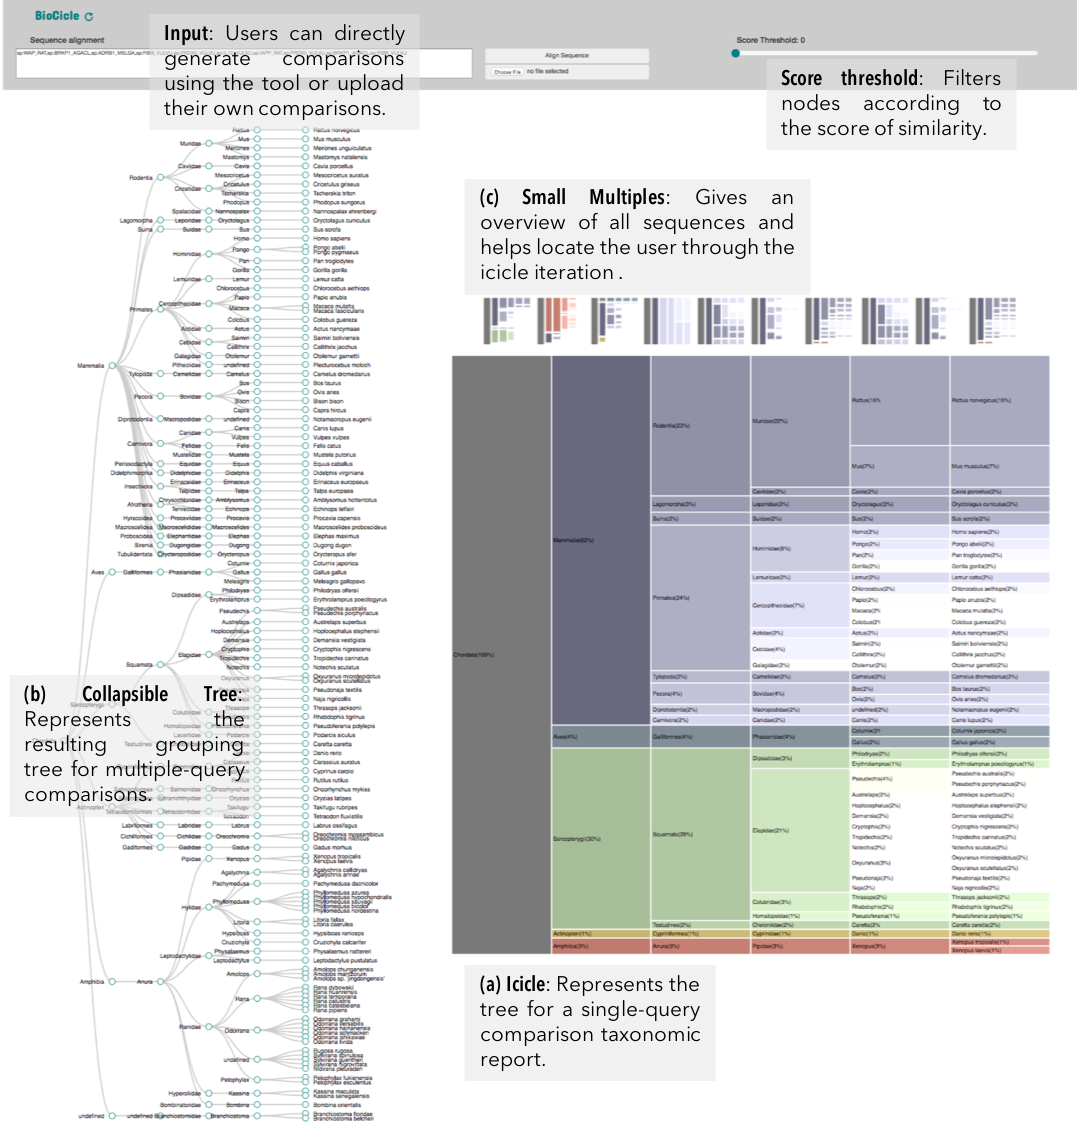
VISUALIZATION
taxonomic profiles for multi-query comparisons
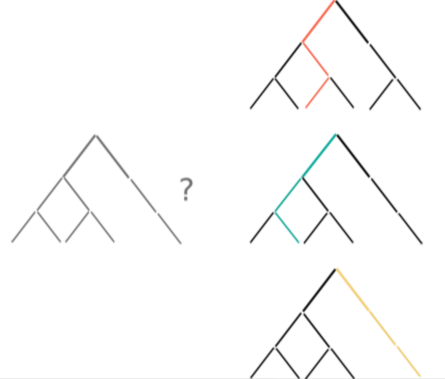
ICICLE
ITERATION
nodes are sort descending by score value
node's position is preserved, as possible
node's color is preserved
children nodes share same tone as parent
labels increase size when being hovered
16
VISUALIZATION
taxonomic profiles for multi-query comparisons
SMALL MULTIPLES
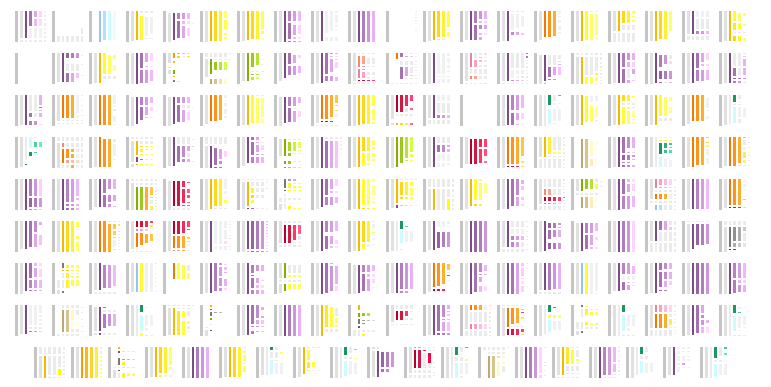
interactive
can be used to select a specific result
only < 500 results are presented due to browser limitations
if dataset is >500, results should be first filtered using the dendogram
17
VISUALIZATION
taxonomic profiles for multi-query comparisons
DENDOGRAM
collapsible tree due to amount of nodes
nodes are sort descending by the amount of organisms with such node in their taxonomy
labels increase size when being hovered
18
VISUALIZATION
taxonomic profiles for multi-query comparisons
SCORE THRESHOLD
relies in the result's highest score: filters leaves with less score than a percentage of the maximum score value
19
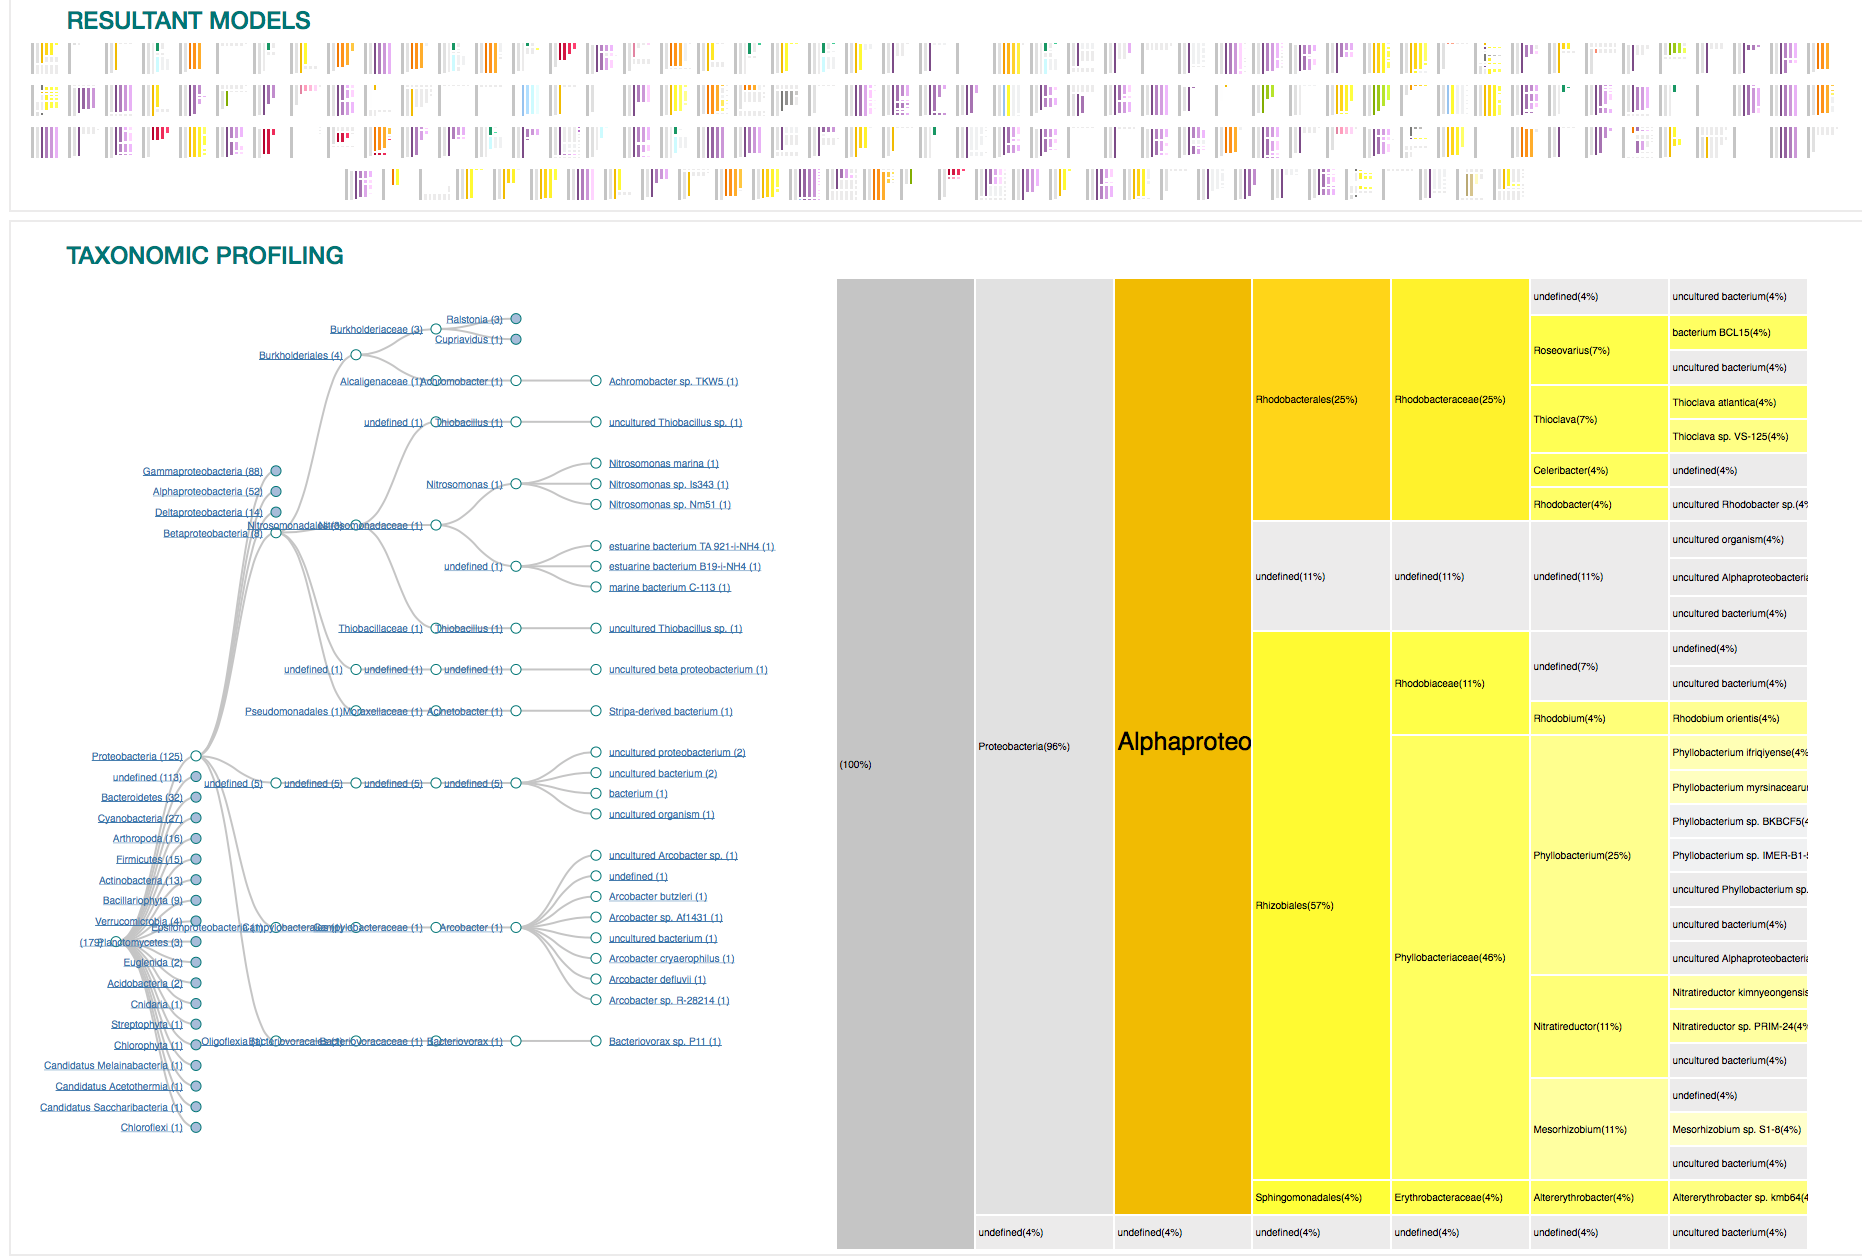
RESULTS
sequence the gen 16S in a single sample
RESULTS
dataset
The gen 16S (sequence tag) was sequenced with a sample producing 23,000 different sequences.
(Only 179 were considered due to time limitations)
objective
What is the diversity of the sample?
Which of this sequences are identified?
What are this sequences?
What are the outstanding characteristics out of them?
20
RESULTS
sequence the gen 16S in a single sample
RESULTS
21
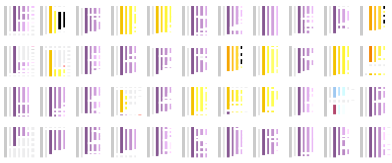
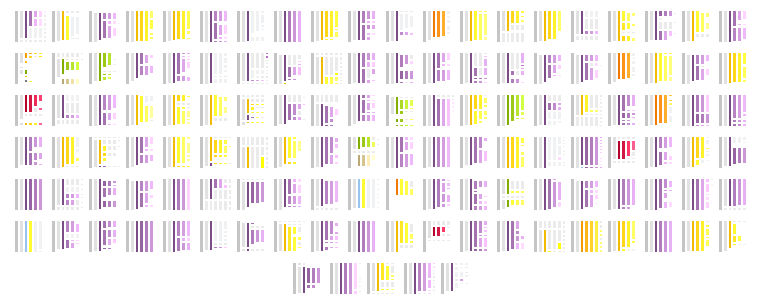
RESULTS
Overview of the entire results
RESULTS
179 sequences (100%)
purples
yellows
oranges
22
RESULTS
RESULTS
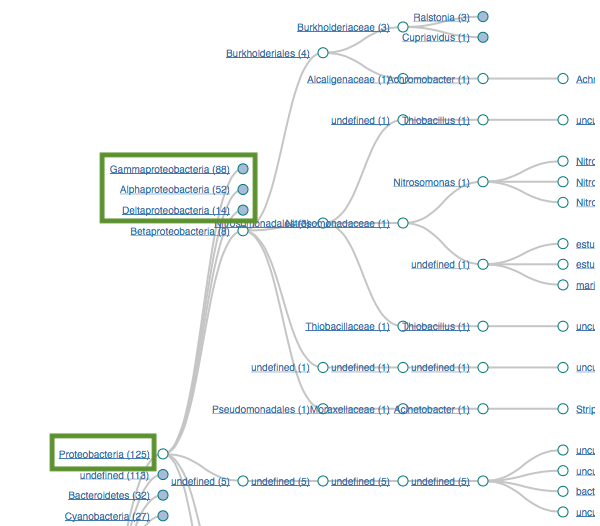
Proteobacteria (125)
Gammaproteobacteria (88)
Alphaproteobacteria (52)
Bacteroidetes (32)
Flavobacteria (22)
23
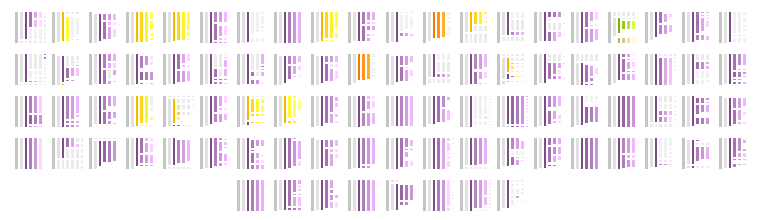
RESULTS
Filtering by Proteobacteria
RESULTS
125 sequences (68.83%)
purples
yellows
oranges
24
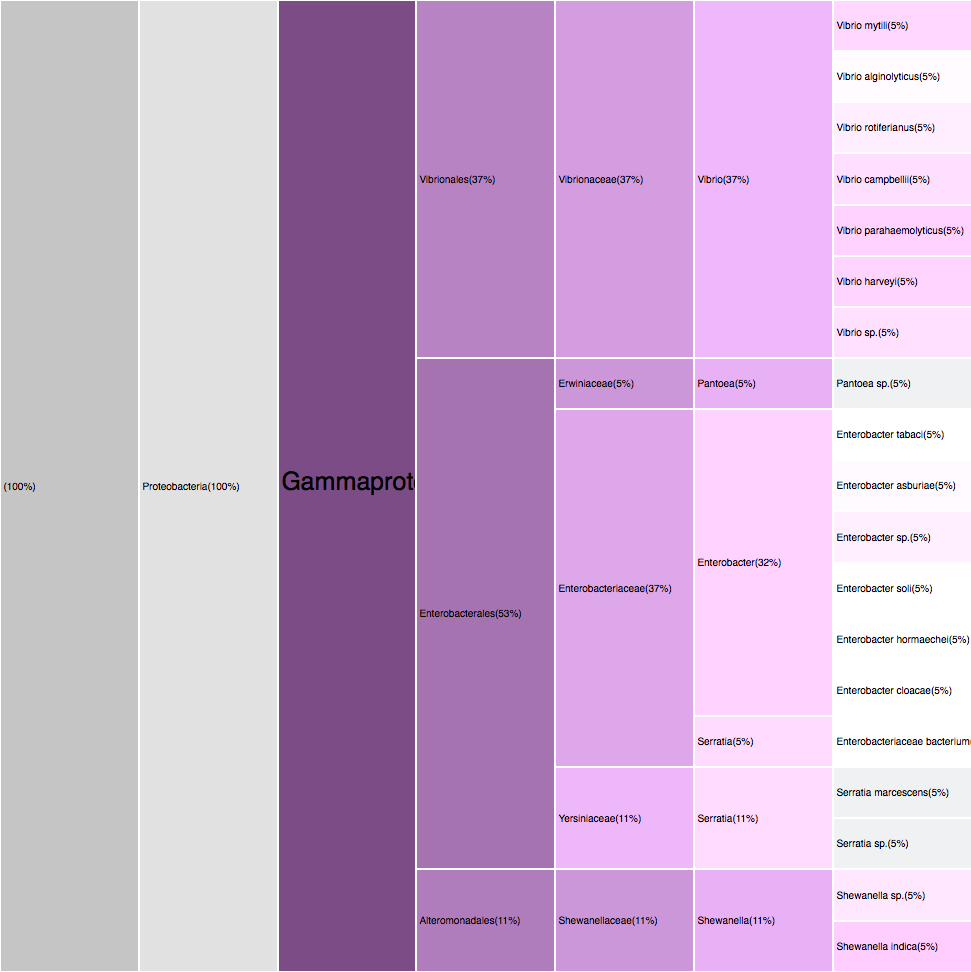
RESULTS
RESULTS
Filtering by Gammaproteobacteria
88 sequences (49.16%)
purples
25
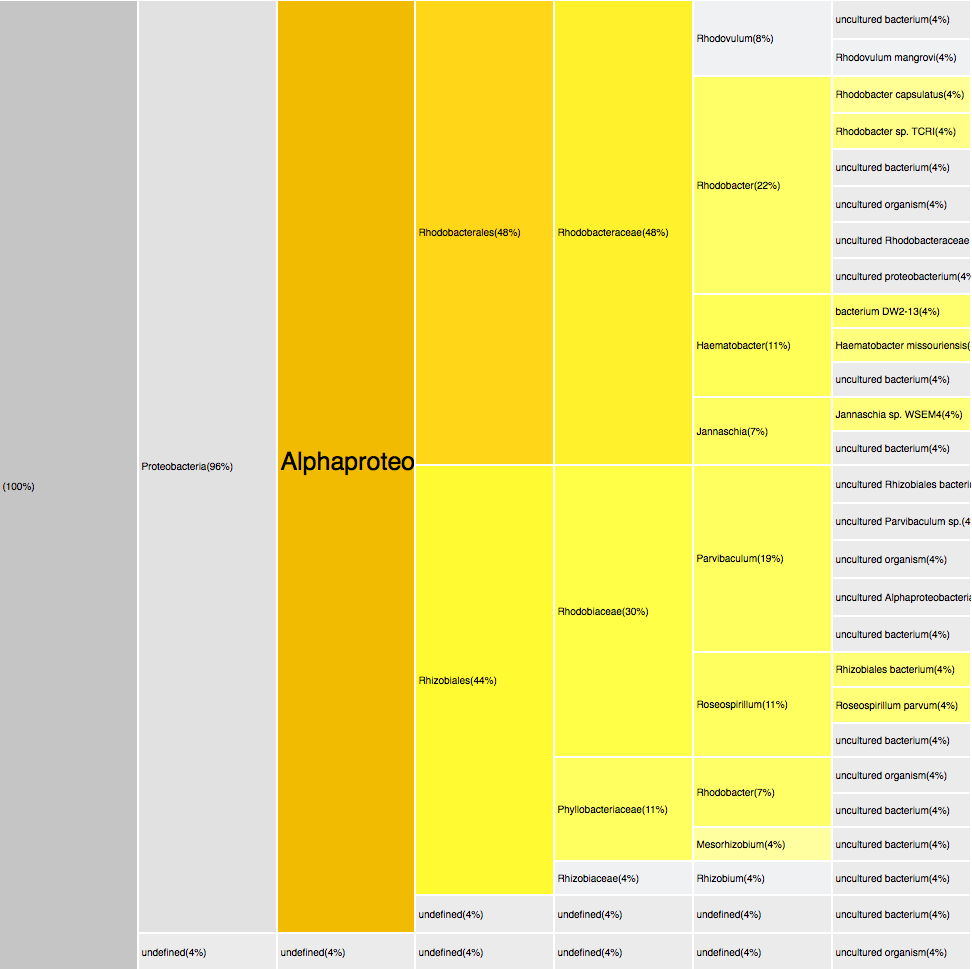
RESULTS
RESULTS
Filtering by Alphaproteobacteria
52 sequences (29.05%)

yellows
26
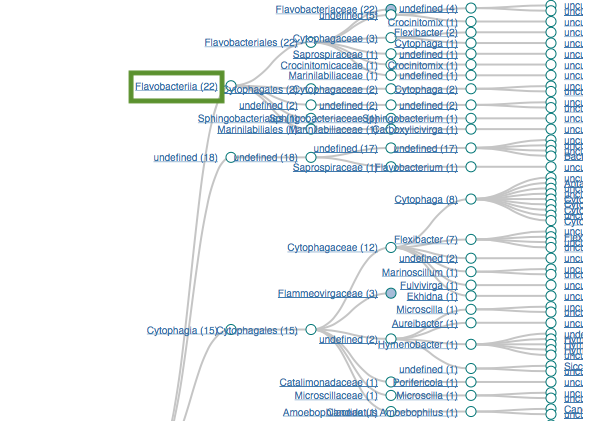
RESULTS
RESULTS
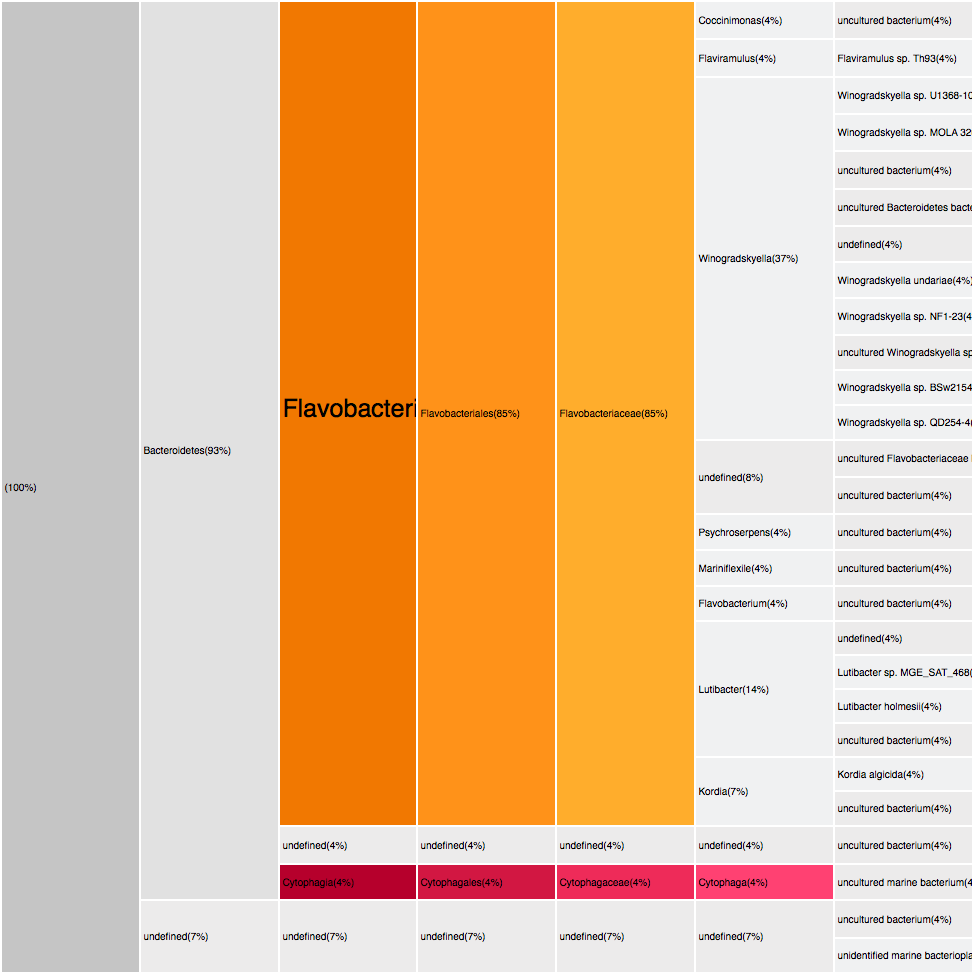
Filtering by Flavabacteria
22 sequences (12.29%)

oranges
27
RESULTS
RESULTS
Conclusions
Gammaproteobacteria
12,29%
Flavobacteria
Deltaproteobacteria
Alphaproteobacteria
49,16%
29,05%
7,82%

Proteobacteria 68,83%
Bacteroidetes 17,87%
28
RESULTS
CONCLUSIONS
- Taxonomy of different analytic tasks considering the state-of-the-art research projects and commercial tools.
- Visualization that summarizes and compares taxonomic profiles (AT2 a,b) and follows good practices of visualization design.
- Web-based and open source prototype connected with the NCBI and the UniProt API.
29
RESULTS
FUTURE WORK
- Tackle AT3 using methods such as text-analysis, feature selection and data mining to ease sequence's description analysis and decrease incorrect insertions rates in biological databases.
30
VIDEO
31
REFERENCES
- Ondov, Brian D, Nicholas H Bergman, and Adam M Phillippy (2011). “Interactive metagenomic visualization in a Web browser”. In: BMC Bioinformatics 12.1, p. 385. issn: 1471-2105. doi: 10.1186/1471-2105-12-385.
- Munzner, Tamara (2014). Visualization analysis and design. CRC press.
- Goll, Johannes et al. (2010). “METAREP: JCVI Metagenomics Reports - an open source tool for high- performance comparative metagenomics”. In: Bioinformatics26, pp. 2631–2632.
-
Conesa, A et al. (2005). “Gene Ontology Database Blast2GO:A universal tool
for annotation, visualization and analysis in functional genomics research”. In:Bioinformatics 21.18, pp. 3674–3676. issn: 1367-4803. doi: 10.1093/bioinformatics/ bti610. -
Dai, Jianyong and Jianlin Cheng (2008). “HMMEditor: a visual editing tool for profile hidden Markov model”. In: BMC Genomics 9.Suppl 1, S8. issn: 1471-2164.
doi: 10.1186/1471-2164-9-S1-S8. arXiv: /doi.org/10.1186/ 1471-2164-9-S1-S8 [Dai, J., & Cheng, J. (2008). HMMEditor: a visual editing tool for profile hidden Markov model. BMC Genomics, 9(Suppl 1), S8. http:]. -
Darzentas, Nikos (2010). “Circoletto: Visualizing sequence similarity with Circos”. In: Bioinformatics 26.20, pp. 2620–2621. issn: 13674803. doi: 10.1093/ bioinformatics/btq484.
-
Gollapudi, Rajesh et al. (2008). “BOV – a web-based BLAST output visualization tool”. In: BMC Genomics 9.1, p. 414. issn: 1471-2164. doi: 10.1186/1471- 2164-9-414.
Gollery, Martin (2005). “Bioinformatics: Sequence and Genome Analysis”. In:Clinical Chemistry 51.11, pp. 2219–2219.
Guy, Lionel et al. (2011). “GenoPlotR: comparative gene and genome visualization in R”. In: Bioinformatics. Vol. 27. 13, pp. 2334–2335. isbn: 1367-4811. doi:10.1093/bioinformatics/btq413.
-
Huson, DH (2016). “MEGAN Community Edition - Interactive exploration and analysis of large-scale microbiome sequening data.” In: PLos Computational Biology 12.6, e1004957. doi: 10.1371/journal.pcbi.1004957.
-
Segata, Nicola et al. (2012). “Metagenomic microbial community profiling using unique clade-specific marker genes.” In: Nature methods 9.8, pp. 811–4. issn: 1548-7105. doi: 10.1038/nmeth.2066. arXiv: 000220567900037.
Thompson, Julie D., Desmond G. Higgins, and Toby J. Gibson (1994). “CLUSTAL W: improving the sensitivity of progressive multiple sequence alignment through sequence weighting, position-specific gap penalties and weight matrix choice”. In: Nucleic Acids Research 22.22, pp. 4673–4680. issn: 0305-1048. doi: 10. 1093/nar/22.22.4673.
THANK YOU!
https://mvanegas10.github.io/BioCicle/
BioCicle
By Meili Vanegas-Hernandez


