Visualizing biological taxonomy
Meili Vanegas Hernández
John Alexis Guerra Gómez
Alejandro Reyes Muñoz
THE PROBLEM
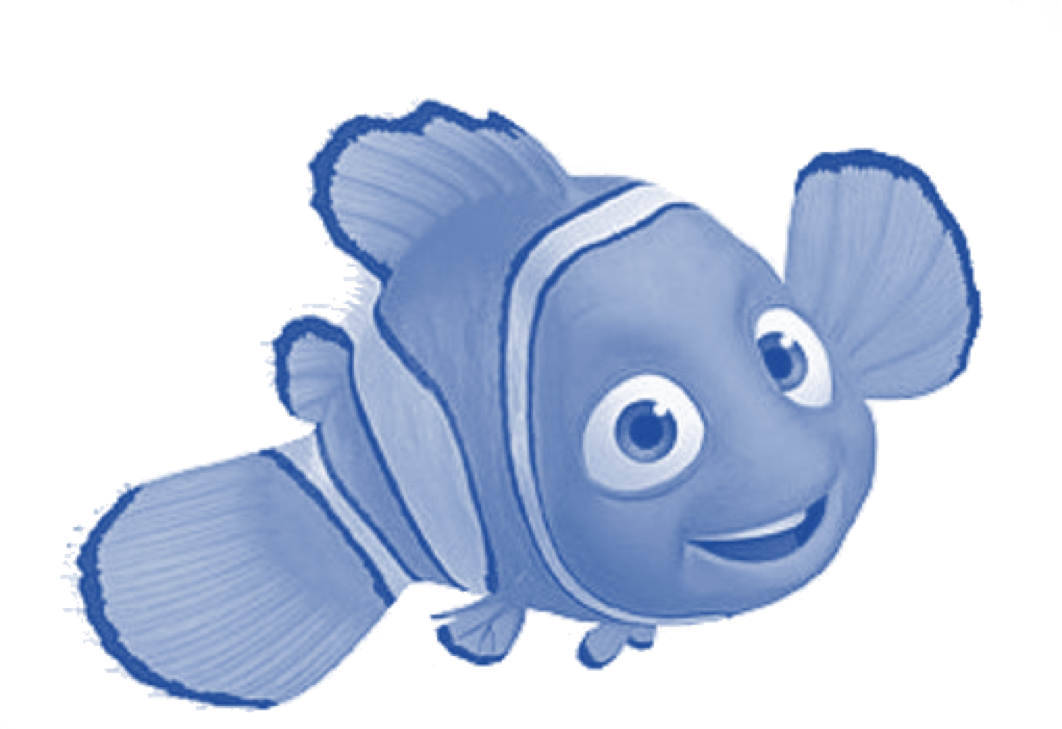
CLASSIFYING NEMO
UNCLASSIFIED


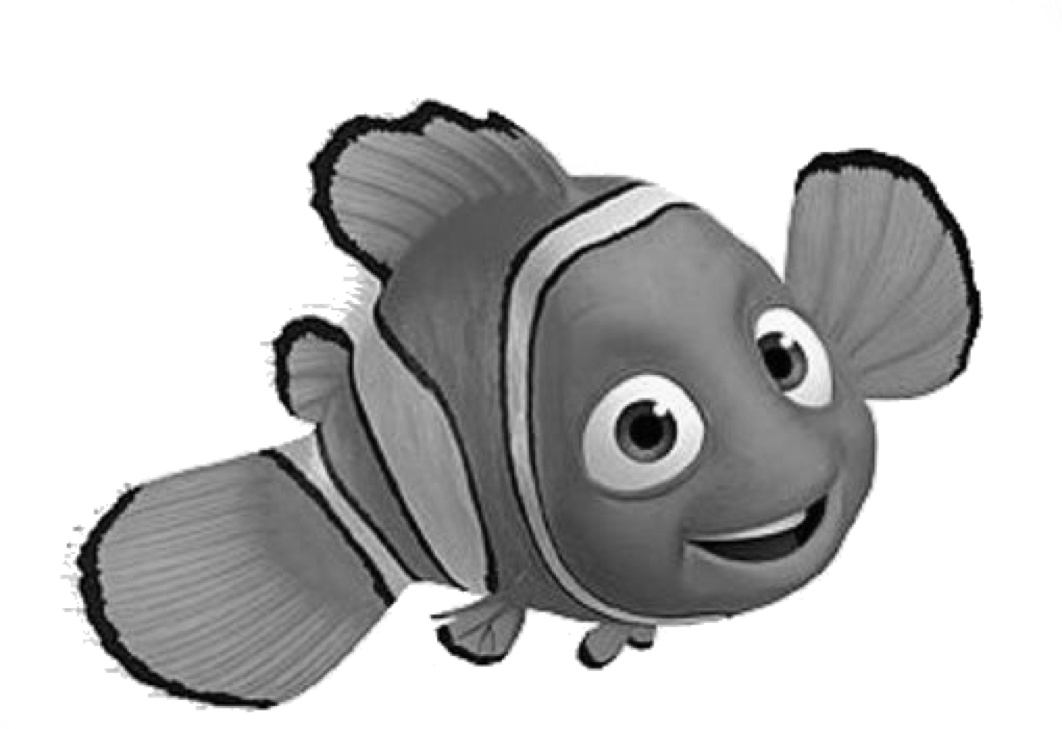
FISH
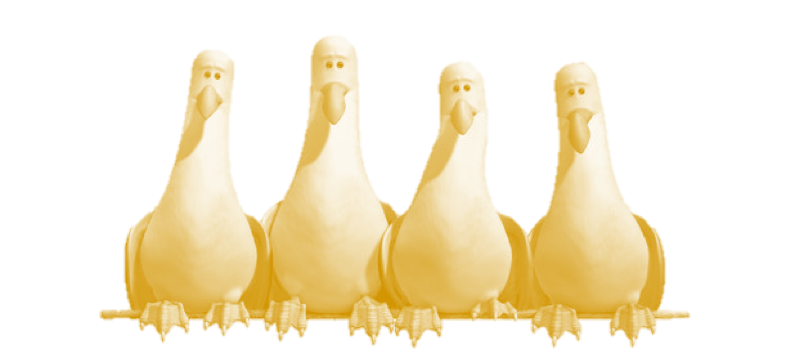
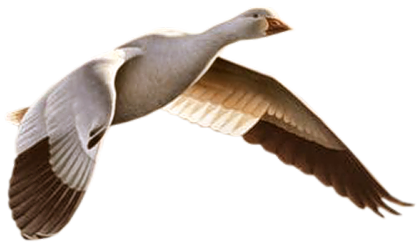
BIRDS
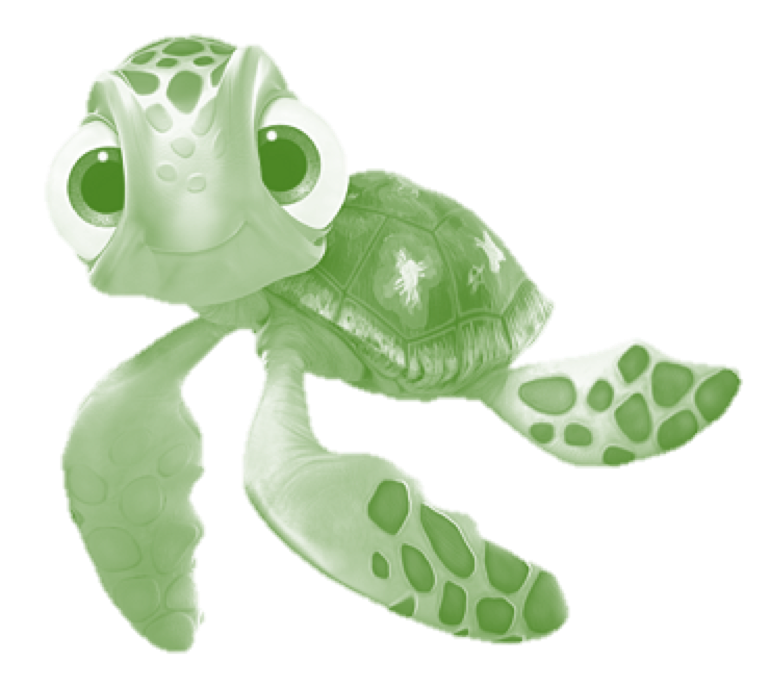
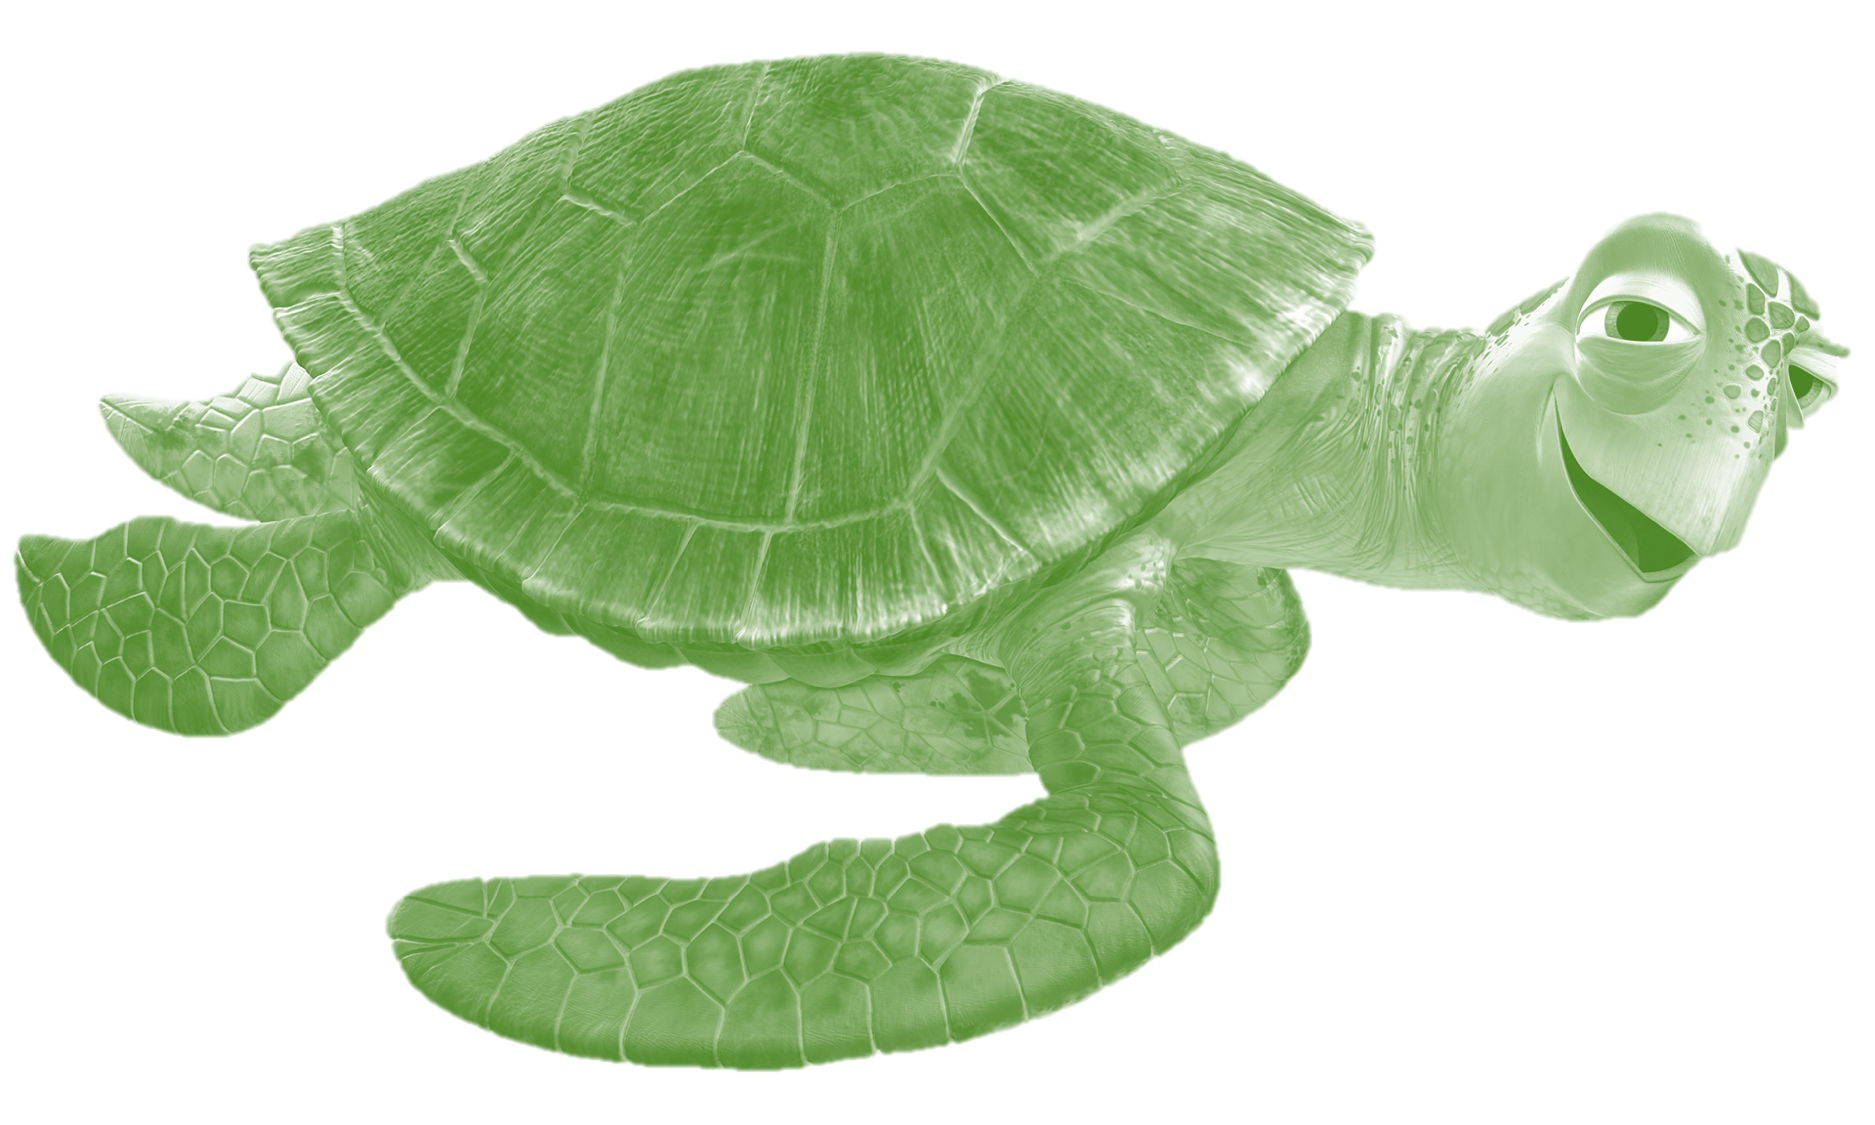
REPTILES
COMPARISON
PHYLUM
CLASS
ORDER
FAMILY
GENUS
SPECIE
ORGANISM
Chordata
Actinopterygii
Perciformes
Acanthuridae
Paracanthurus
P. Hepatus
Paracanthurus Hepatus
Chordata
Actinopterygii
Perciformes
Pomoncentridae
Amphiprion
A. Ocellaris
Amphiprion Ocellaris
VS
.......
Chordata
Reptilia
Testudines
Cheloniidae
Chelonia
C. Mydas
Chelonya Mydas
COMPARISON RESULTS
SCORES
SCORE
How similar is Nemo's DNA to the others
1240
2630
1092
12
10
25
21
BEST SCORE
BINGO!
FISH
BIRDS
REPTILES
THE PROBLEM
What if our set of classified organisms is VERY VERY BIG?

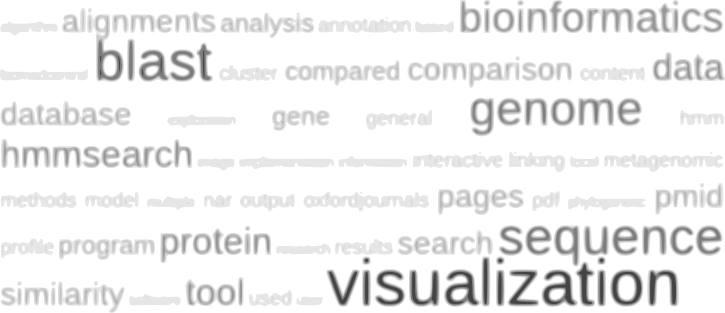
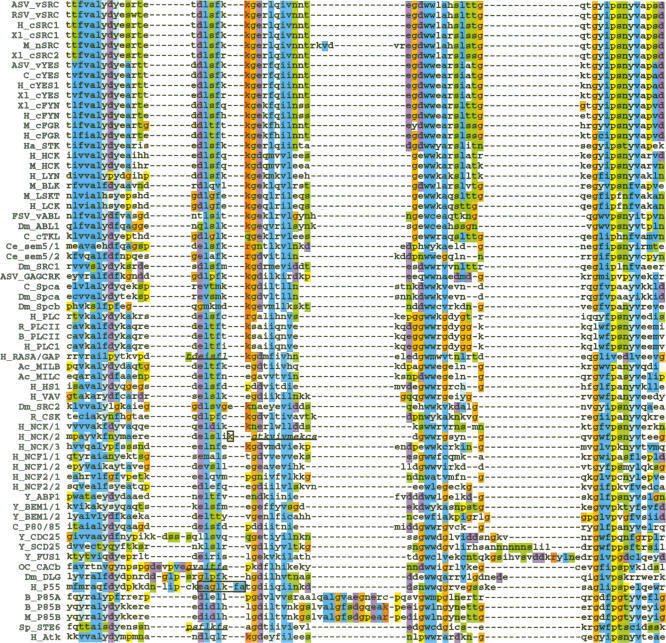
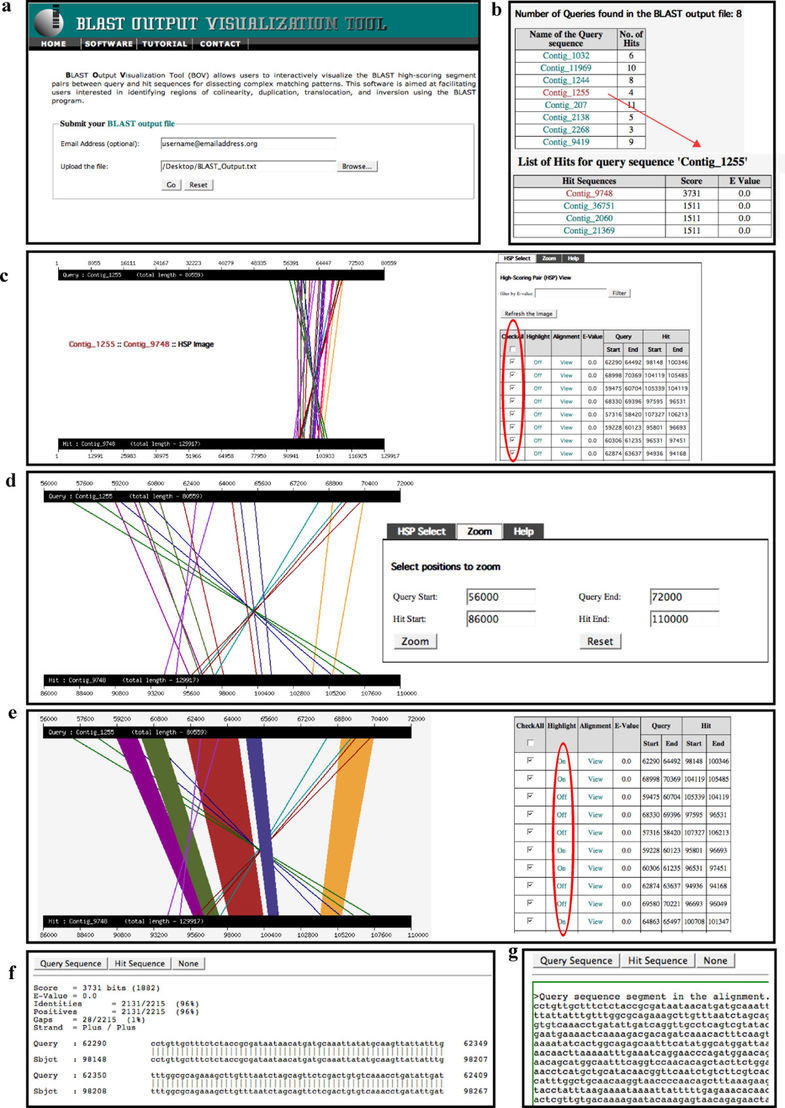
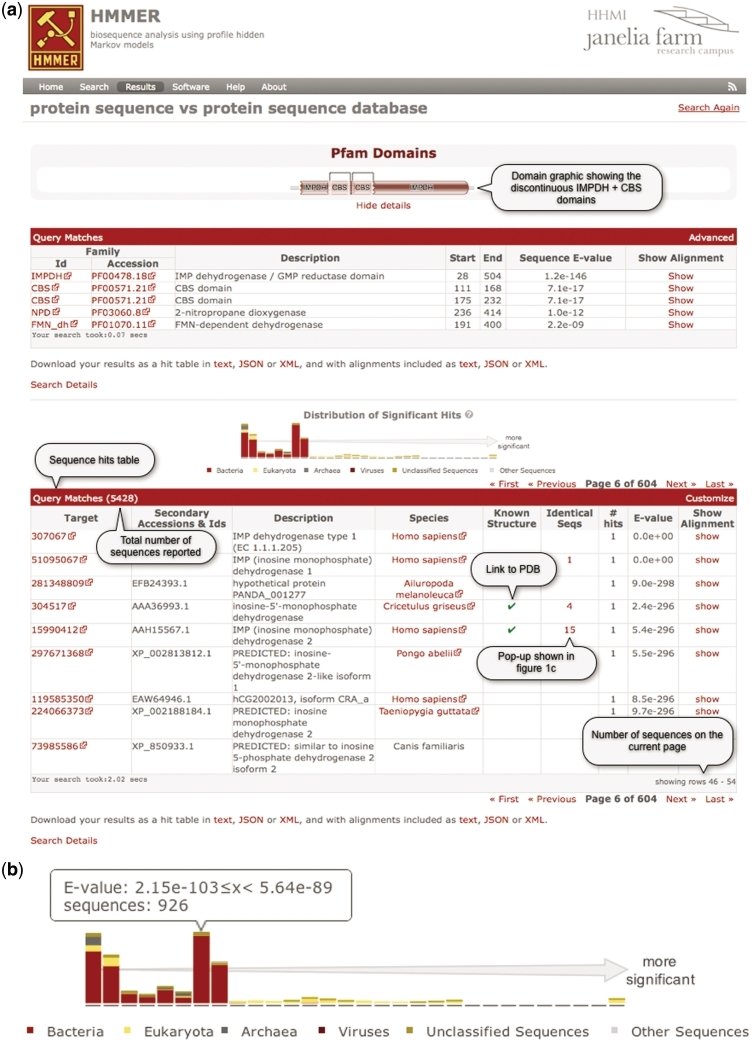
LITERATURE REVIEW
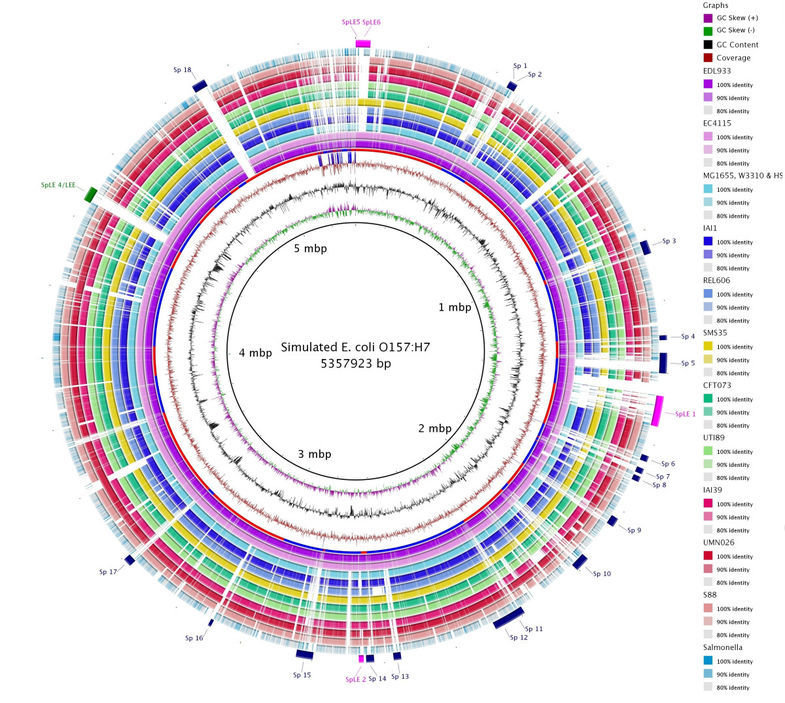
BRIG
CLUSTAL W
BOV
HMMER
WHAT DO THEY HAVE IN COMMON?
- Try to visualize pure DNA comparison
- Most of them are static approaches
- Very technical solutions, non biologists have problems understanding the solutions
- Non-generic approaches
- When comparing multiple results (unclassified organisms) they have limitations
OUR PROPOSAL
- Visualize taxonomy similarities and scores
- Interactive
- Solutions for all public
- Generic approach
- Allows multiple results comparison (multiple unclassified organisms)
OUR PROPOSAL
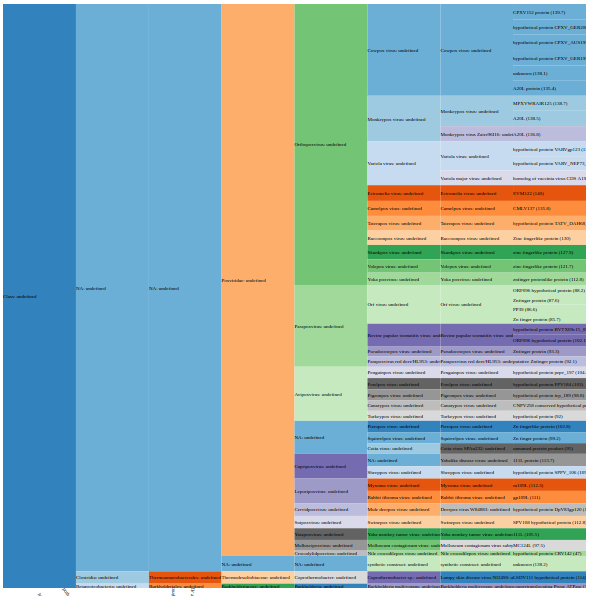
PHYLUM
CLASS
ORDER
FAMILY
GENUS
SPECIE
ORGANISM
NAME
OUR PROPOSAL
PHYLUM
CLASS
ORDER
FAMILY
GENUS
SPECIE
ORGANISM
NAME
OUR PROPOSAL
VisualizingBiologicalTaxonomy
By Meili Vanegas-Hernandez


