Monitoring
Technologies Overview
Abderrahmane Smimite
Summary
- Prometheus
- Grafana
- Fluentd
- VictorOps
Why?
- Ensure High Availability
- Match the SLA
- Anticipate issues
What?
- HW monitoring
- App monitoring
- Dashboard
- Alerting
- On-call rotation
How?
Open Source and community tools

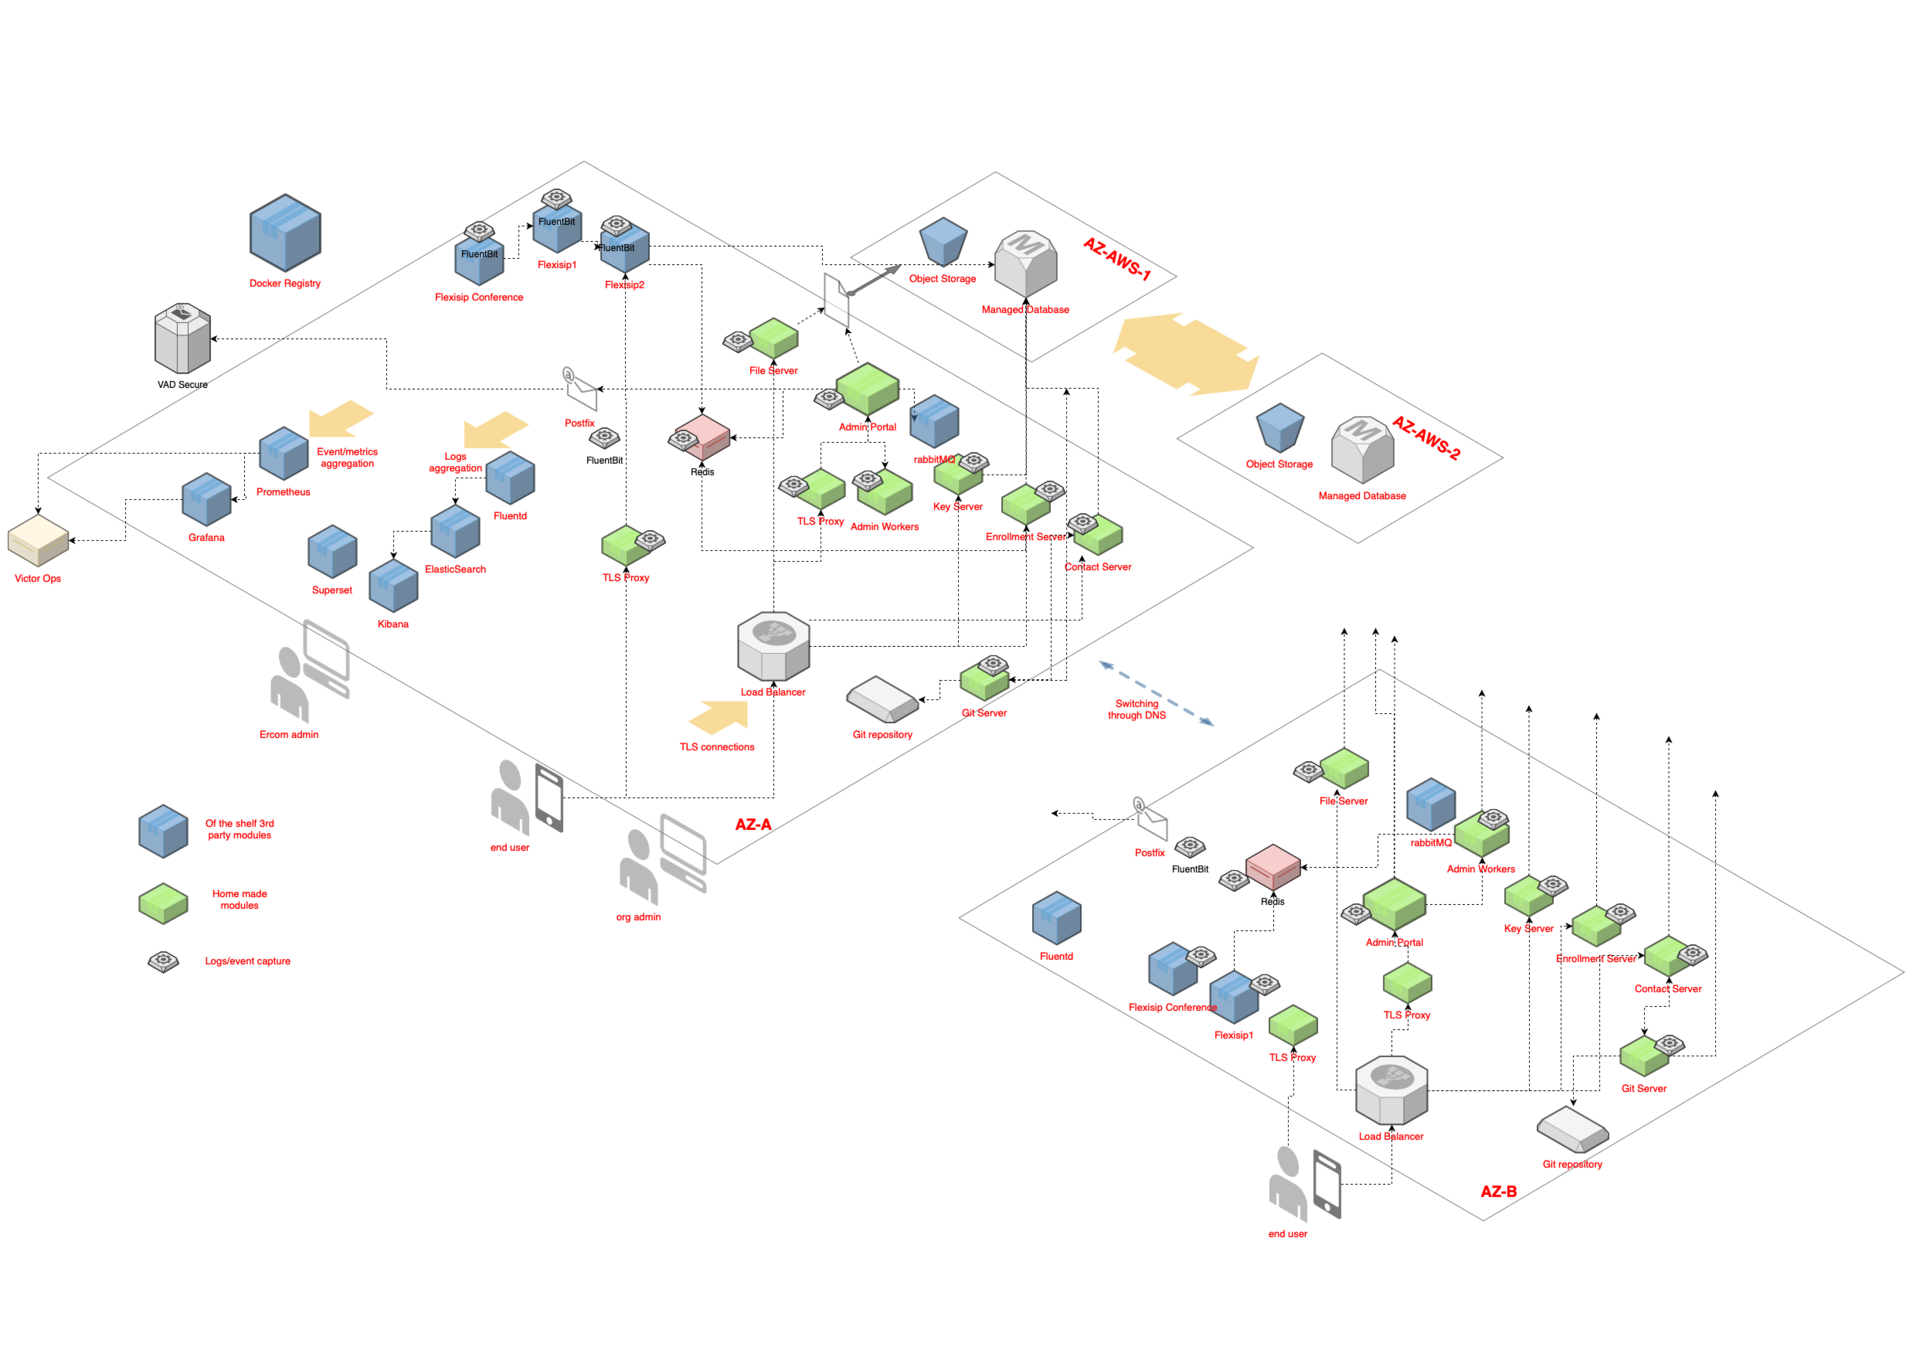
Architecture Overview
and even more impressive:
https://s3.amazonaws.com/OM-SHARE/AWSOFA-Print-27x240.pdf
Stack
Capture metrics
Create dashboard
Exploit app logs
Handle alerts
Manage On-call
Prometheus*
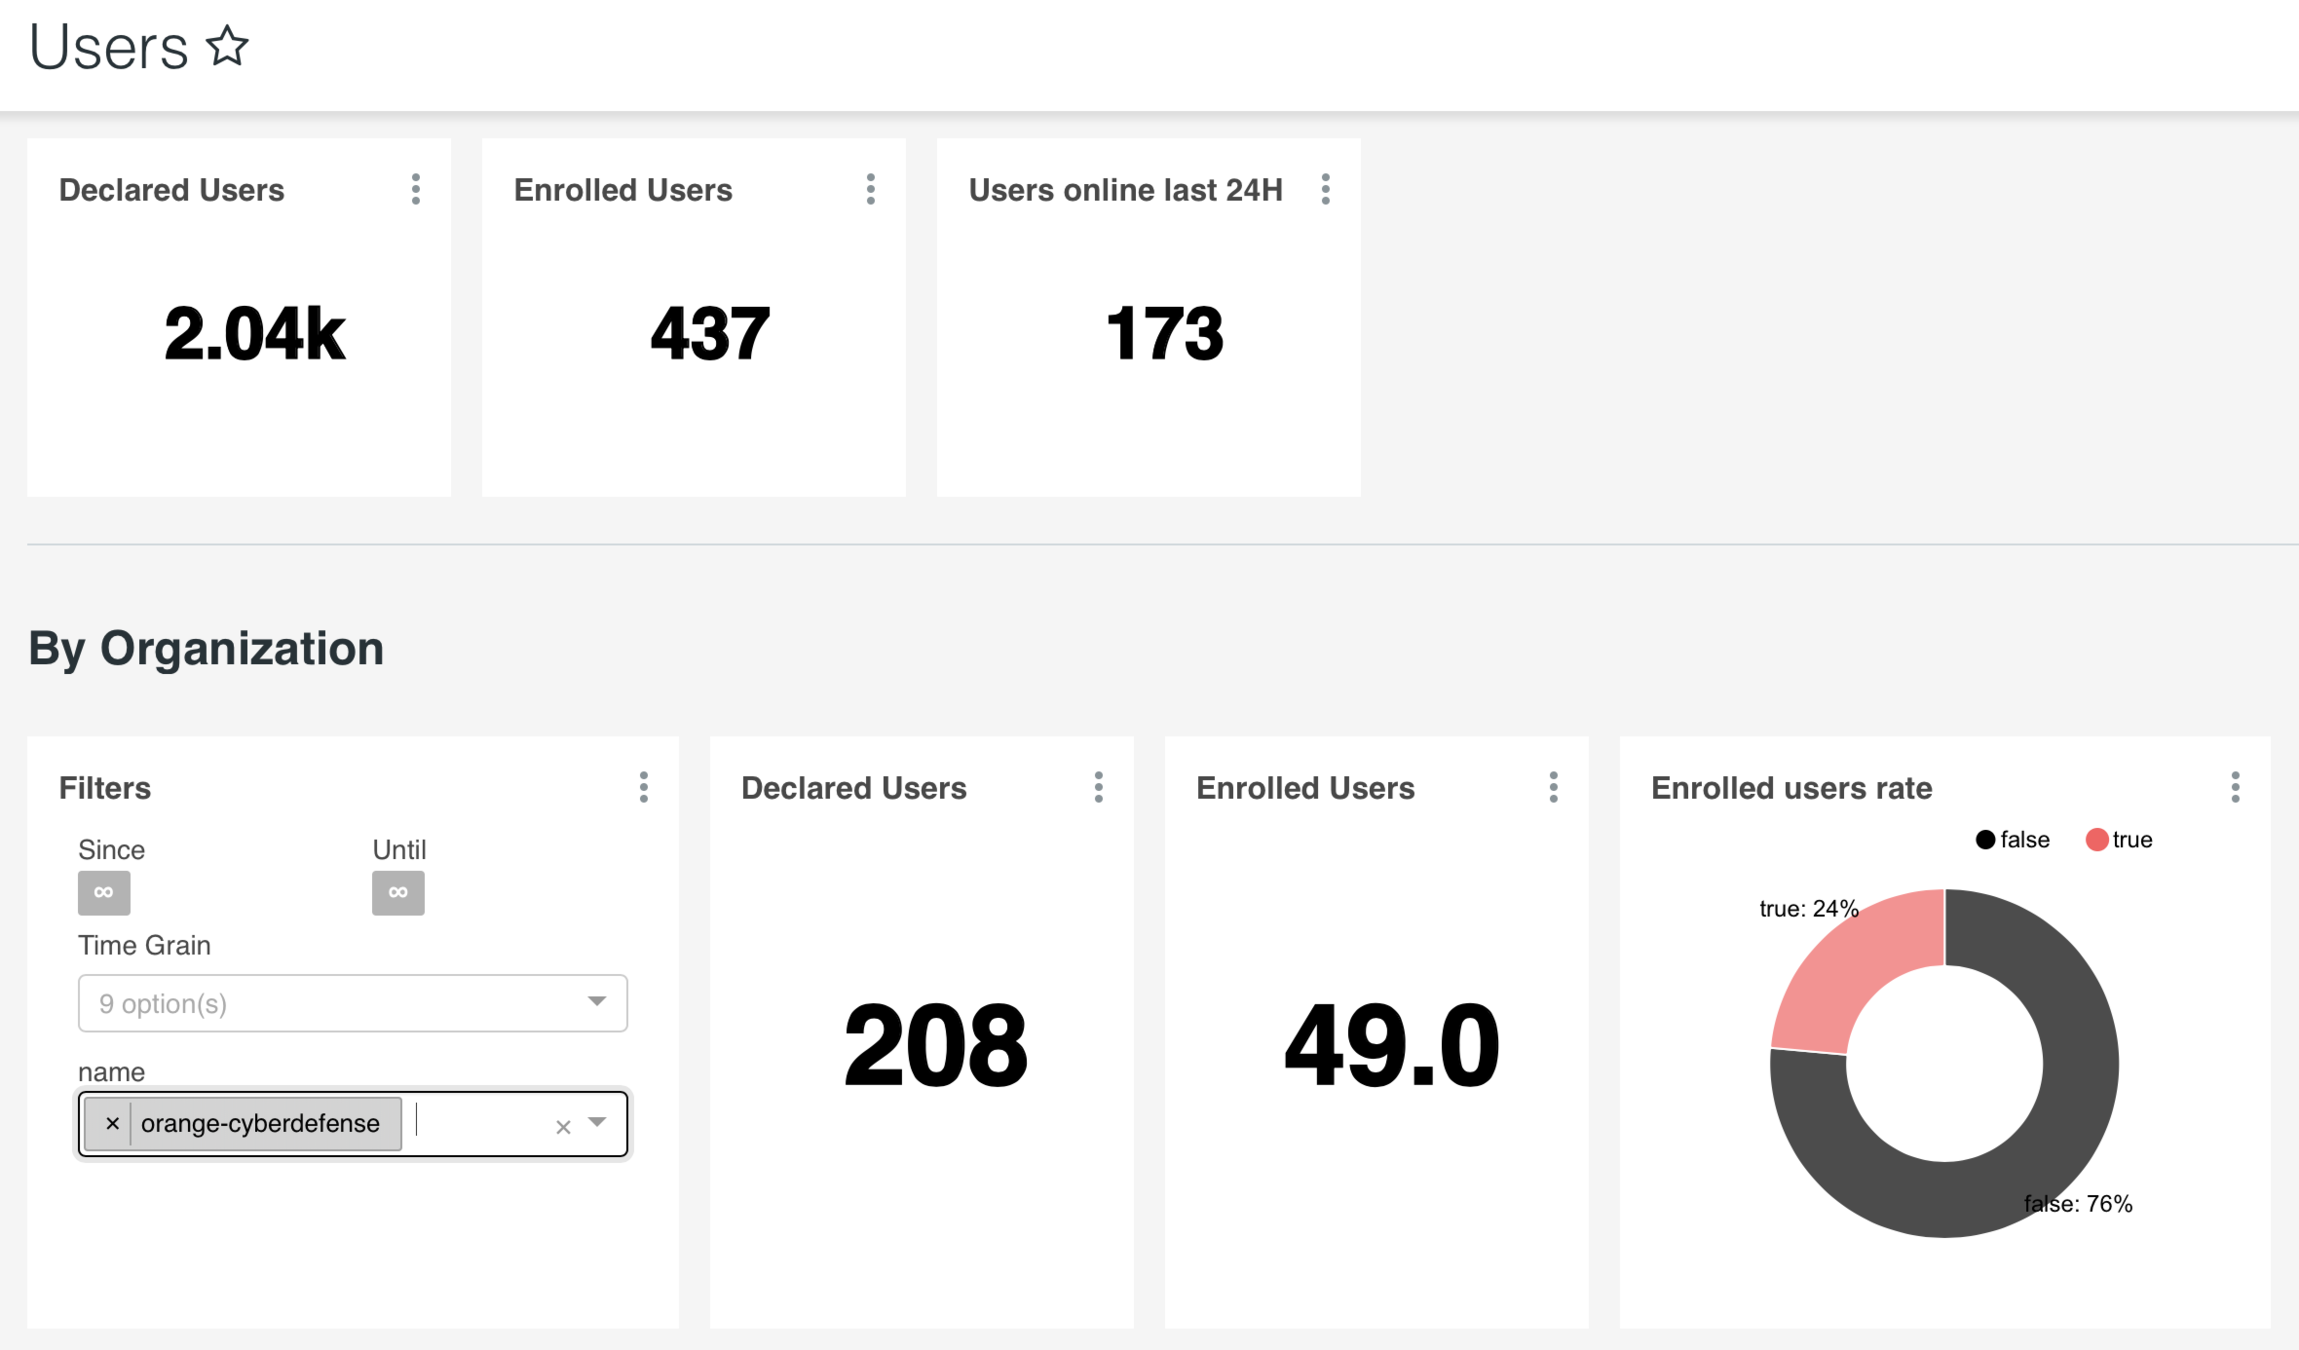
Grafana*+Superset
Fluentd + ELK
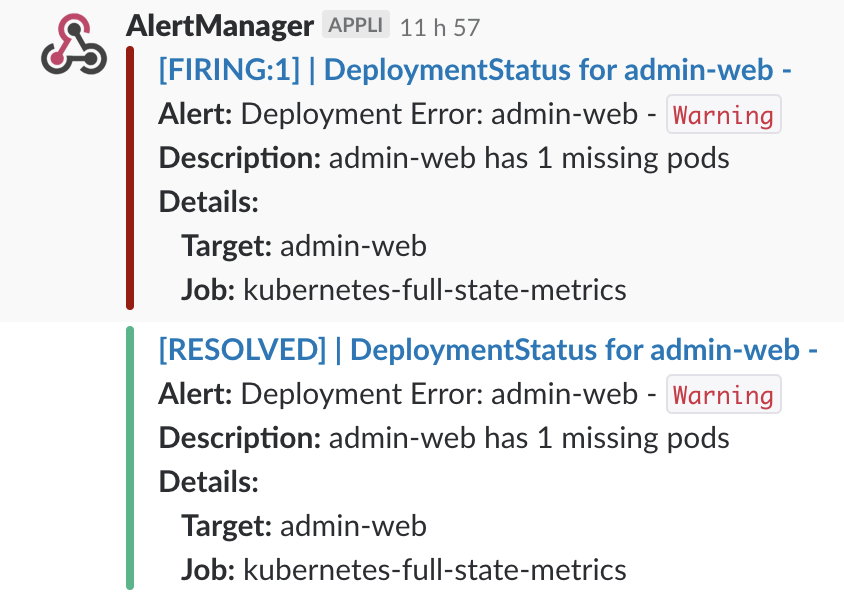
AlertManager*
VictorOps
Prometheus
CNCF project, Mange the complete flow of handling metrics (from capture using custom exporters to alerting using AlertManager)
Grafana
Initially forked from Kibana, great/active community, native ACL, multiple plugins, Prometheus support, embedded alerting
SuperSet
Apache (incubating) project, Web-based BI tool, native ACL, native CSV/SQL/Druid data source
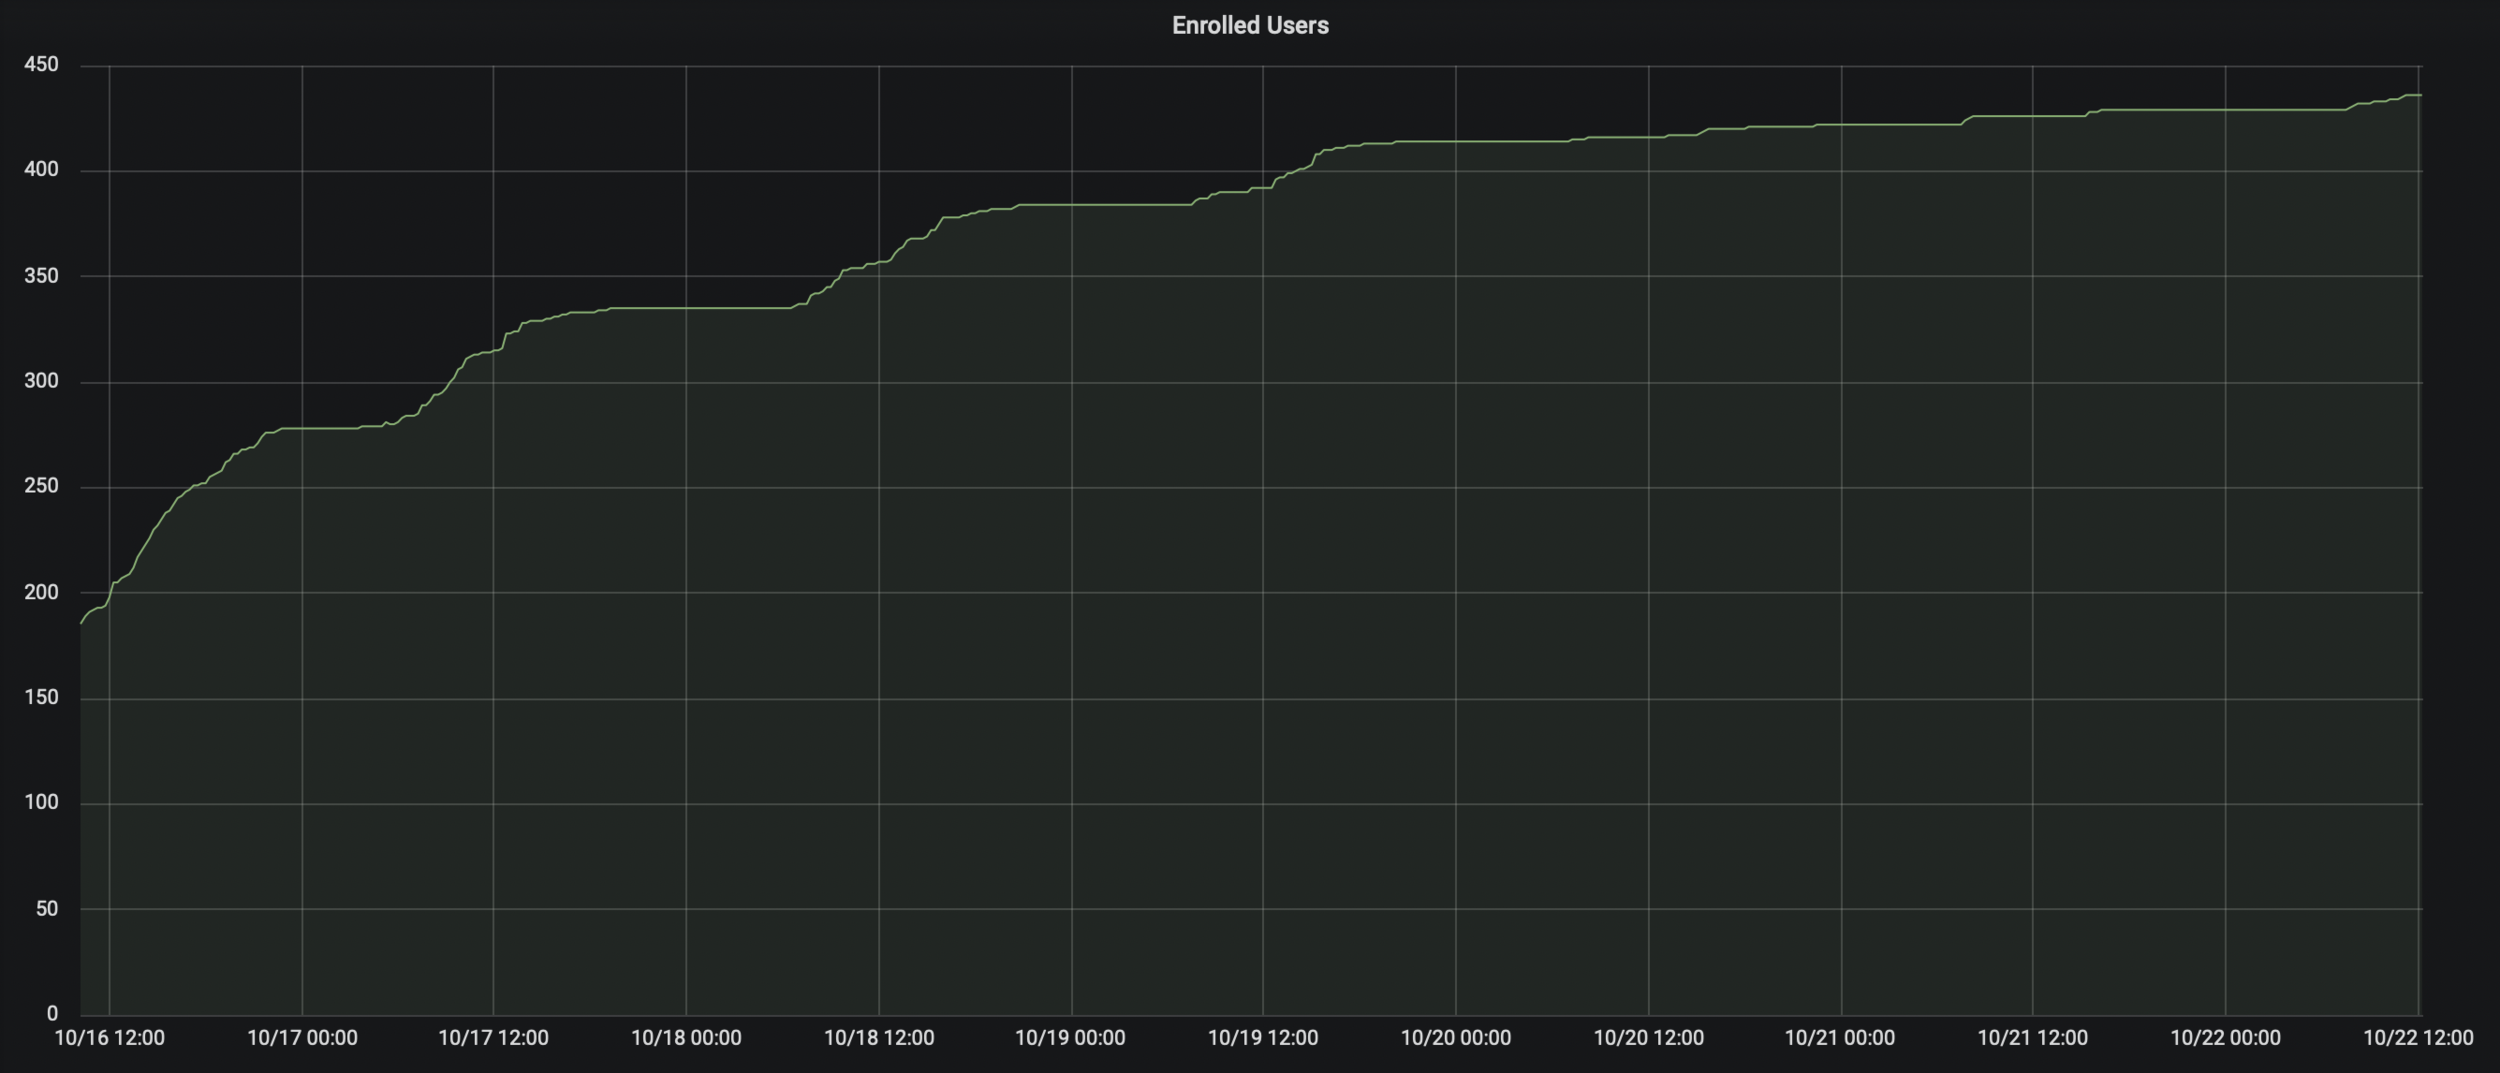
Illustration: Enrollment trend over the first week of Cryptopass V2 migration
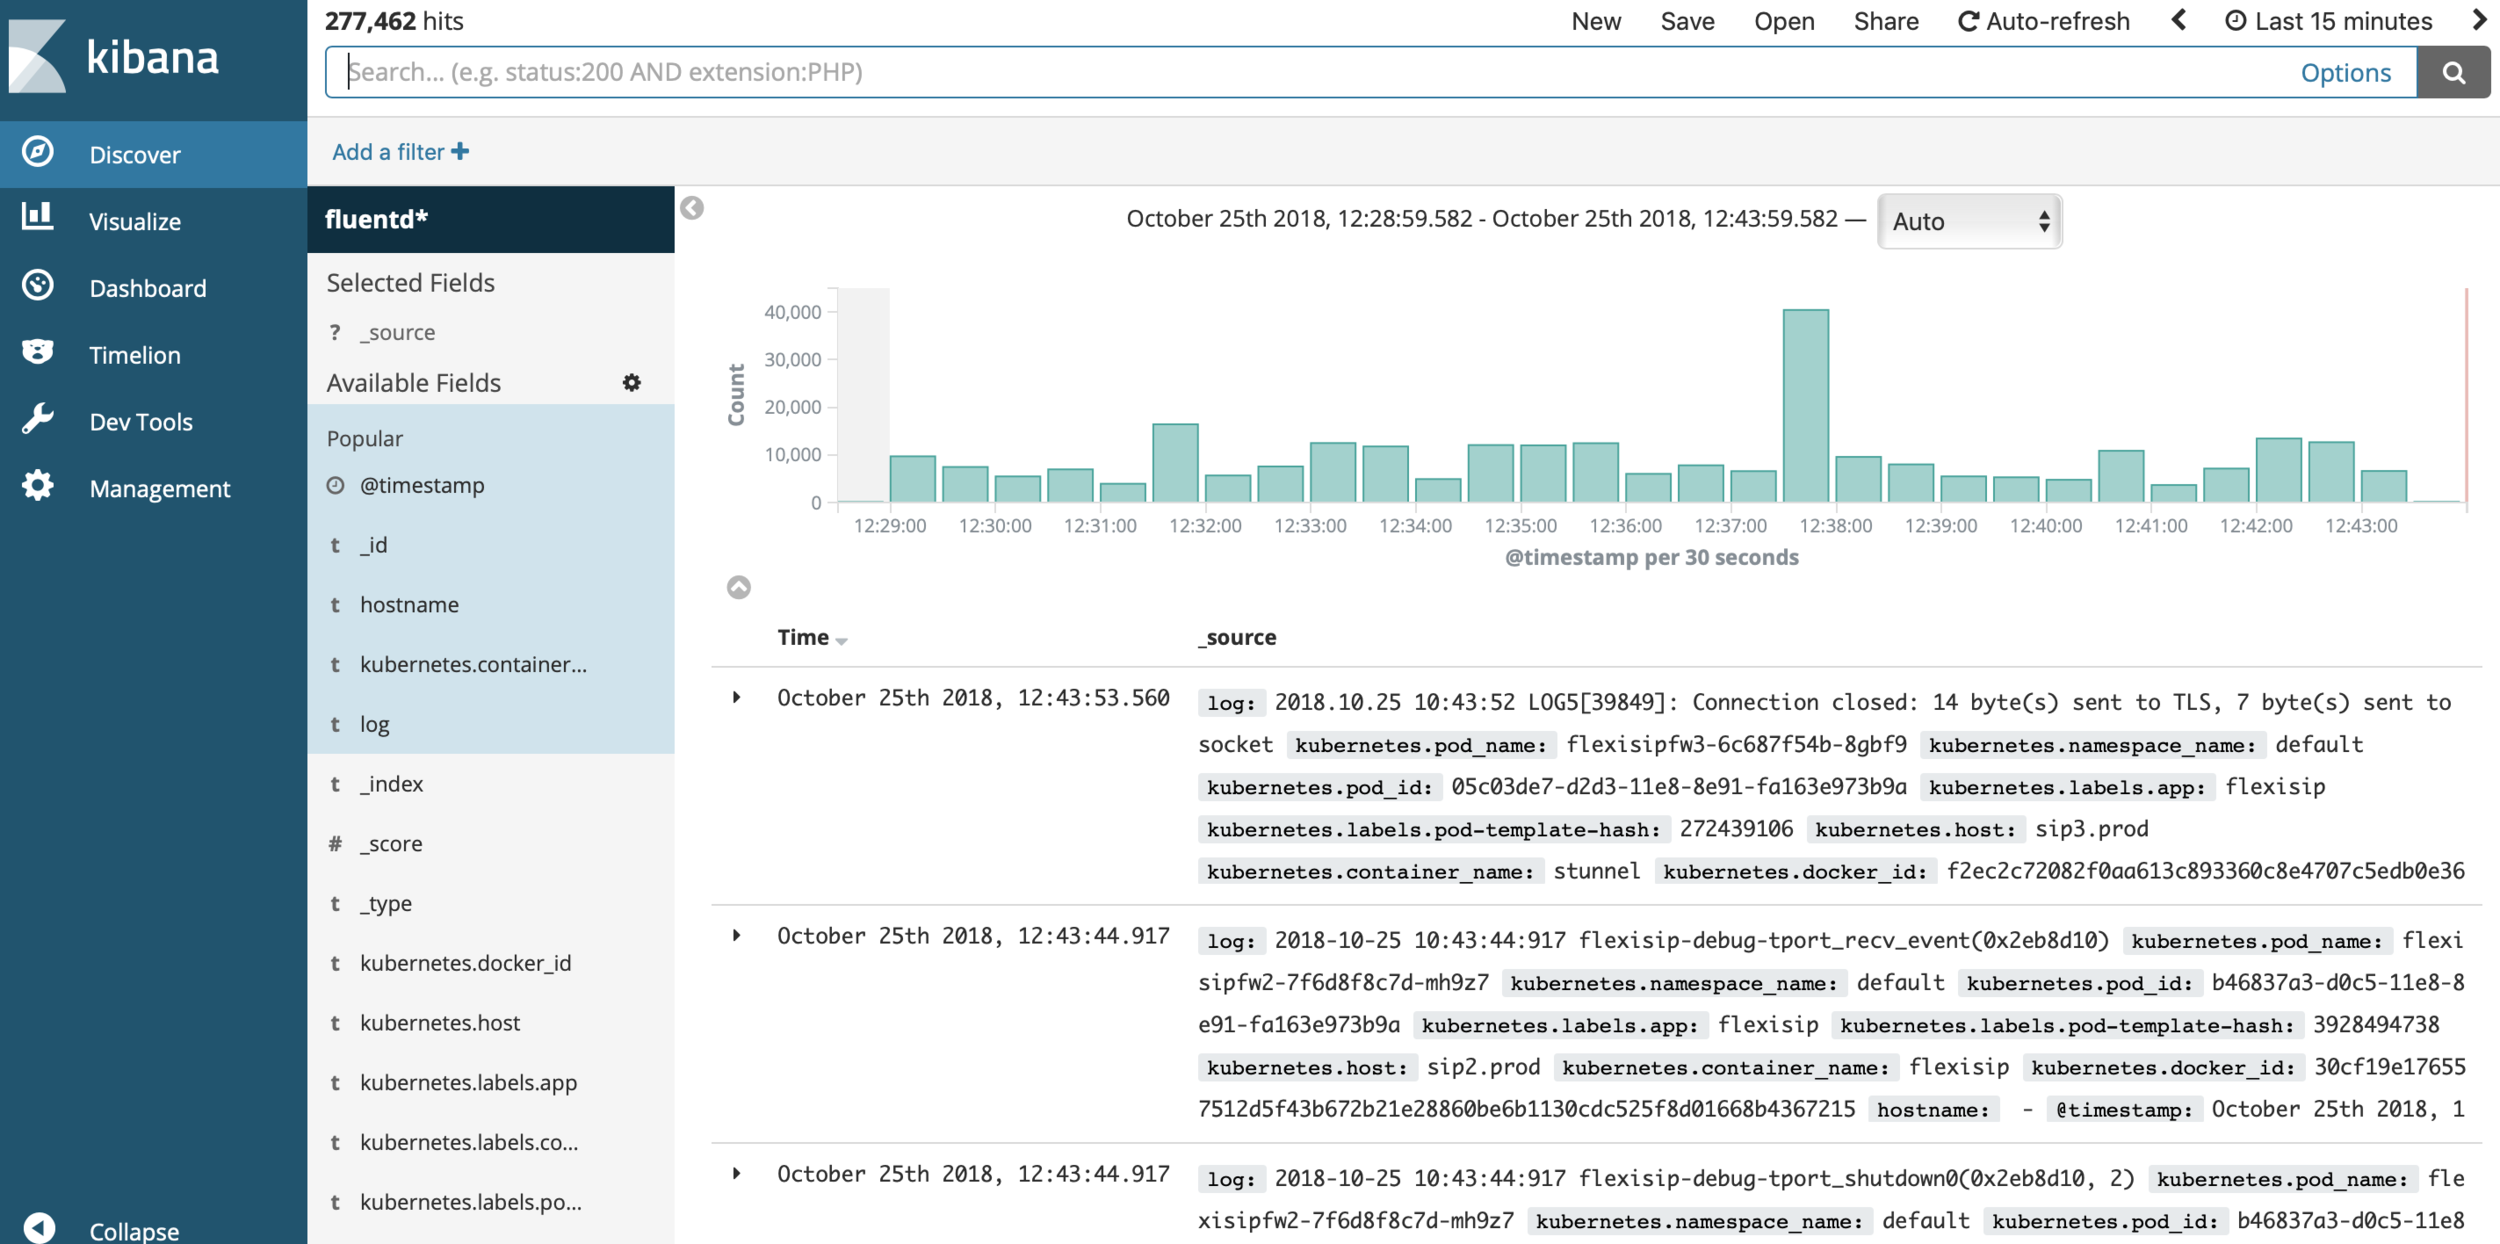
ELK
ElasticSearch + Logstash* + Kibana, logs indexation and browsing
Fluentd
Log aggregator (logging layer), +500 data sources, can be coupled with Fluentbit (log capture)

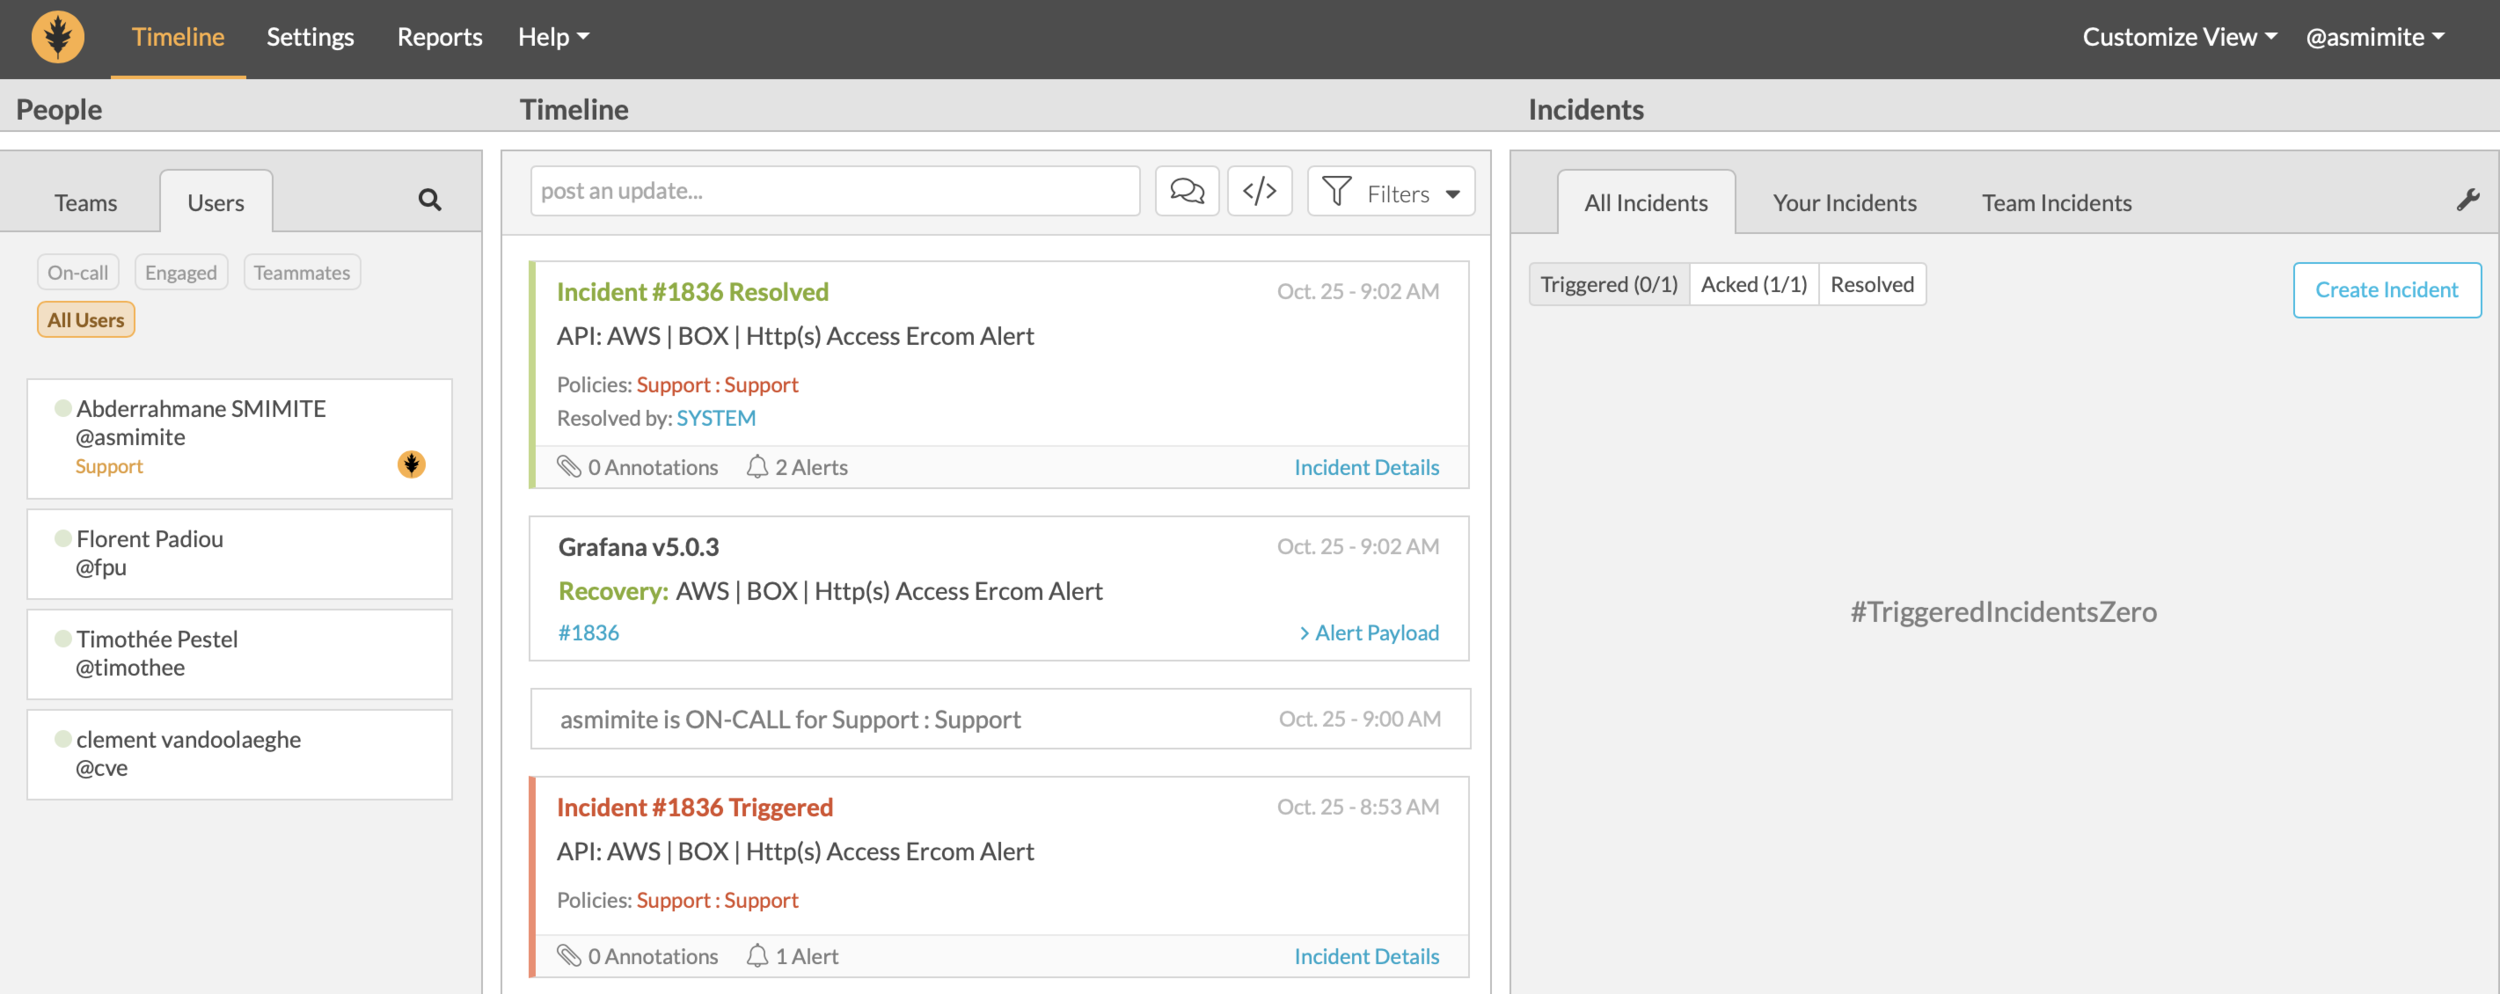
VictorOps
Extended alerting and on-call management platform. According to events, triggers push notifications, SMS and phone calls (bot), is now part of Splunk
Takeaways
- A lot of efficient tools are now available
- Flow between the tools is mandatroy
- Metrics are not a target, it's a tool
- .. and talk to your neighbors*, they don't bite (yet) 😊
* inside joke
Monitoring
By abder
Monitoring
How we manage it monitoring within our micro service architecture


