


Abdoul N'Diaye
French Software Developer using DevOps tools | Fan of #OpenSource projects and new technologies. I also like Häagen-Dazs ice creams.
@AbdoulNDiaye
http://abdoul-ndiaye.info
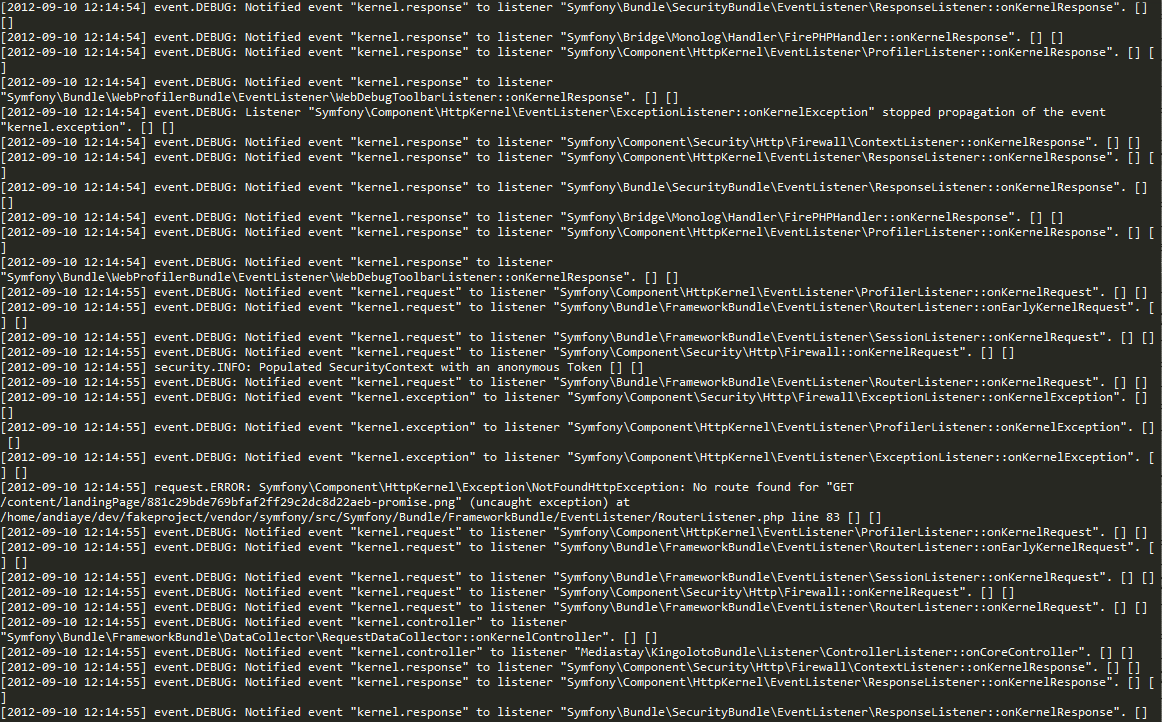
Logs are full of information BUT they are also full of useless
things when you have a problem to solve !
And now, what do you use ?
http://slides.seld.be/?file=2013-12-13+Application+monitoring+with+Heka+and+statsd.html#5
Nothing ? :(
System monitoring ?
collectd, cacti, nagios, ganglia, munin, ...
Performance / Metrics ?
Statsd, sentry, librato, ...
Error reporting ?
New relic, ...
Log aggregation and routing?
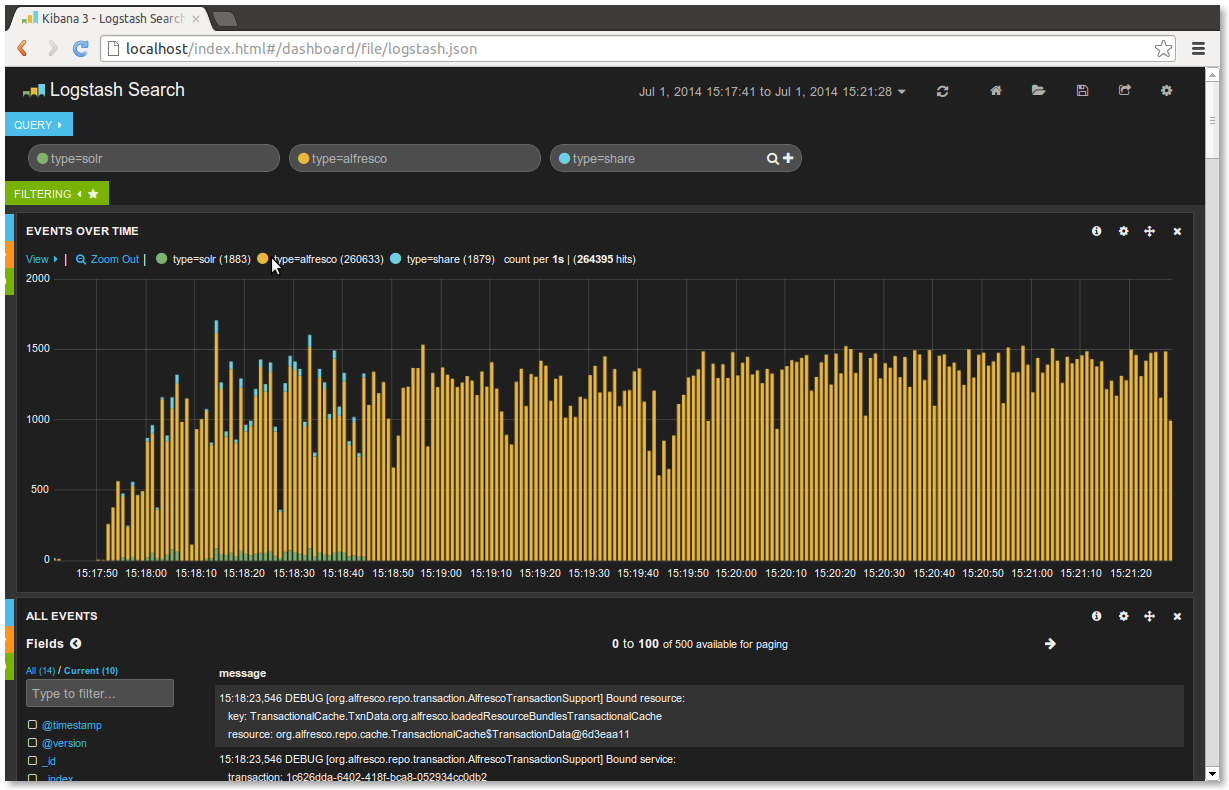
graylog, loggly, splunk, logstash, syslog, ..
+ Kibana, graphite, graphana, etc ...
One Solution
Made by Mozilla
Written in Go and Lua
Inspired by Logstash
What is already integrated in Heka?
System monitoring !
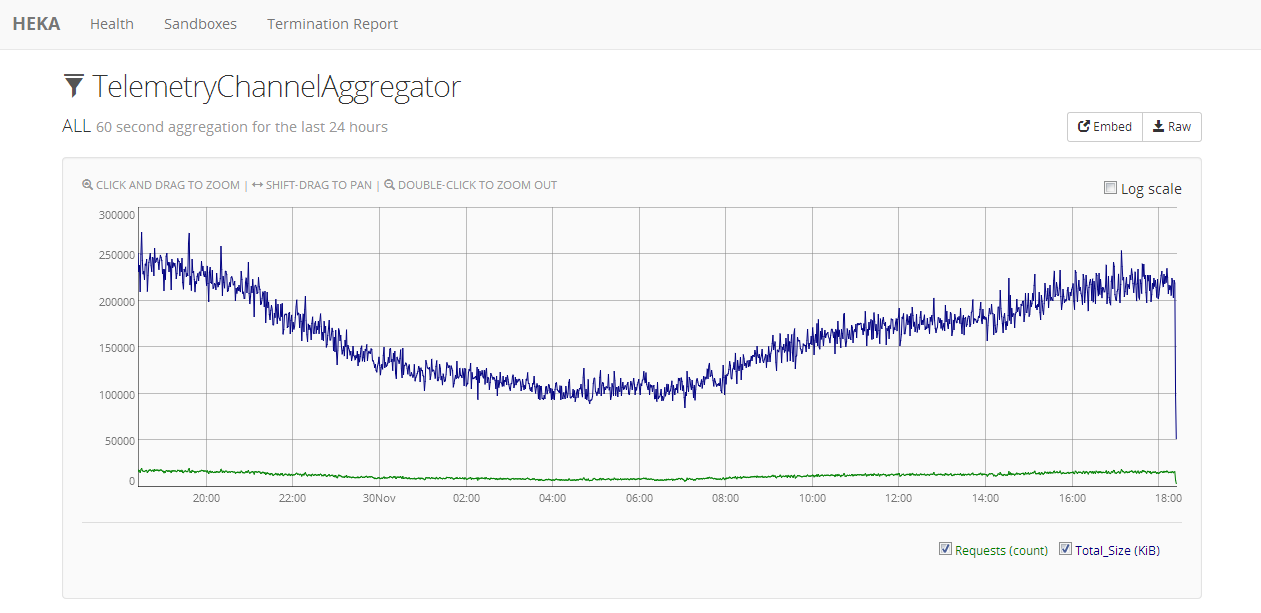
Performance / Metrics !
Log aggregation and routing !
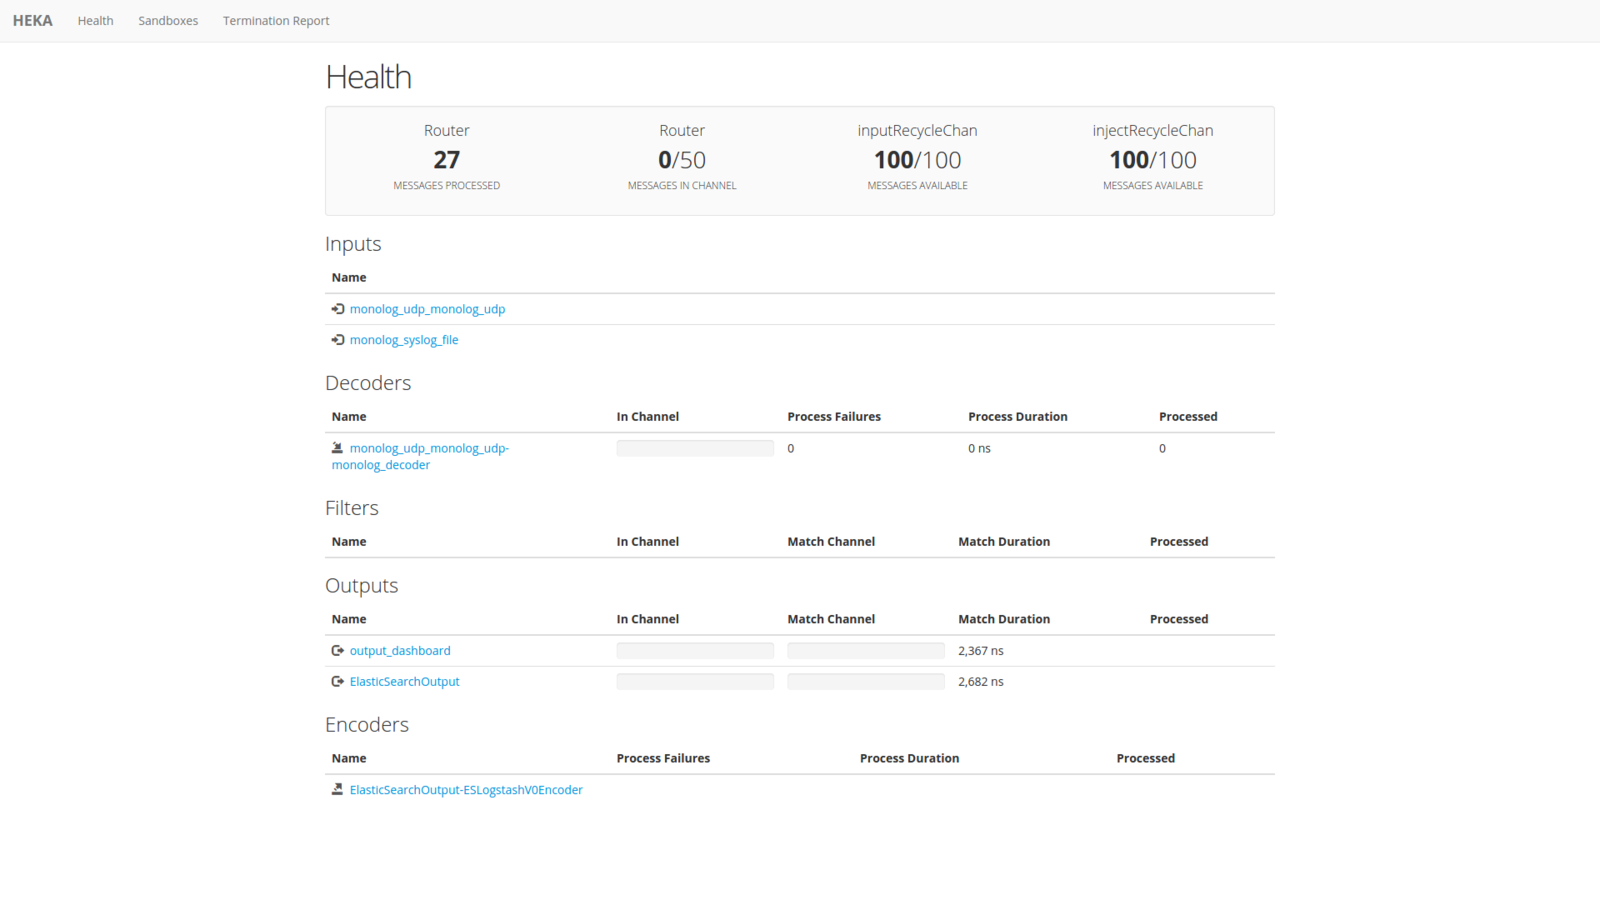
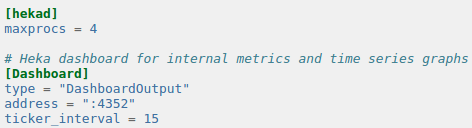
Usefull dashboard
Basic Pattern
Inputs
Decoders
Router
Outputs
In details...
Heka is also :
v0.8.0
An example
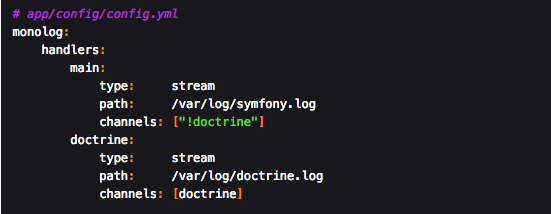
sf2 app
heka
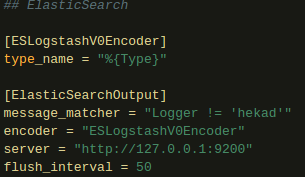
elastic search
Kibana
2 differents ways
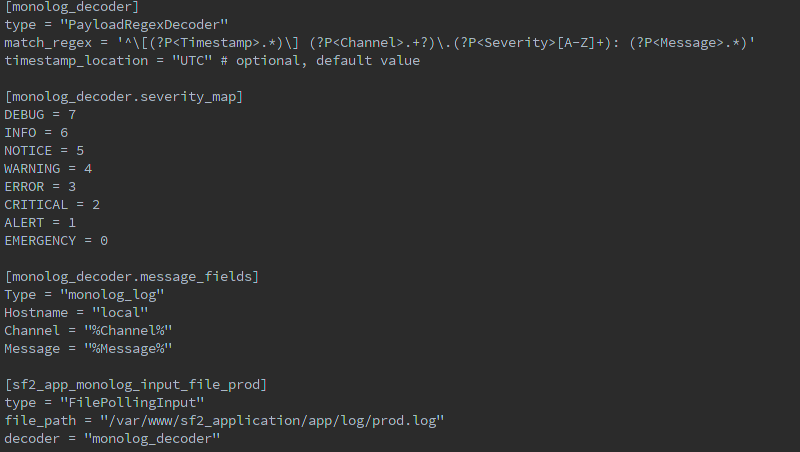
Files
Explication Here
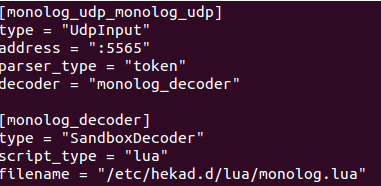
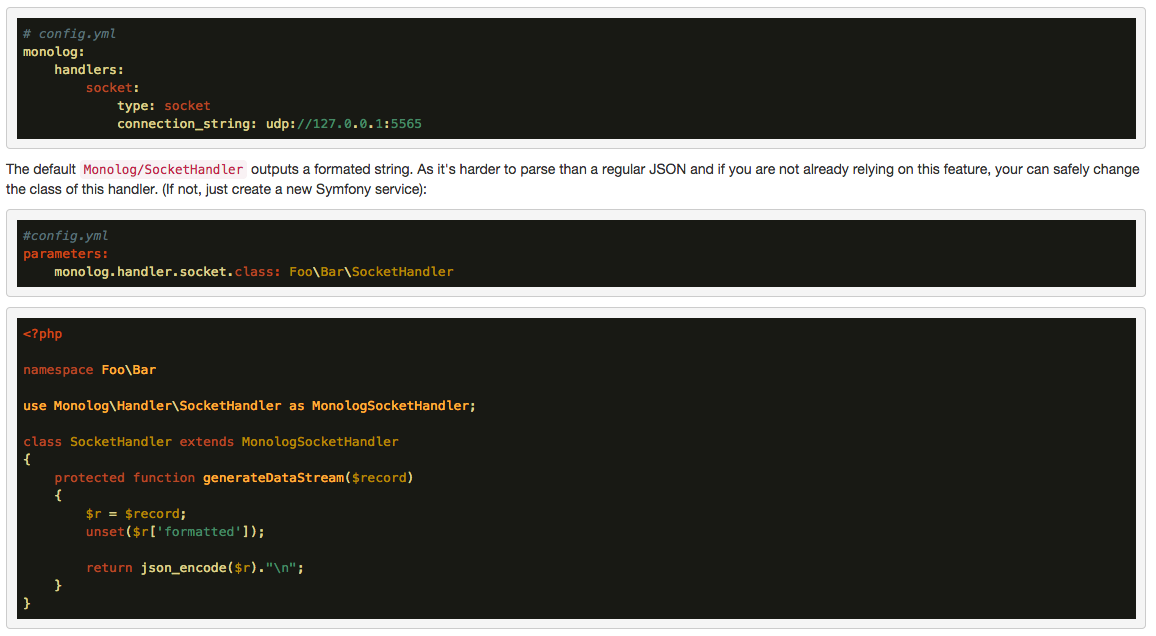
UDP
Download heka in github : Here
Sample of init.d file : Here
Ansible role : Here
Usefull Links
TomL language : Here
https://github.com/AbdoulNdiaye
abdoul.nd@gmail.com
By Abdoul N'Diaye
Web applications have more and more complexity that needs lots of data about our environment. Monitoring, metrics, aggregation, stats... We use a lot of things to monitor application. Heka is an open source stream processing software system developed by Mozilla who centralise all our logs. We will see how we use it in a Symfony application and how heka can centralise the management of your data in one tool.