Data & Creativity
Berghs School of Communication 2018
Anders Åberg
I like to build silly things just for fun

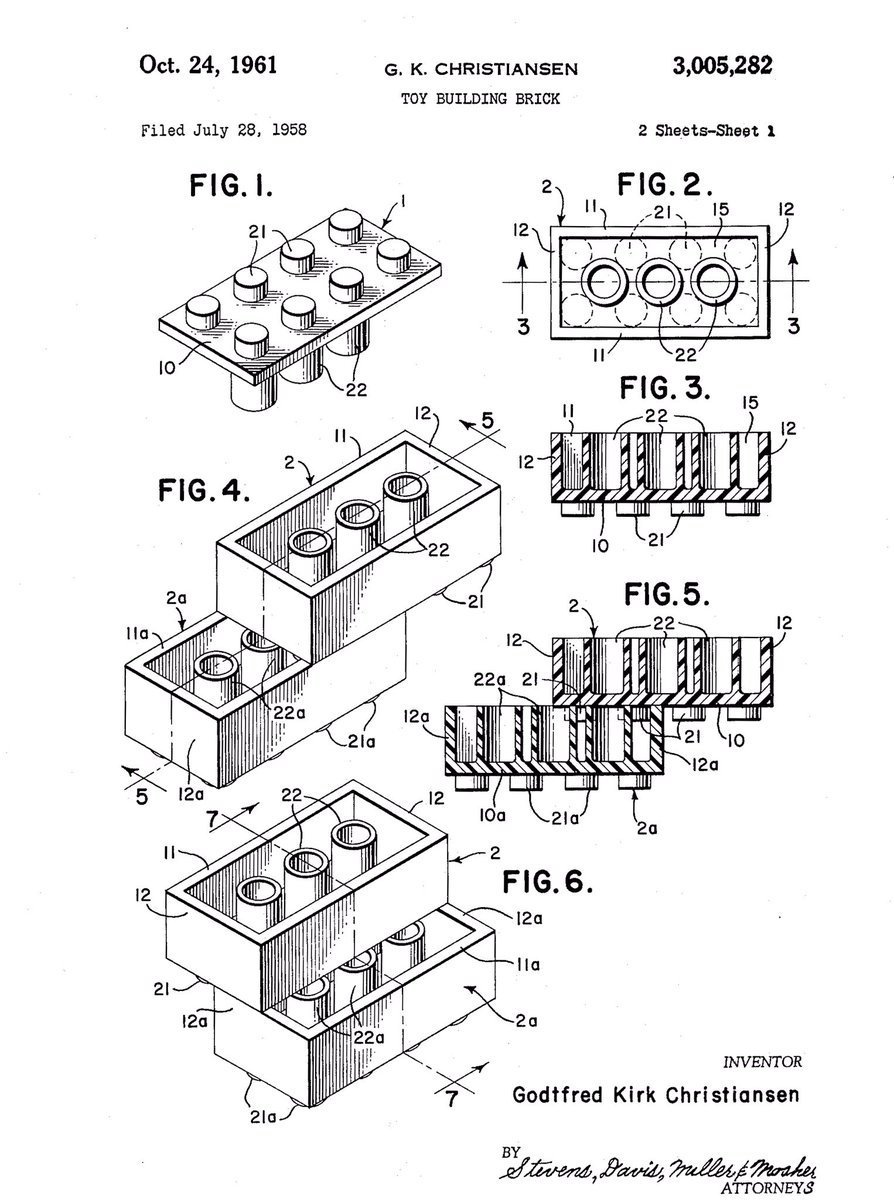
The internet is Lego...
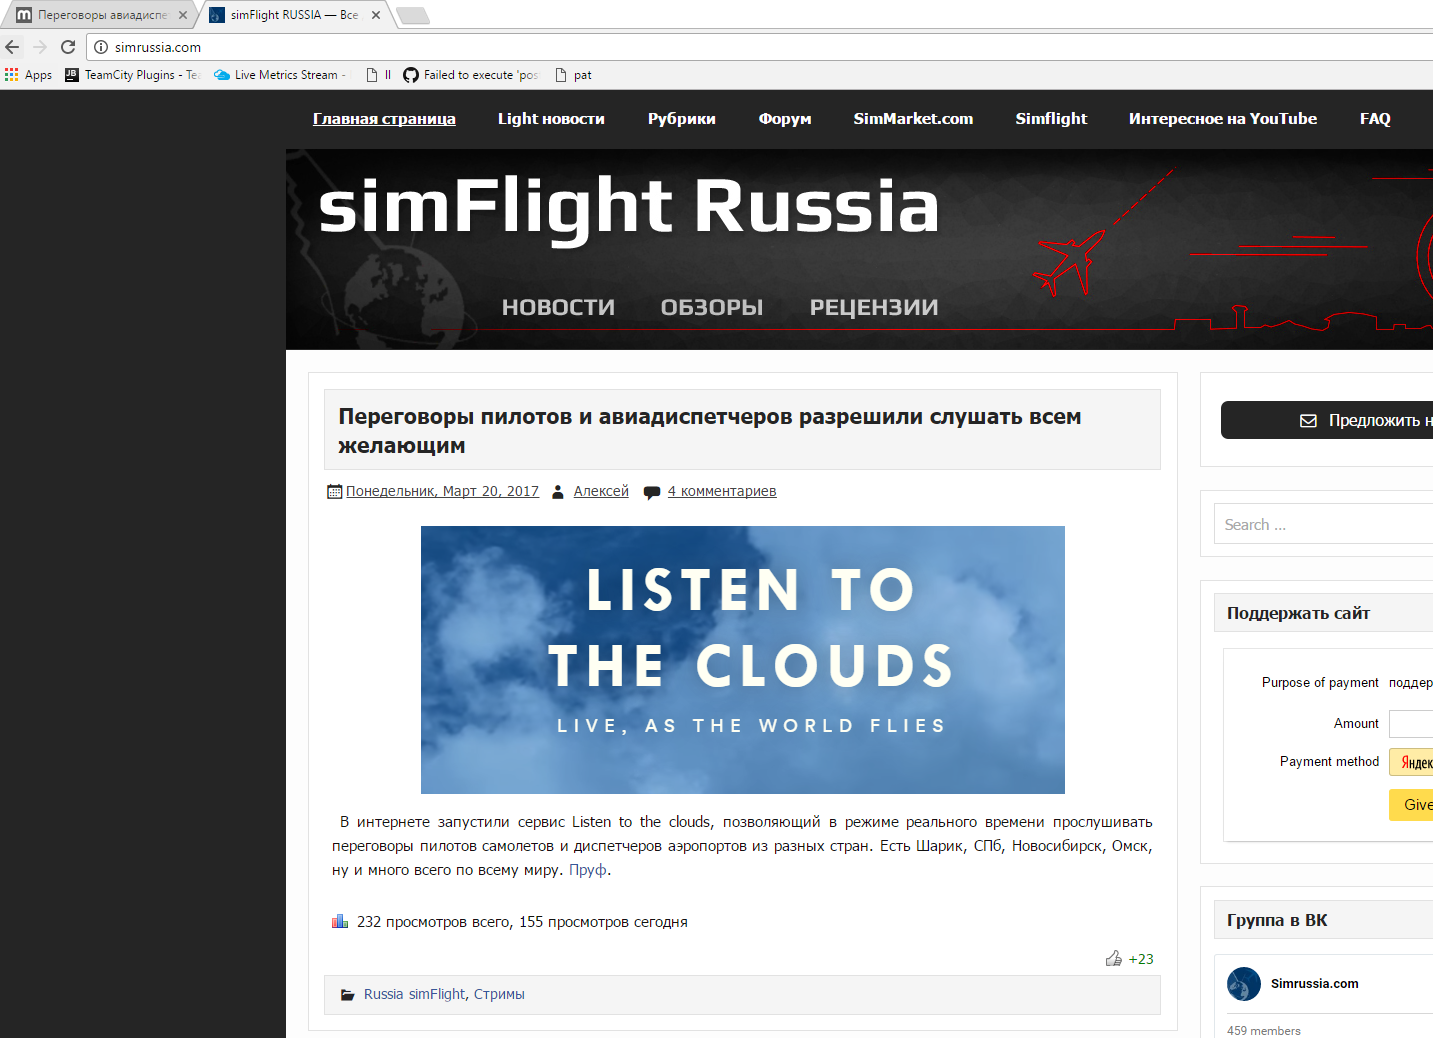
Listen To The Clouds
Experiment
+

System 1
System 2
= ???
= www.listentothe.cloud
"Live streaming the world of traveling"
Demo!
The result?
40 million streams
~ 42 sold out concerts in Globen
Back to the basics
What is a system?
System
- A set of things working together as parts of a mechanism or an interconnecting network; a complex whole.
- A set of principles or procedures according to which something is done; an organized scheme or method.
(Oxford English Dictionary)
- A set of things working together as parts of a mechanism or an interconnecting network; a complex whole.
API
System 1
System 2
?
2. "A set of principles or procedures according to which something is done; an organized scheme or method."
API
Allows you to get data and/or control a system
How to google for APIs:
"facebook api"
"spotify api"
"fitbit api"
"google maps api"
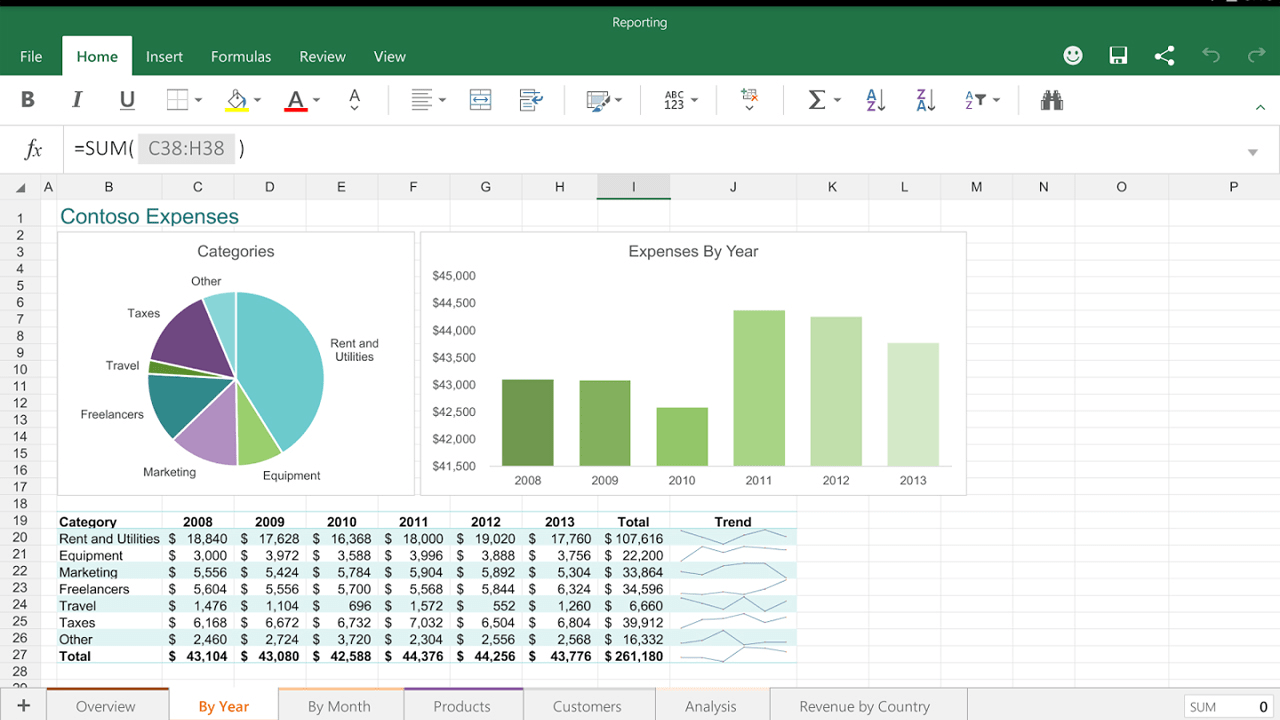
What is data?
Brief: SL
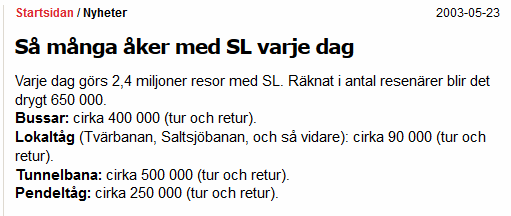
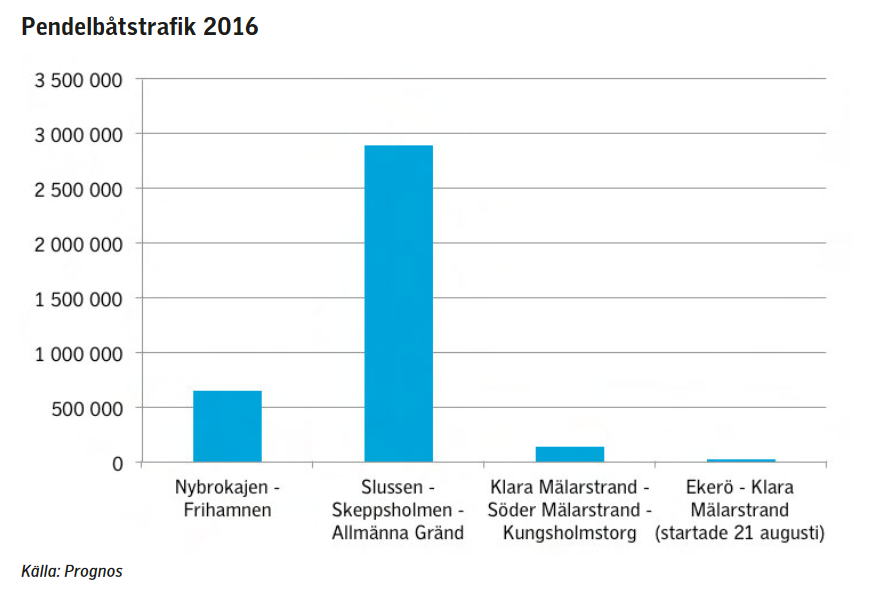
The Sound of Public Transport
Experiment
API
SL's bussar och tunnelbana
Ett digitalt piano
API
Google Maps
Demo!
Practical tips
- Data is a good tool when combined with a story
- Always (really always) include linkable sources
- Static and Interactive visualizations
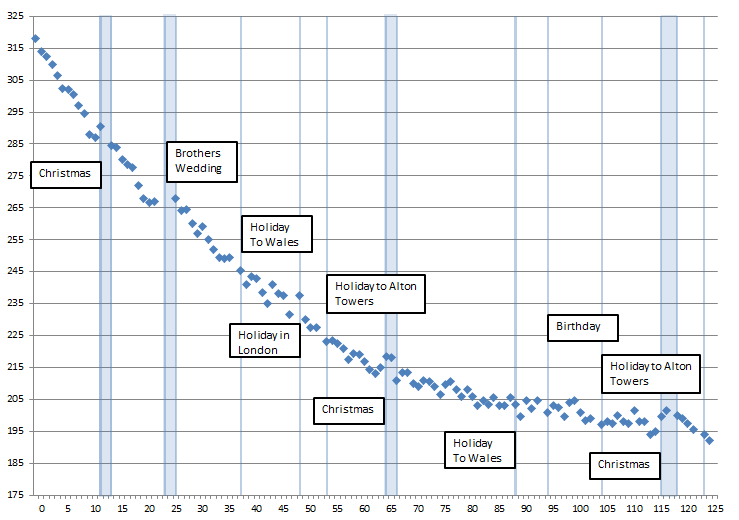
1. "My weight loss over 126 weeks"
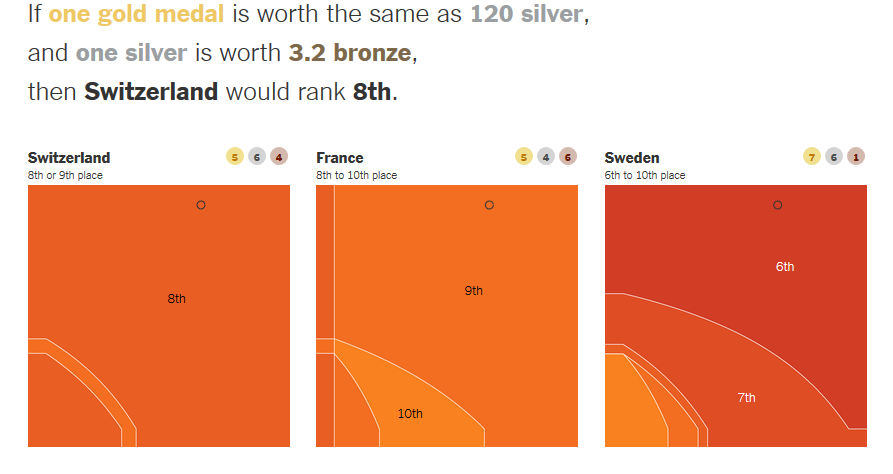
2. Who's winning the olympics?
https://www.nytimes.com/interactive/2018/02/14/upshot/which-country-leads-in-the-olympic-medal-count.html
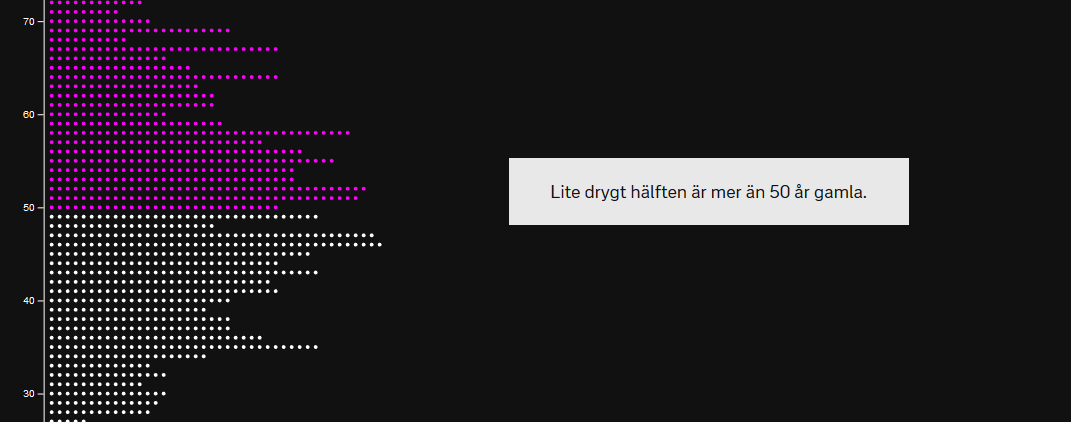
3. Paradisläckan, SVT
https://www.svt.se/special/svenskarna-i-paradislackan/
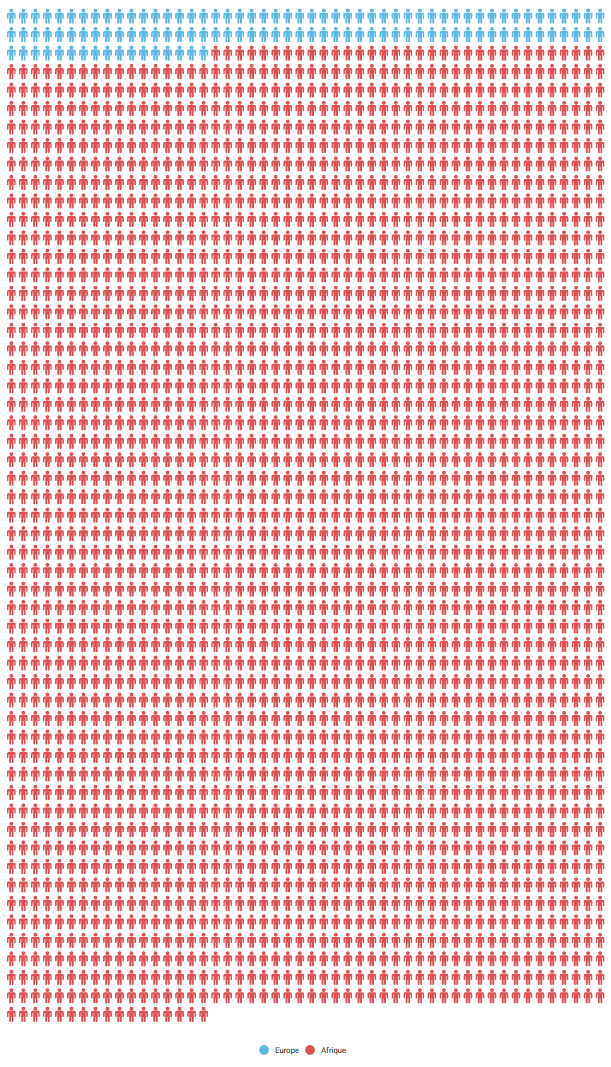
4. Europe vs Africa
http://www.rts.ch/info/monde/9016433-le-terrorisme-tue-vingt-fois-plus-en-afrique-qu-en-europe.html
5. A Day of Life in America
http://flowingdata.com/2015/12/15/a-day-in-the-life-of-americans/
6. "Facebook feed changes"
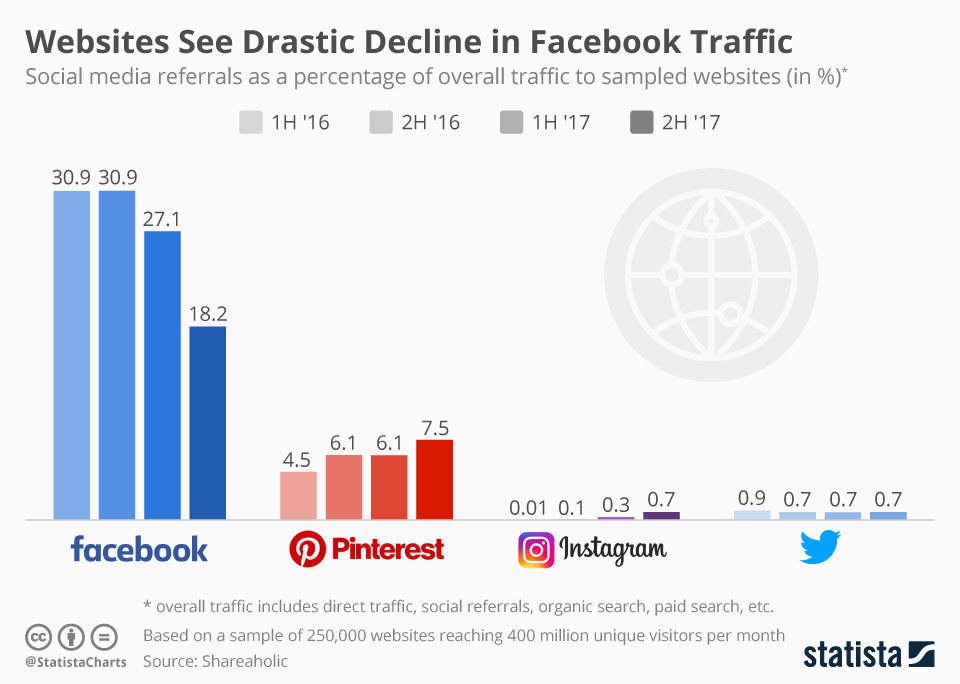
https://www.statista.com/chart/13018/social-media-traffic/
6. Dollar Street by Gapminder
https://www.gapminder.org/dollar-street/matrix
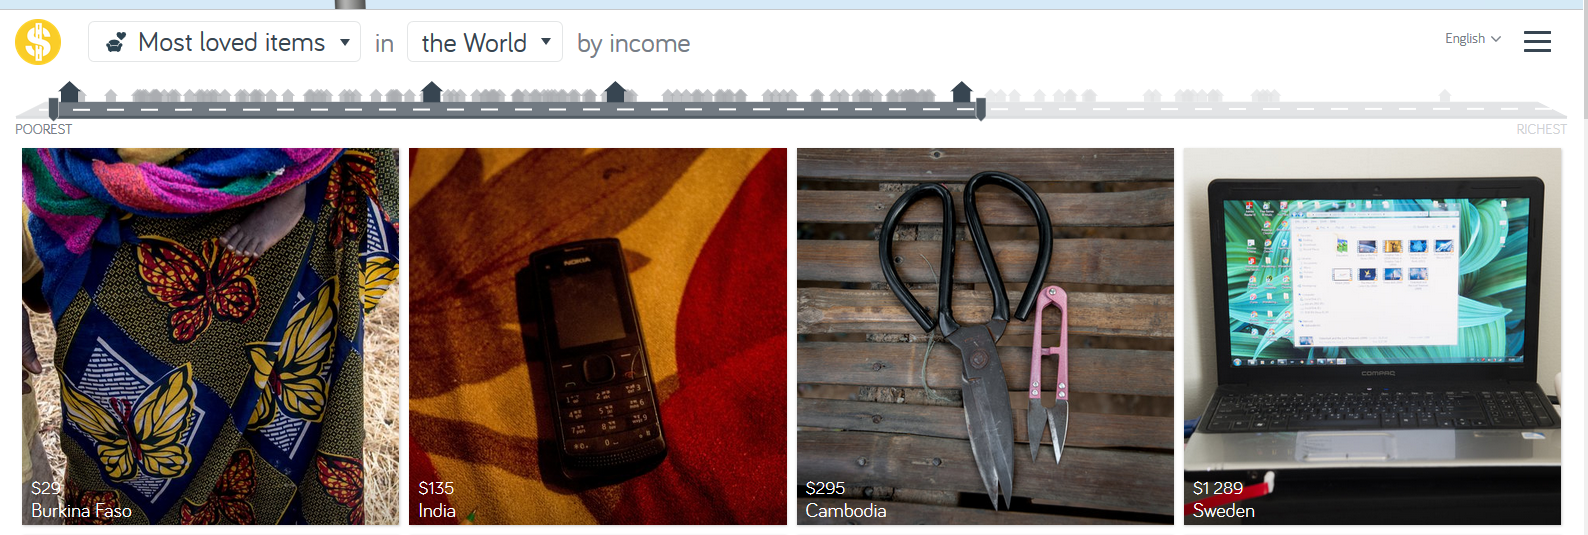
"- See how people really live"

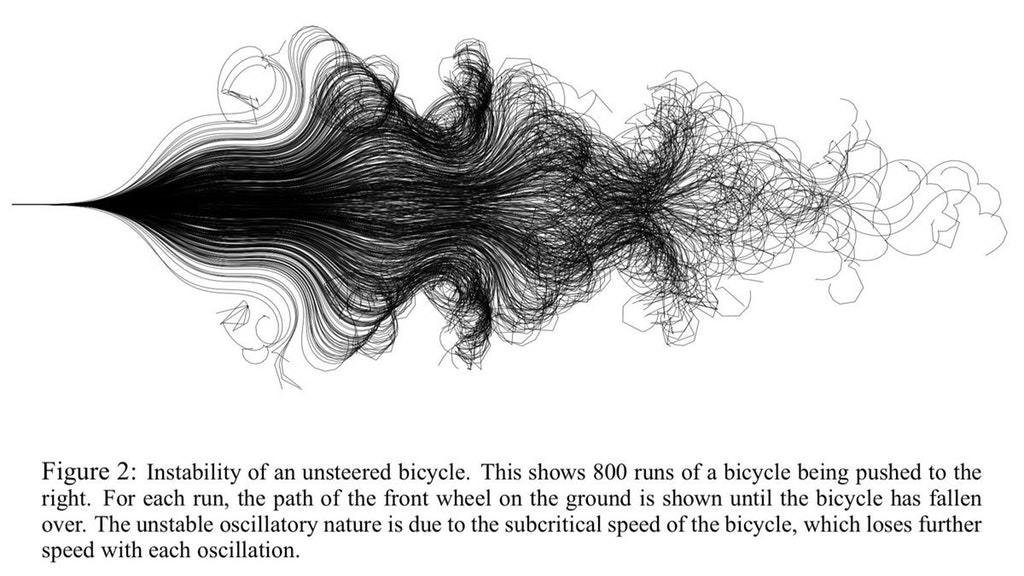
7. Vad tror ni det här ?
http://citeseerx.ist.psu.edu/viewdoc/download?doi=10.1.1.88.3781&rep=rep1&type=pdf
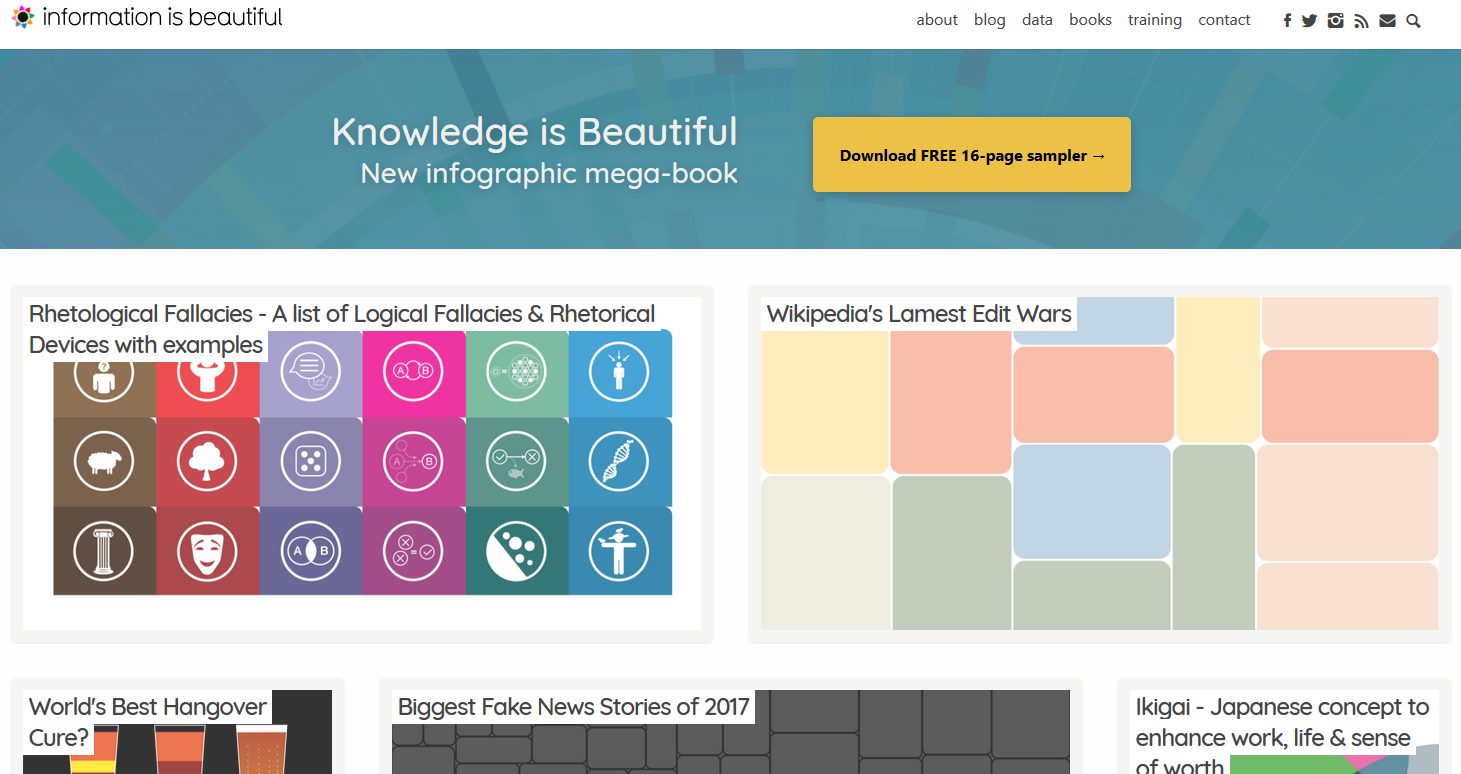
8. Information is beauitful
https://informationisbeautiful.net/
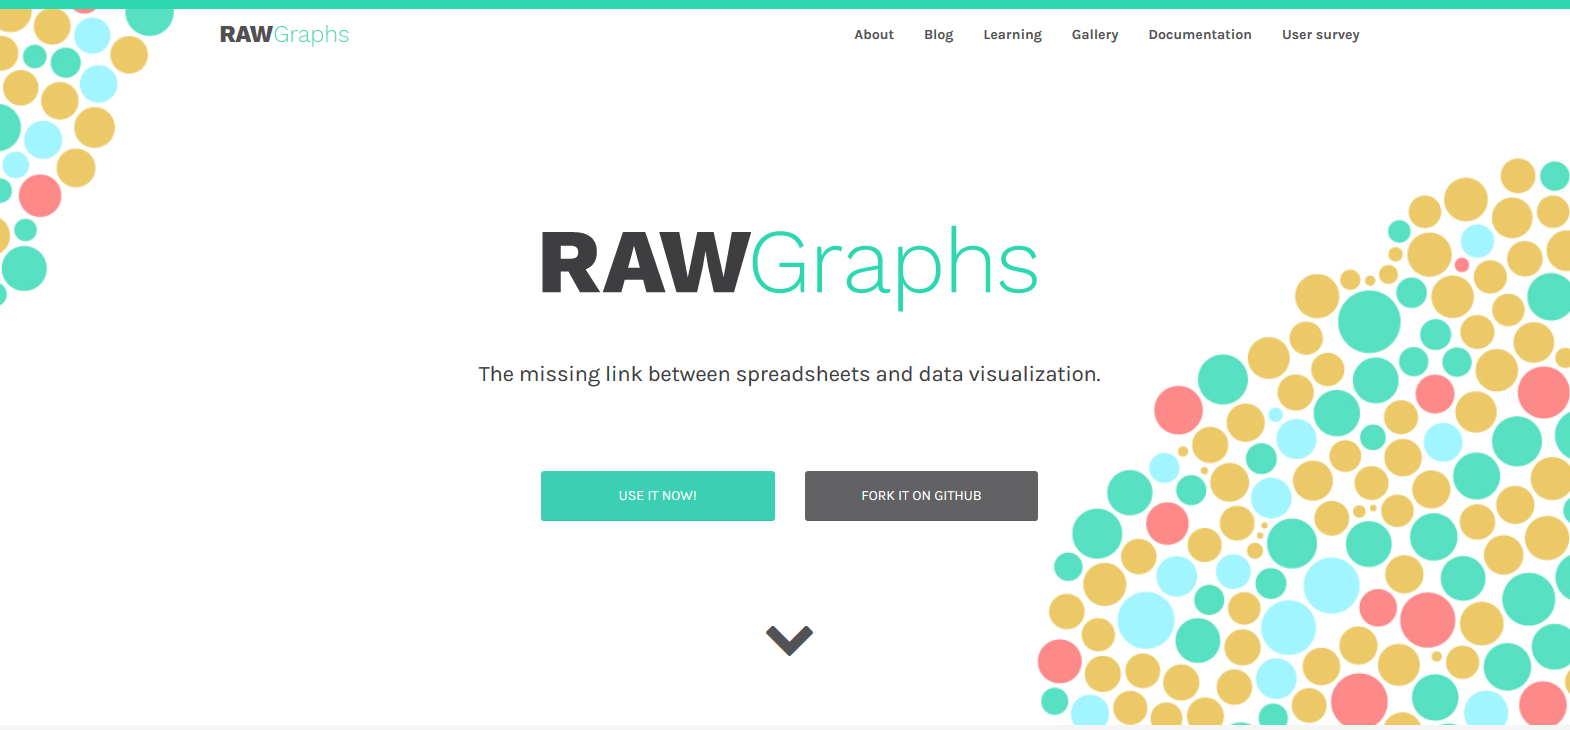
9. Create graphs from excel
https://rawgraphs.io/
Quick Recap
- Internet is like lego...
- Build silly things because it's fun
- Data can be a lot more than boring numbers
- Data + Creativity > Creativity
- You will get the slides and all the links
Thanks for listening
Questions?
Anders Åberg - @andersaberg
Extra: Idea Workshop
Google Maps
Wikipedia
Spotify
Smartphone
- Gyroscope
- Accelerometer
- Light Sensor
- Compass
- Step Counter
Pick 2. What concepts could you make by connecting them?
deck
By abergs


