


Ahmad Nassri
Advocate of all things open-source. Founder at Tech Masters, Mentor at Node School Toronto, Director at Full Stack Toronto, Director at Open API Initiative, Editor at The RESTful Web.
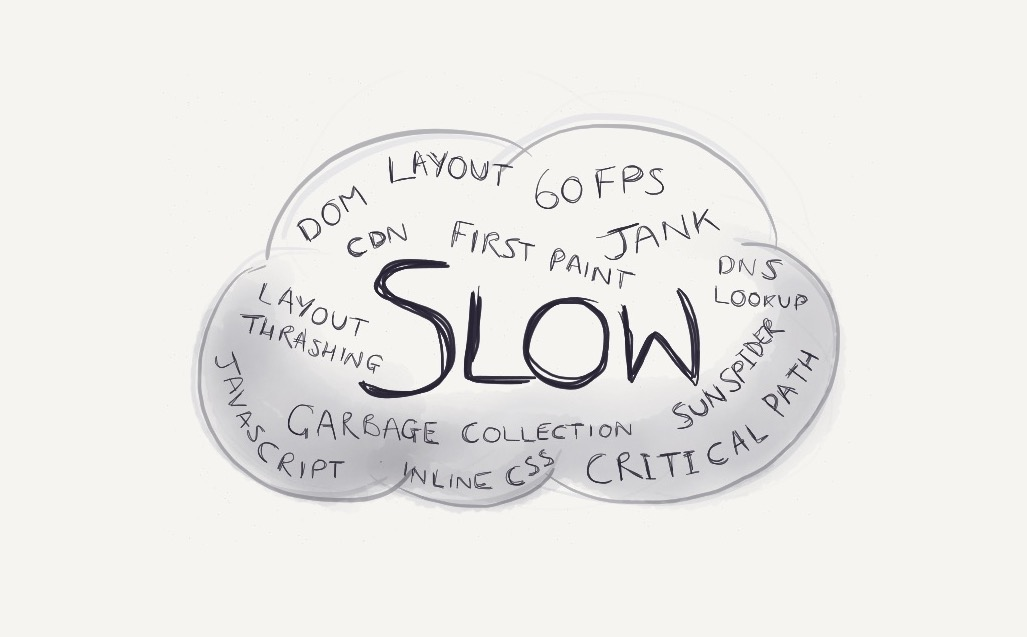
Benchmarking & Optimization for fun and profit!!
@AhmadNassri
http://ahmad.codes
Principal Architect at TELUS Digital, Founder at Bench CI, Founder at Tech Masters, Mentor at Node School Toronto, Board Member at Full Stack Toronto, Organizer at Functions Conf, Editor at The RESTful Web.
Tech Outlaw, Wanted by a third-world dictator
(true story)
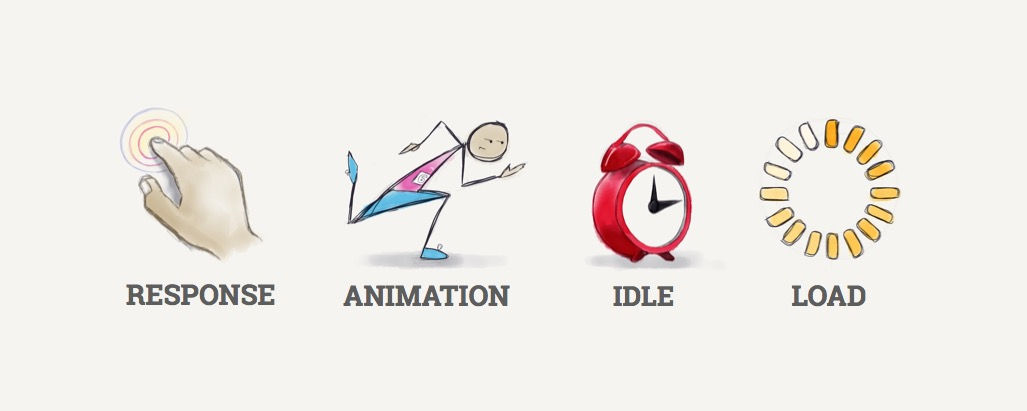
RAIL: A User-Centric Model For Performance
Consider a system that processes CAD GBP transactions
Throughput of 1 Billion CAD GBP worth of transactions per minute
You are the best coder in the world, but you're not perfect
Your error rate is 0.1%
A single bug could cost the company millions, but it's detectable
Performance degradation could cost billions!
Not easily detectable
Code quality is not enough, keep track of performance and efficient resource usage.
Memory capacity & CPU cycles are precious in resource constrained environments
Ensure your software operates on and within any hardware & resource constraints.
&
Discover optimizations that could impact the largest number of users
$ time for a in {1..10}; do node index.js; done

real    0m13.042s
user    0m0.021s
sys 0m0.044shttps://benchmarkjs.com
new Benchmark.Suite()
  .add({
    name: 'JSON.parse',
    fn: () => JSON.parse(json)
  })

  .add({
    name: 'jju',
    fn: () => jju.parse(json)
  })

  ...

  .add({
    name: 'vuvuzela',
    fn: () => vuvuzela.parse(json)
  })

.run() clarinet x 2,636 ops/sec ±2.13% (78 runs sampled)
JSON.parse x 80,639 ops/sec ±2.14% (88 runs sampled)
jju x 7,343 ops/sec ±3.12% (84 runs sampled)
jsonparse x 10,719 ops/sec ±4.54% (45 runs sampled)
json-parse-stream x 2,039 ops/sec ±6.39% (69 runs sampled)
stream-json x 1,775 ops/sec ±1.14% (82 runs sampled)
vuvuzela x 15,644 ops/sec ±4.07% (87 runs sampled)app.get('/auth', function (req, res) {
const username = req.query.username || ''
const password = req.query.password || ''
username = username.replace(/[!@#$%^&*]/g, '')
if (!username || !password || !users[username]) {
return res.sendStatus(400)
}
const hash = crypto.pbkdf2Sync(password, users[username].salt, 10000, 512)
if (users[username].hash.toString() === hash.toString()) {
res.sendStatus(200)
} else {
res.sendStatus(401)
}
})[Summary]:
ticks total nonlib name
79 0.2% 0.2% JavaScript
36703 97.2% 99.2% C++
7 0.0% 0.0% GC
767 2.0% Shared libraries
215 0.6% Unaccounted$ node --prof ./app.js
$ node --prof-process ./log-file [C++]:
ticks total nonlib name
19557 51.8% 52.9% node::crypto::PBKDF2(v8::FunctionCallbackInfo<v8::Value> const&)
4510 11.9% 12.2% _sha1_block_data_order
3165 8.4% 8.6% _malloc_zone_malloc [Bottom up (heavy) profile]
ticks parent name
19557 51.8% node::crypto::PBKDF2(v8::FunctionCallbackInfo<v8::Value> const&)
19557 100.0% v8::internal::Builtins::~Builtins()
19557 100.0% LazyCompile: ~pbkdf2 crypto.js:557:16
4510 11.9% _sha1_block_data_order
4510 100.0% LazyCompile: *pbkdf2 crypto.js:557:16
4510 100.0% LazyCompile: *exports.pbkdf2Sync crypto.js:552:30
3165 8.4% _malloc_zone_malloc
3161 99.9% LazyCompile: *pbkdf2 crypto.js:557:16
3161 100.0% LazyCompile: *exports.pbkdf2Sync crypto.js:552:30app.get('/auth', function (req, res) {
const username = req.query.username || ''
const password = req.query.password || ''
username = username.replace(/[!@#$%^&*]/g, '')
if (!username || !password || !users[username]) {
return res.sendStatus(400);
}
crypto.pbkdf2(password, users[username].salt, 10000, 512, function (err, hash) {
if (users[username].hash.toString() === hash.toString()) {
res.sendStatus(200)
} else {
res.sendStatus(401)
}
})
})@AhmadNassri
http://ahmad.codes
Slides & Links:
ahmad.codes/talks
TechMasters.chat
Functions.world
FSTO.co
By Ahmad Nassri
Benchmarking & Optimization for fun and profit