Modelling the spread of Covid-19 in the UK

June Dalziel Almeida
JUNE
Christoph Becker, Richard Bower, Joseph Bullock*, Tristan Caulfield, Carolina Cuesta-Lazaro*, Aoife Curran, Edward Elliott, Kevin Fong, Richard Hayes, Miguel Icaza-Lizaola, Frank Krauss, James Nightingale, Arnau Quera-Bofarull*, Aidan Sedgewick, Henry Truong, Ian Vernon*, and Julian Willams
* speakers
- Creating a digital twin of the UK (Arnau QB)
- Dynamics of the world (Joseph B)
- Modelling Covid-19 (Carol CL)
- Policies (Joseph B)
- Model fitting and results (Ian V)
- Visualizer demo (Carol CL)
Outline
Creating a digital twin of the UK
Setup
Geography
Demography
Population
Venues
- Households
- Companies
- Schools
- etc.
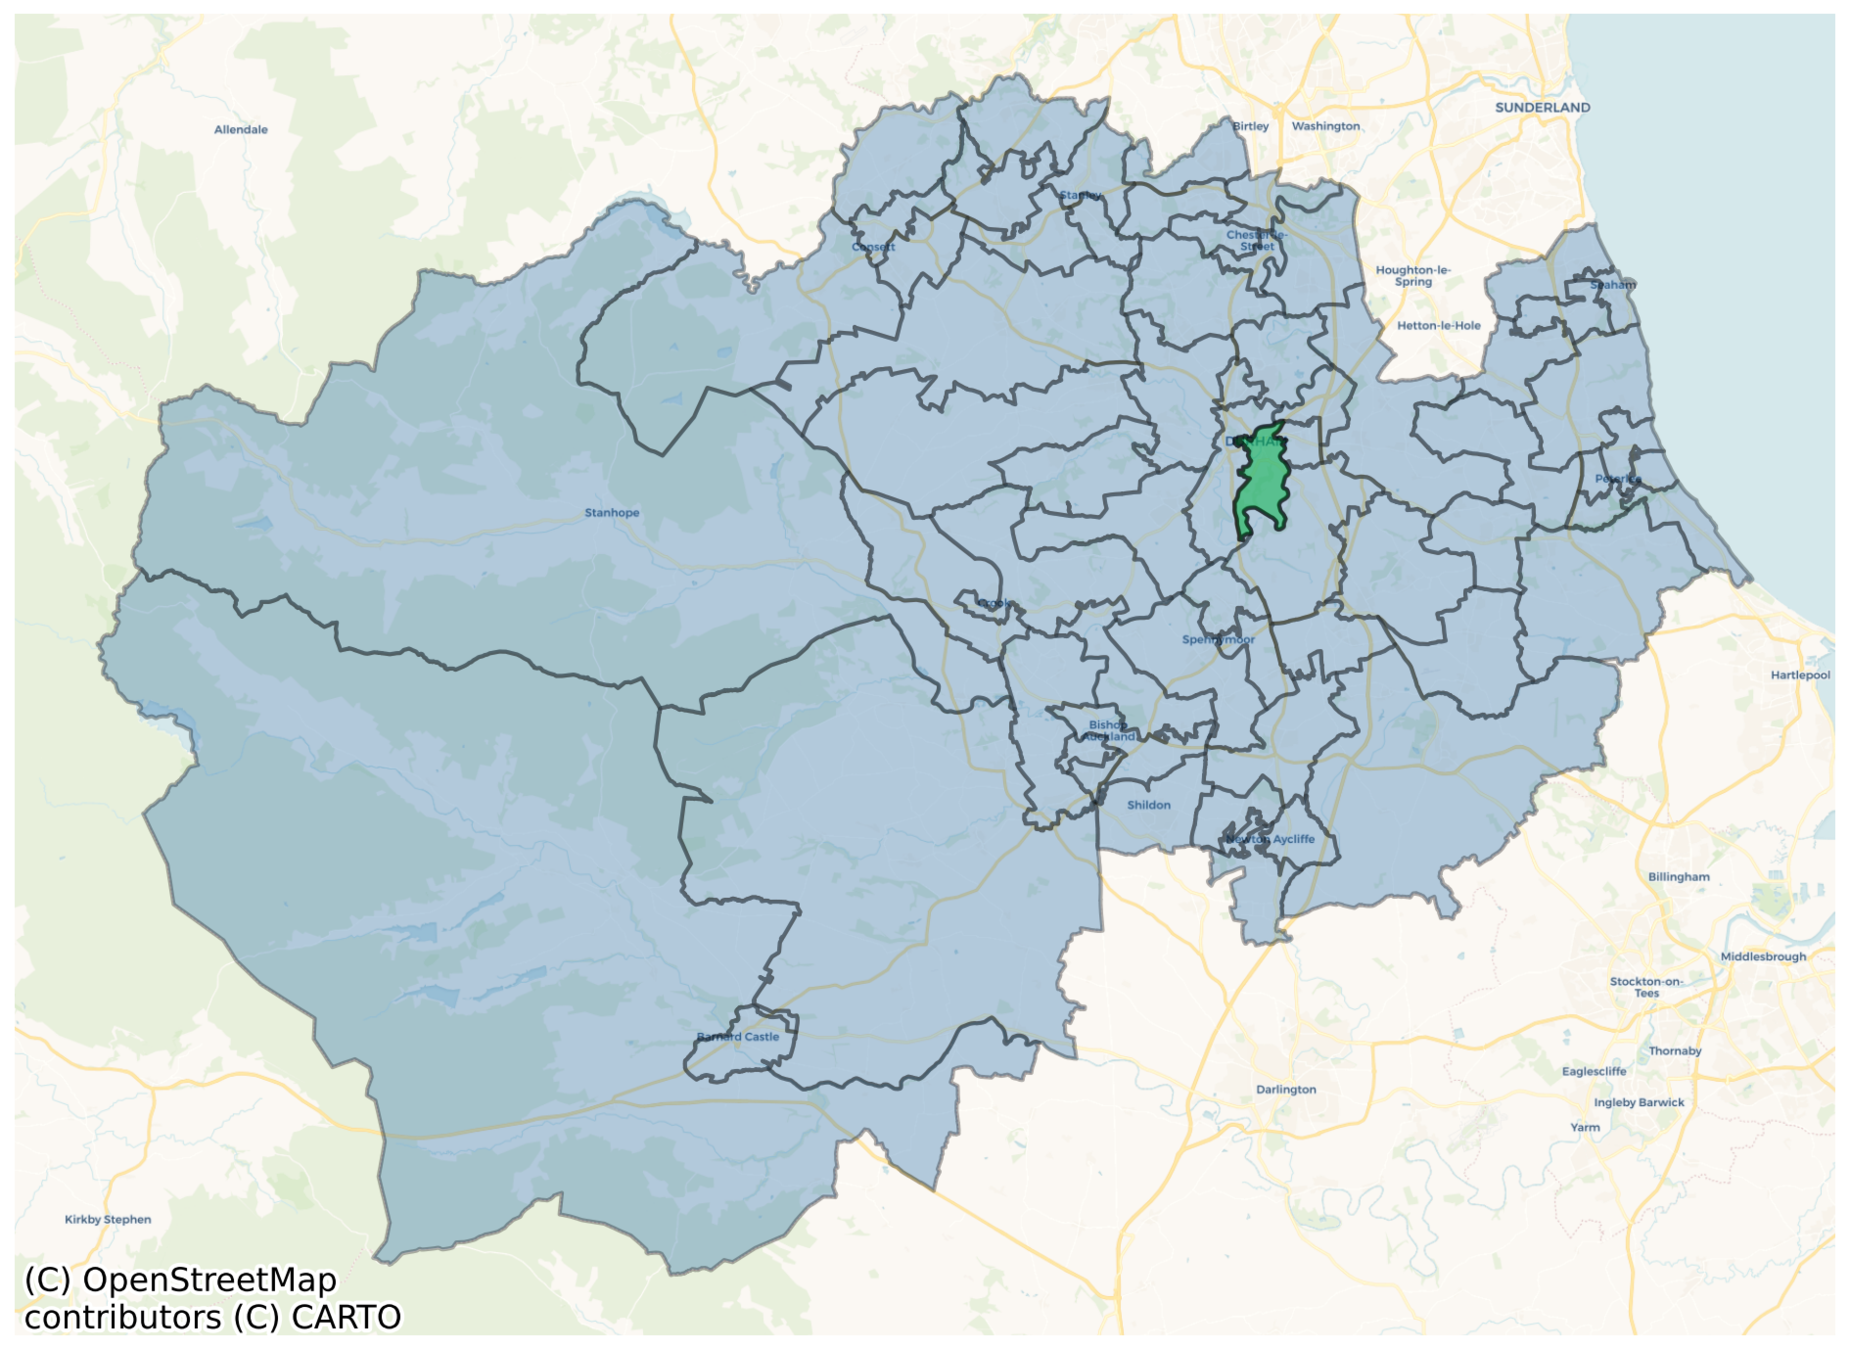
June's Geography
local authority districts
super area (MSOA)
area (OA)
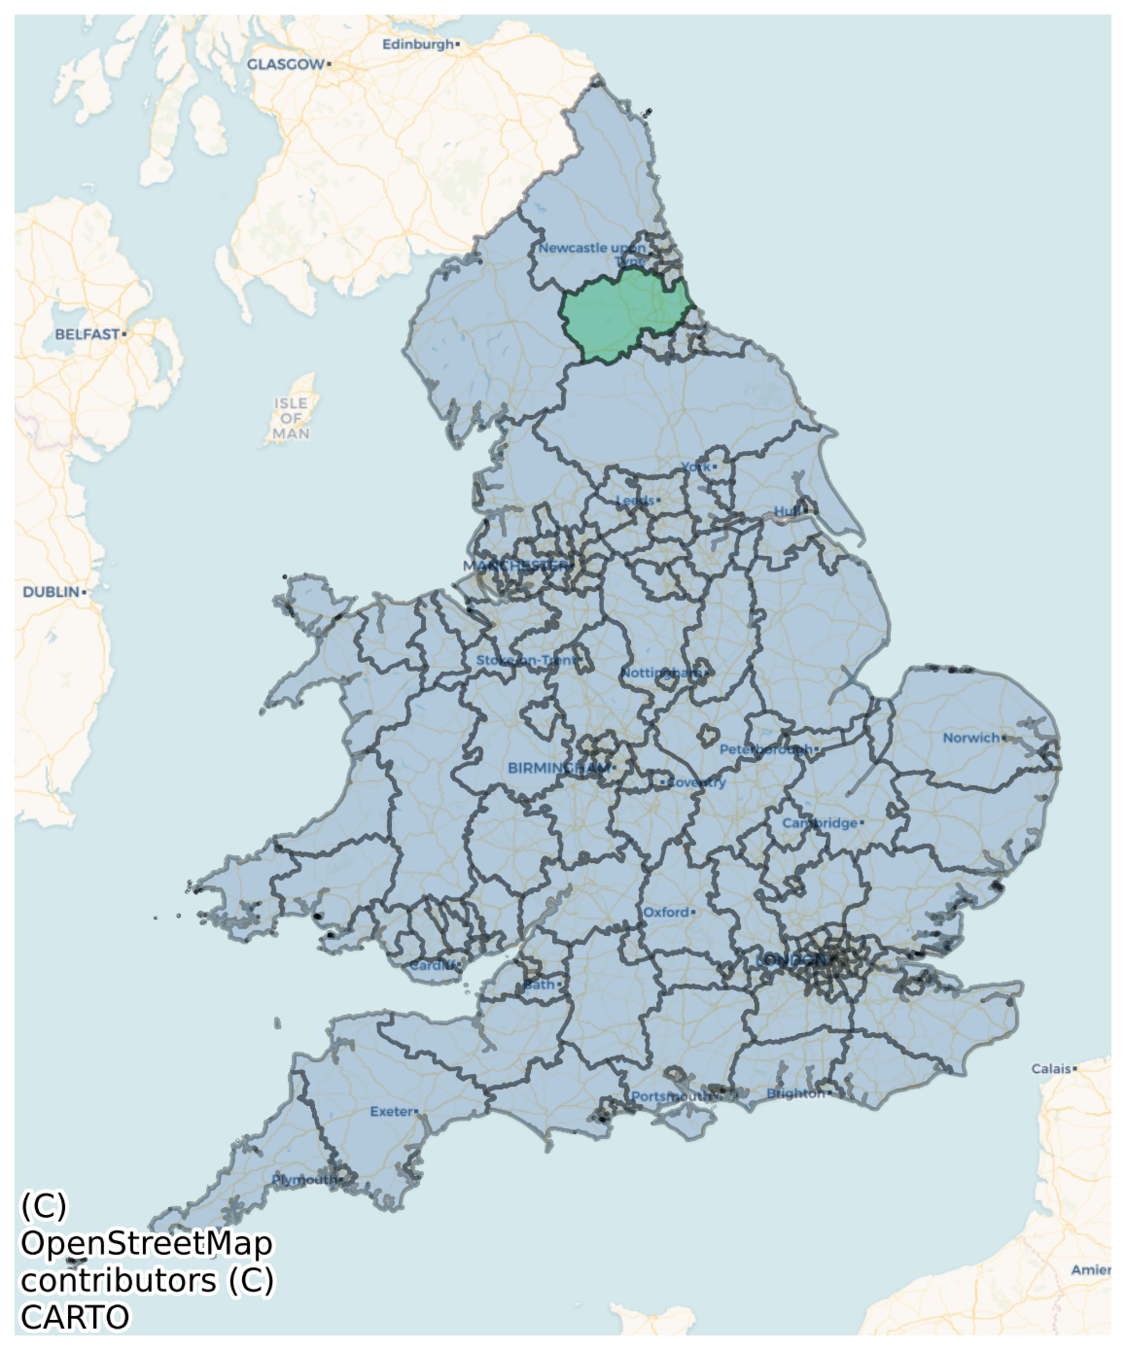
North East => 26,000 output areas
June's Demography
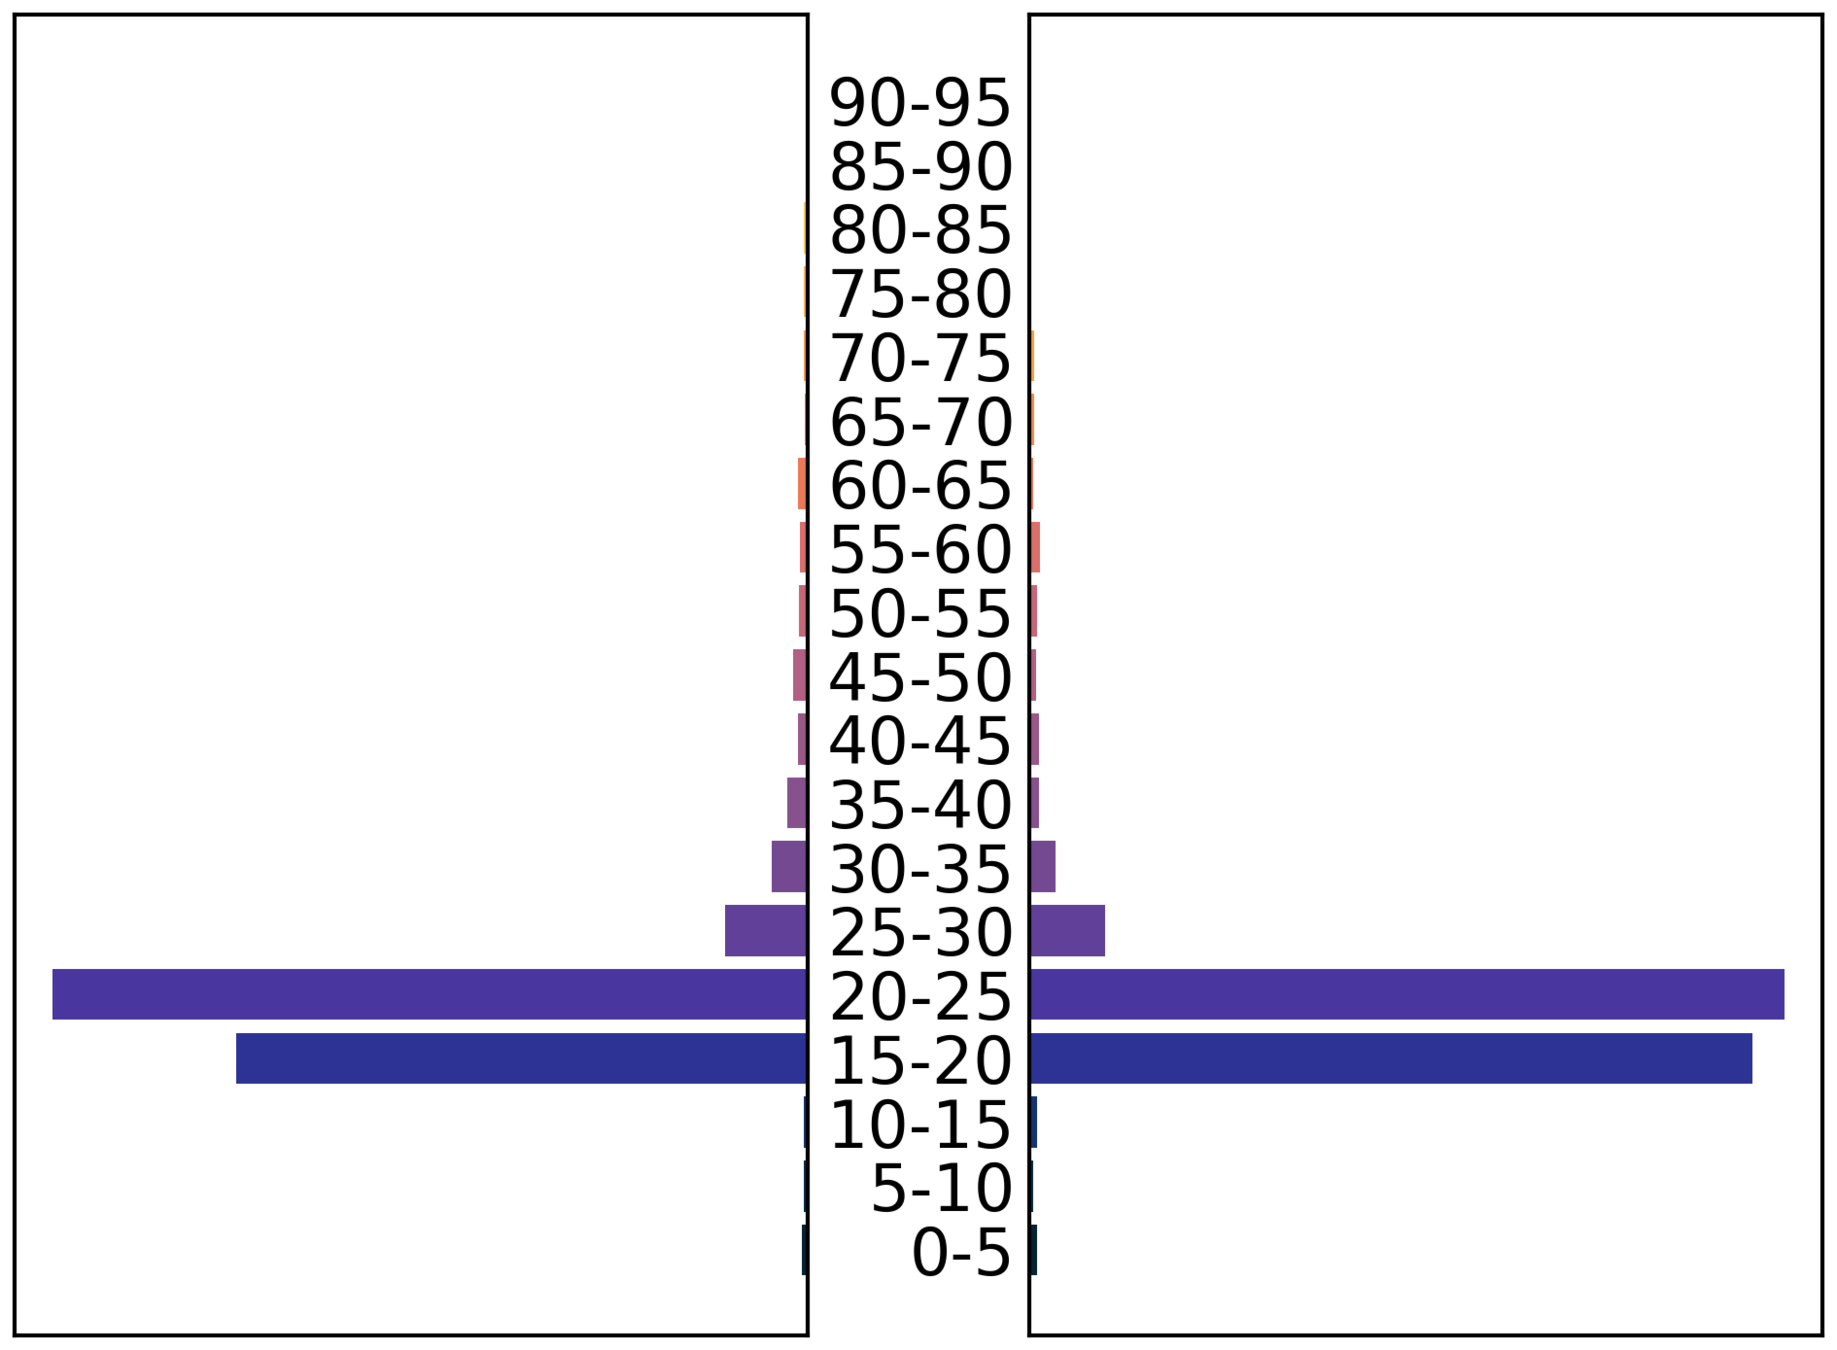
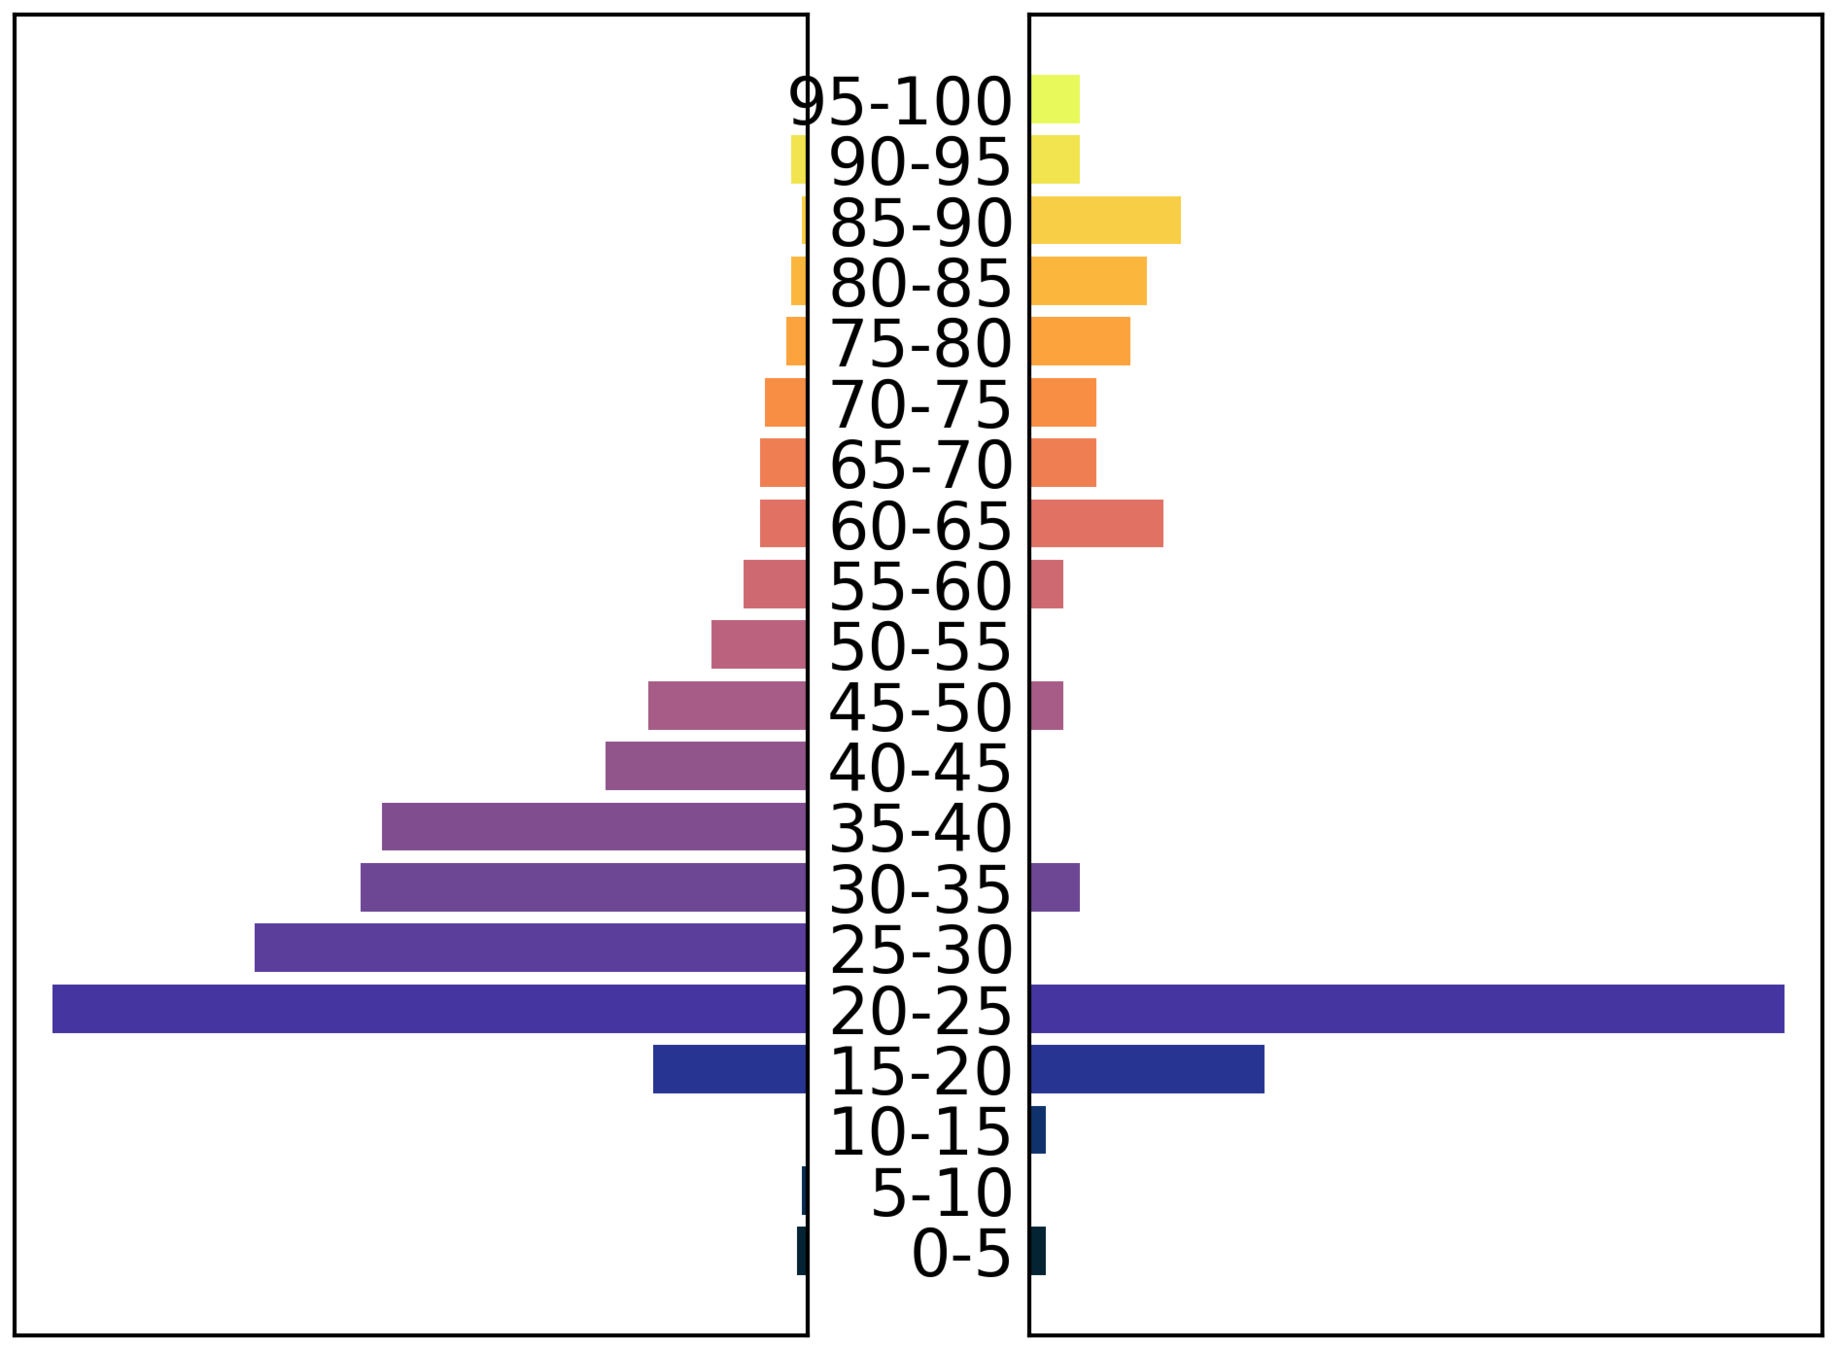
male
female
male
female
Demography
What defines a person in June?
- age (27)
- sex (f)
- ethnic group (Caribbean)
- deprivation index 2 (1-10)
- work sector / subsector (healthcare/doctor)
- mode of transport (public)
- area of residence
- super area of work

Main data source: census data (NOMIS)
Where can people be?
- Residence
- Care Home
- Household
-
Primary activity
- Company
- Hospital
- School
- Care Home
- University
-
Travel
- Commute
- National travel
-
Leisure
- Shopping
- Pubs / restaurants
- Cinema
Residence - Household
- Households based on census data.
area population
- number of households that contain at least one person over 65 years old.
- number of couples
- ....


16 different household compositions
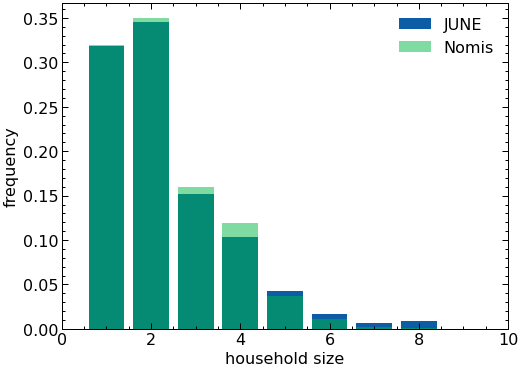
Residence - Household
Tests
North East
London
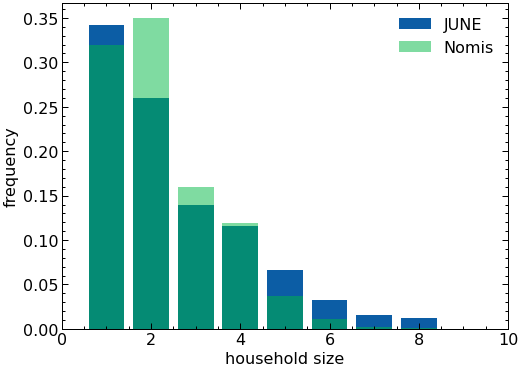
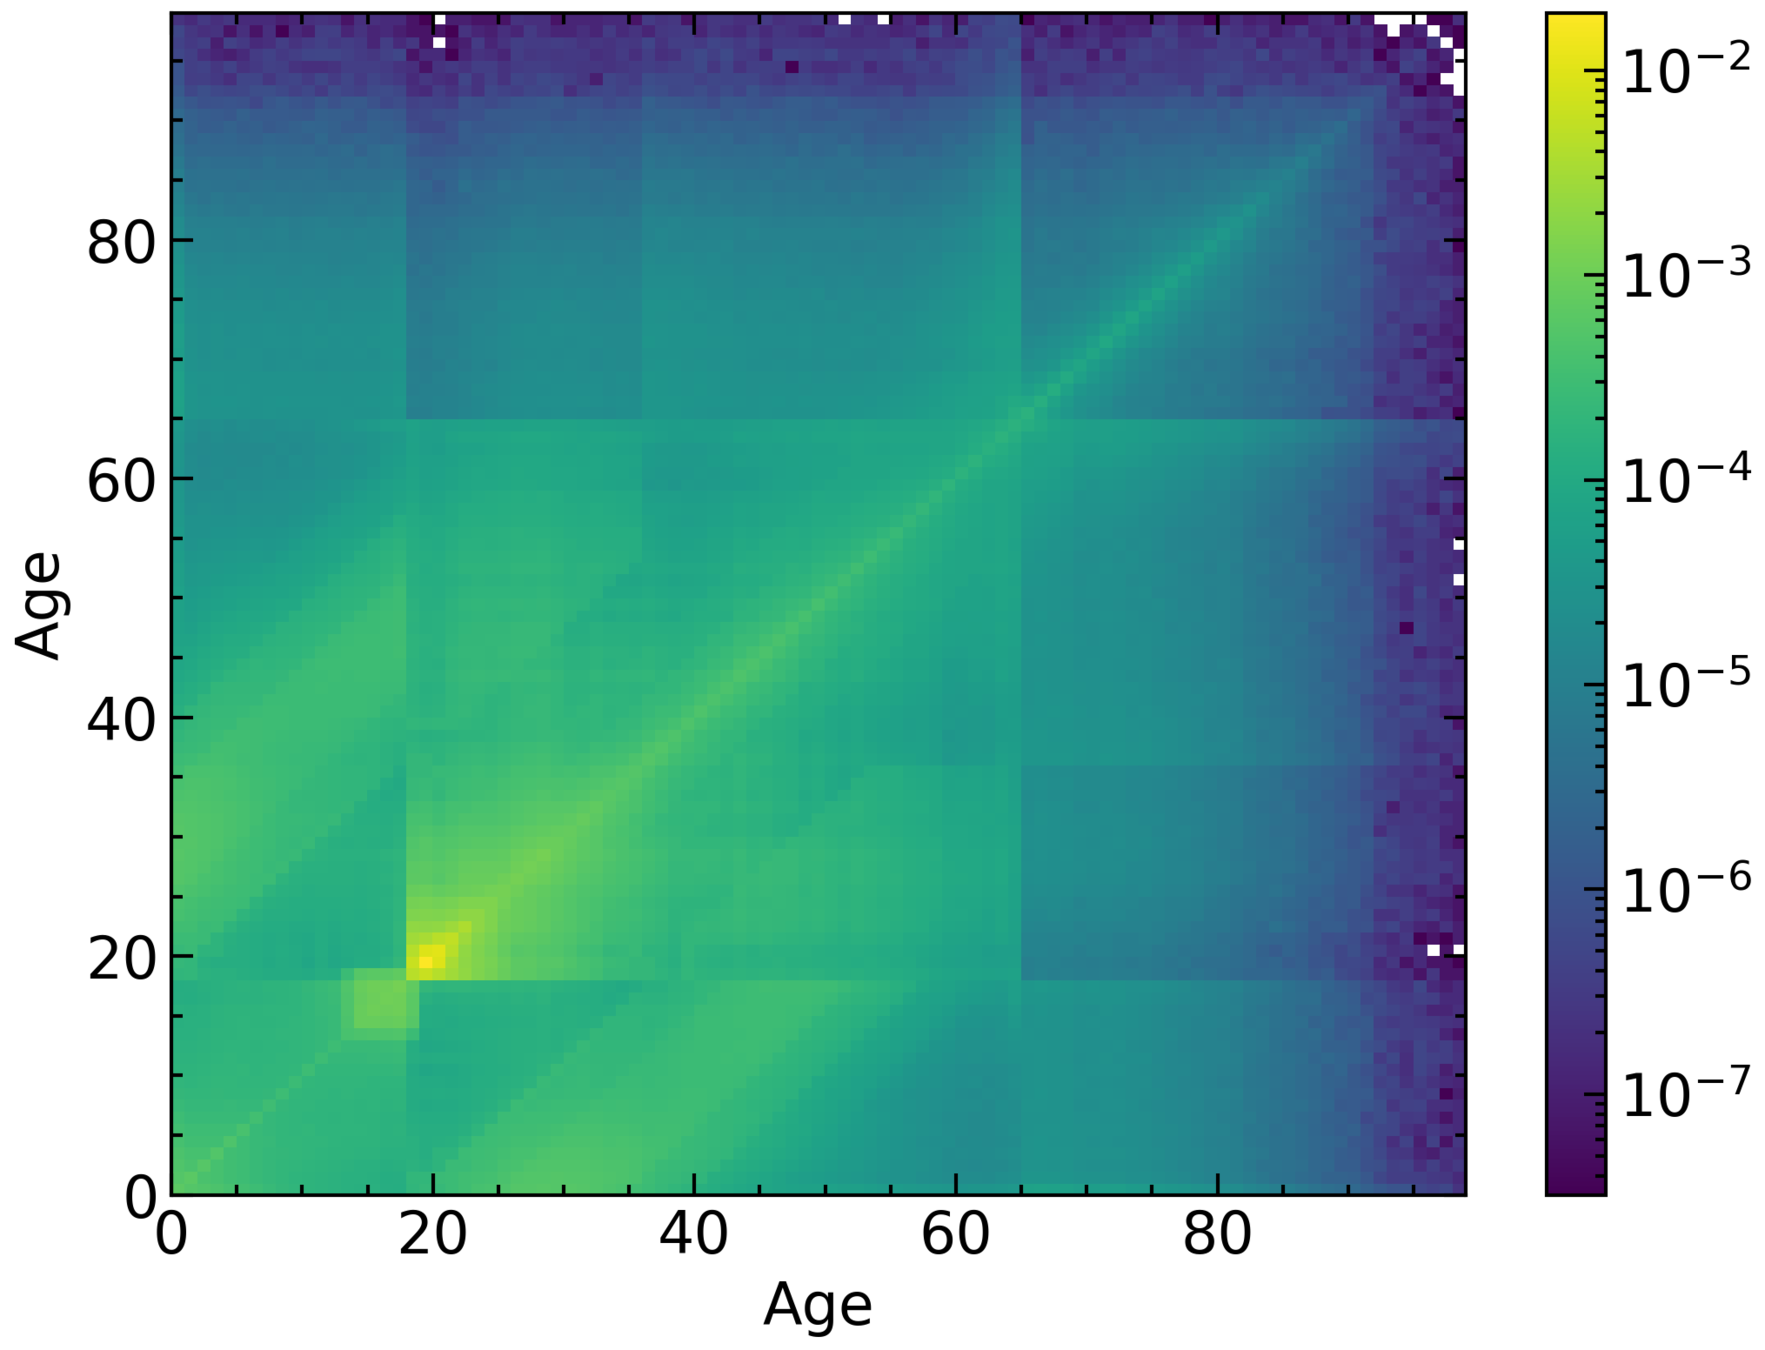
Residence - Household
Tests
Housemates matrix (London)
Probability
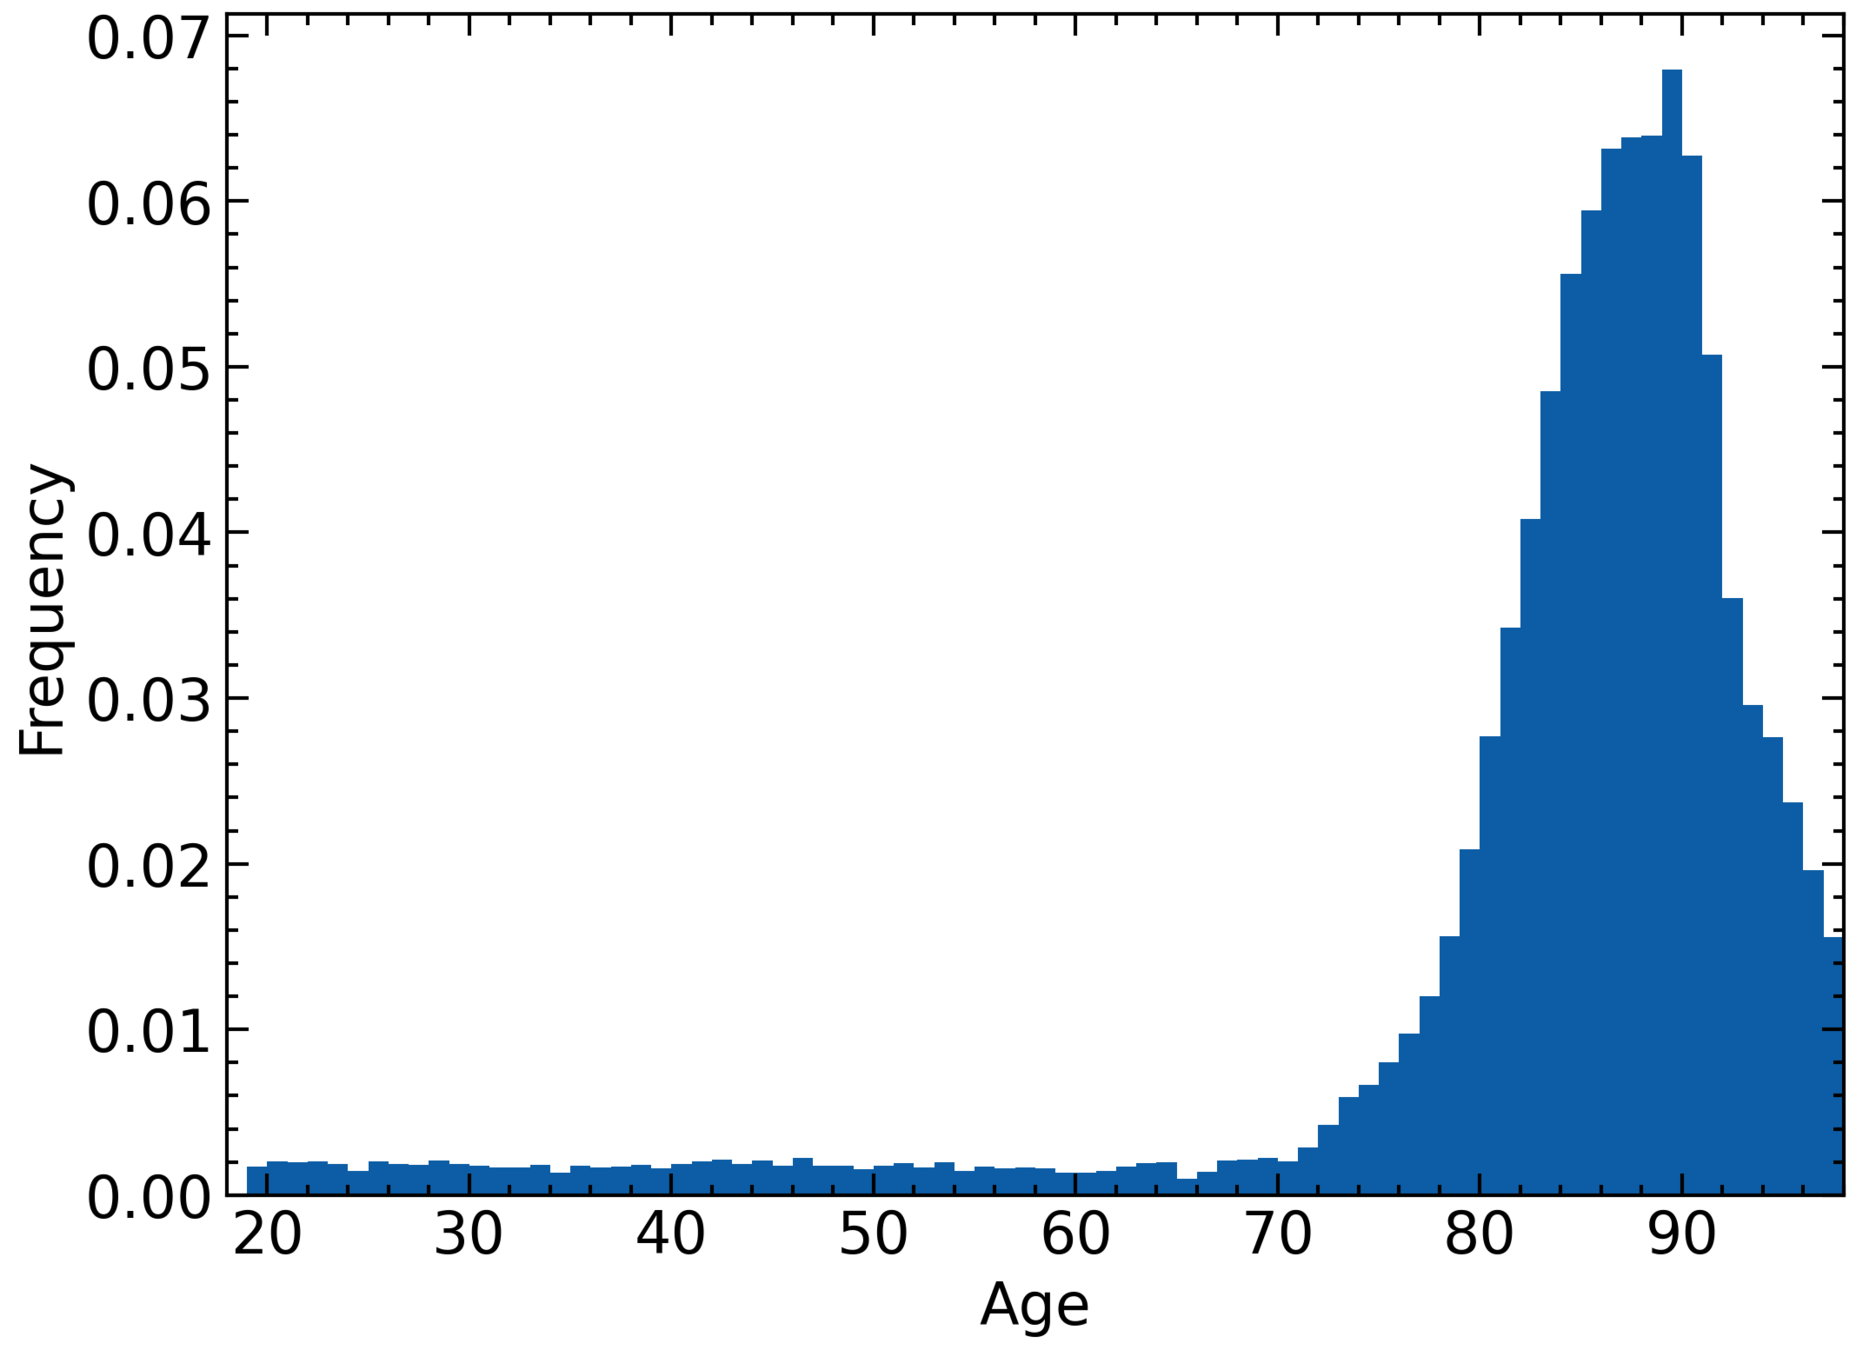
Residence - Care Home
- Each area can have up to one care home
- Location based on census data
- Three populations: residents, workers, and visitors
What can people do?
-
Residence
- Care Home
- Household
- Primary activity
- Company
- Hospital
- School
- Care Home
- University
-
Travel
- Commute
- National travel
-
Leisure
- Shopping
- Pubs / restaurants
- Cinema
Primary activity - School
Data on every school in England & Wales
- Age range
- Location (coordinates)
- Number of pupils
Assign each kid to the closest school that fits their age range.
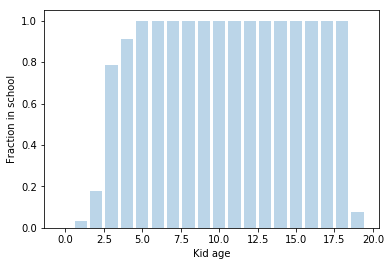
- Kids are subdivided into year groups
- We add teachers assuming constant ratio.
Primary activity - Workplace
- Idea: match residence area => work super area

Flow data
Durham, works in sector X
Newcastle, industry sector X
Sector info also used for medics and teachers.
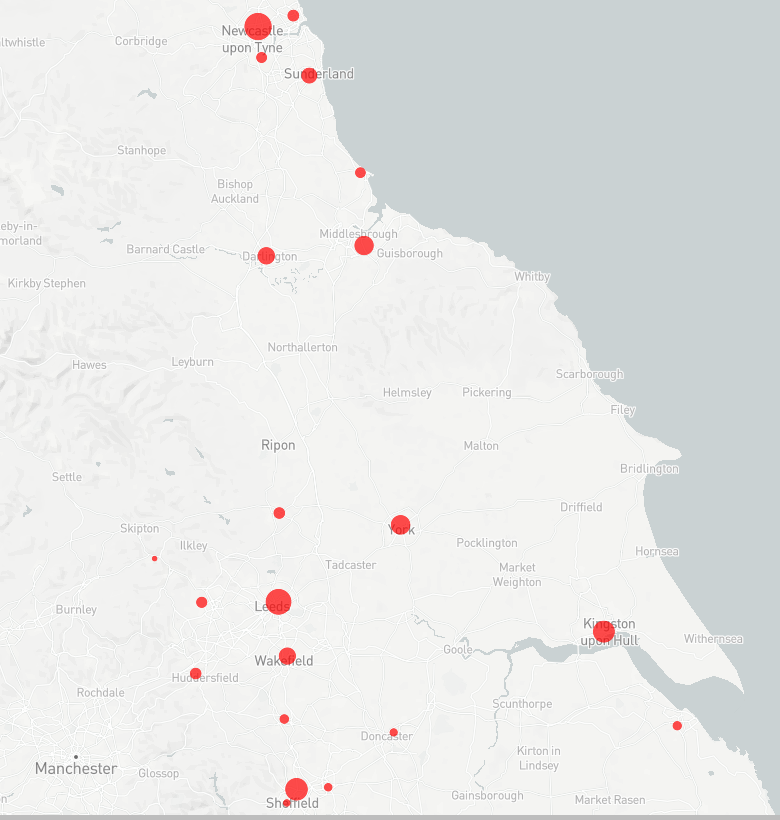
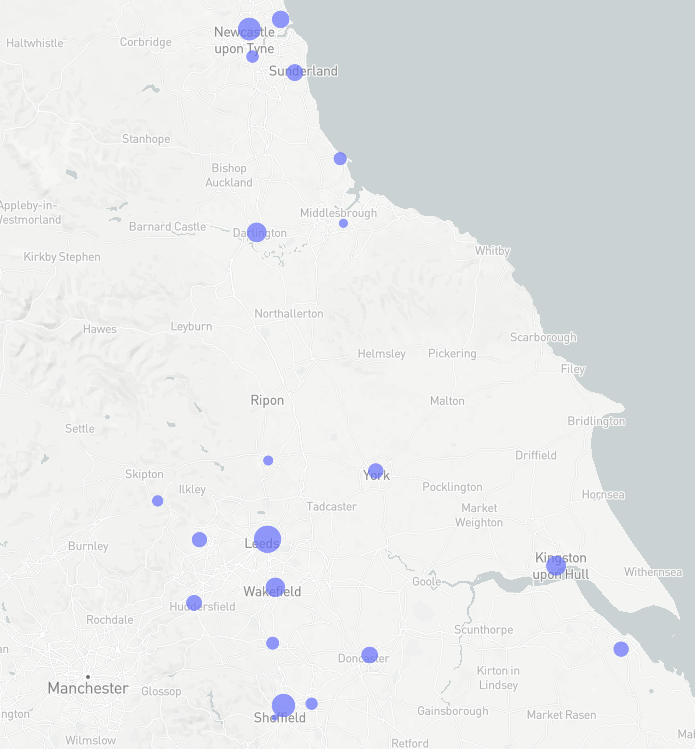
Workplace - Residence
City of London workers' usual residence
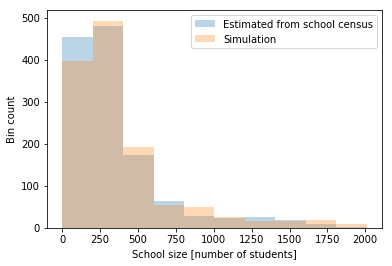
Workplace - Companies
Company size distribution taken from census data
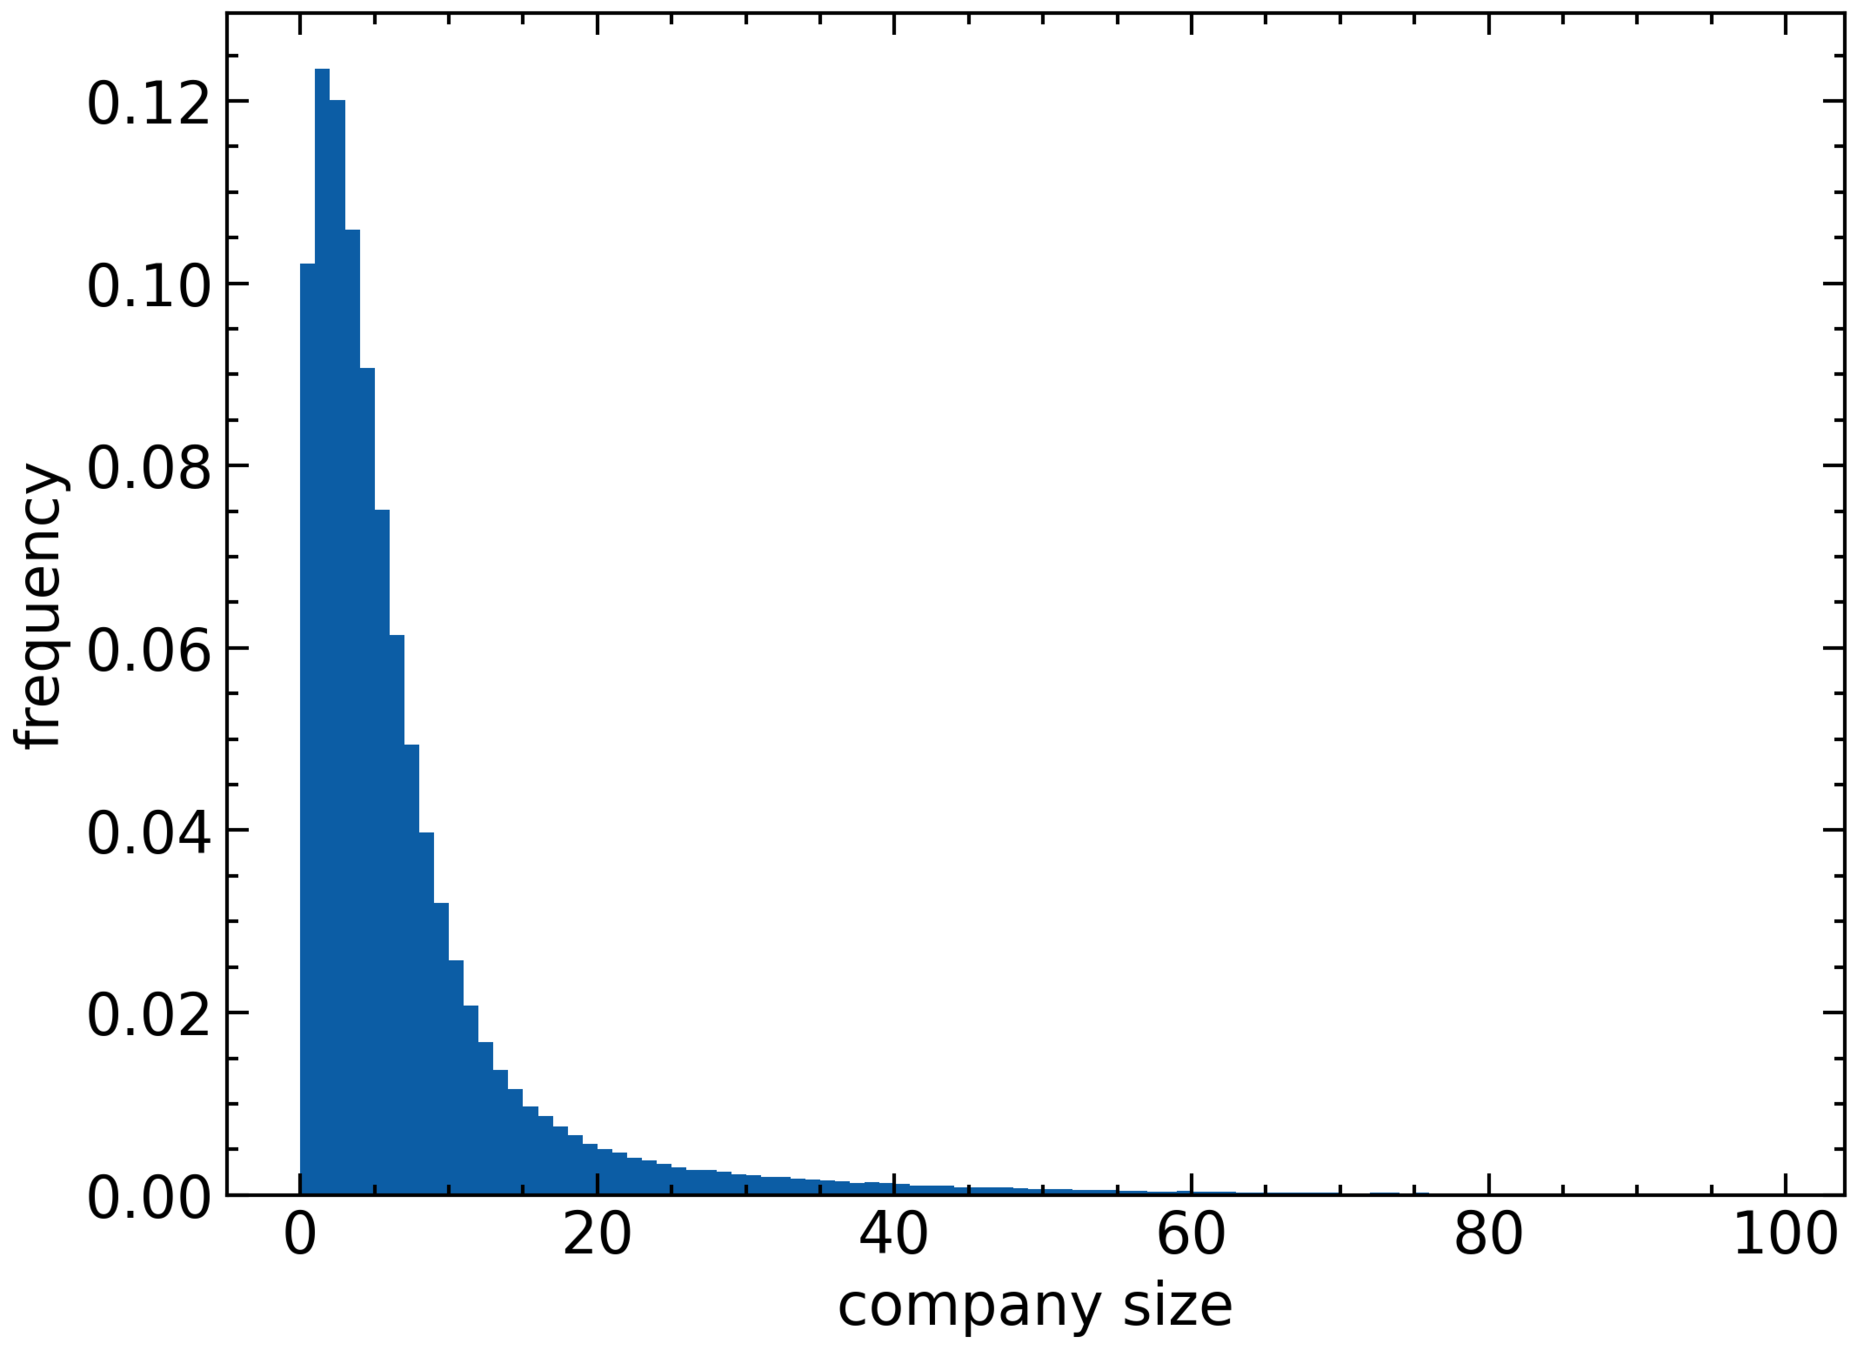
London
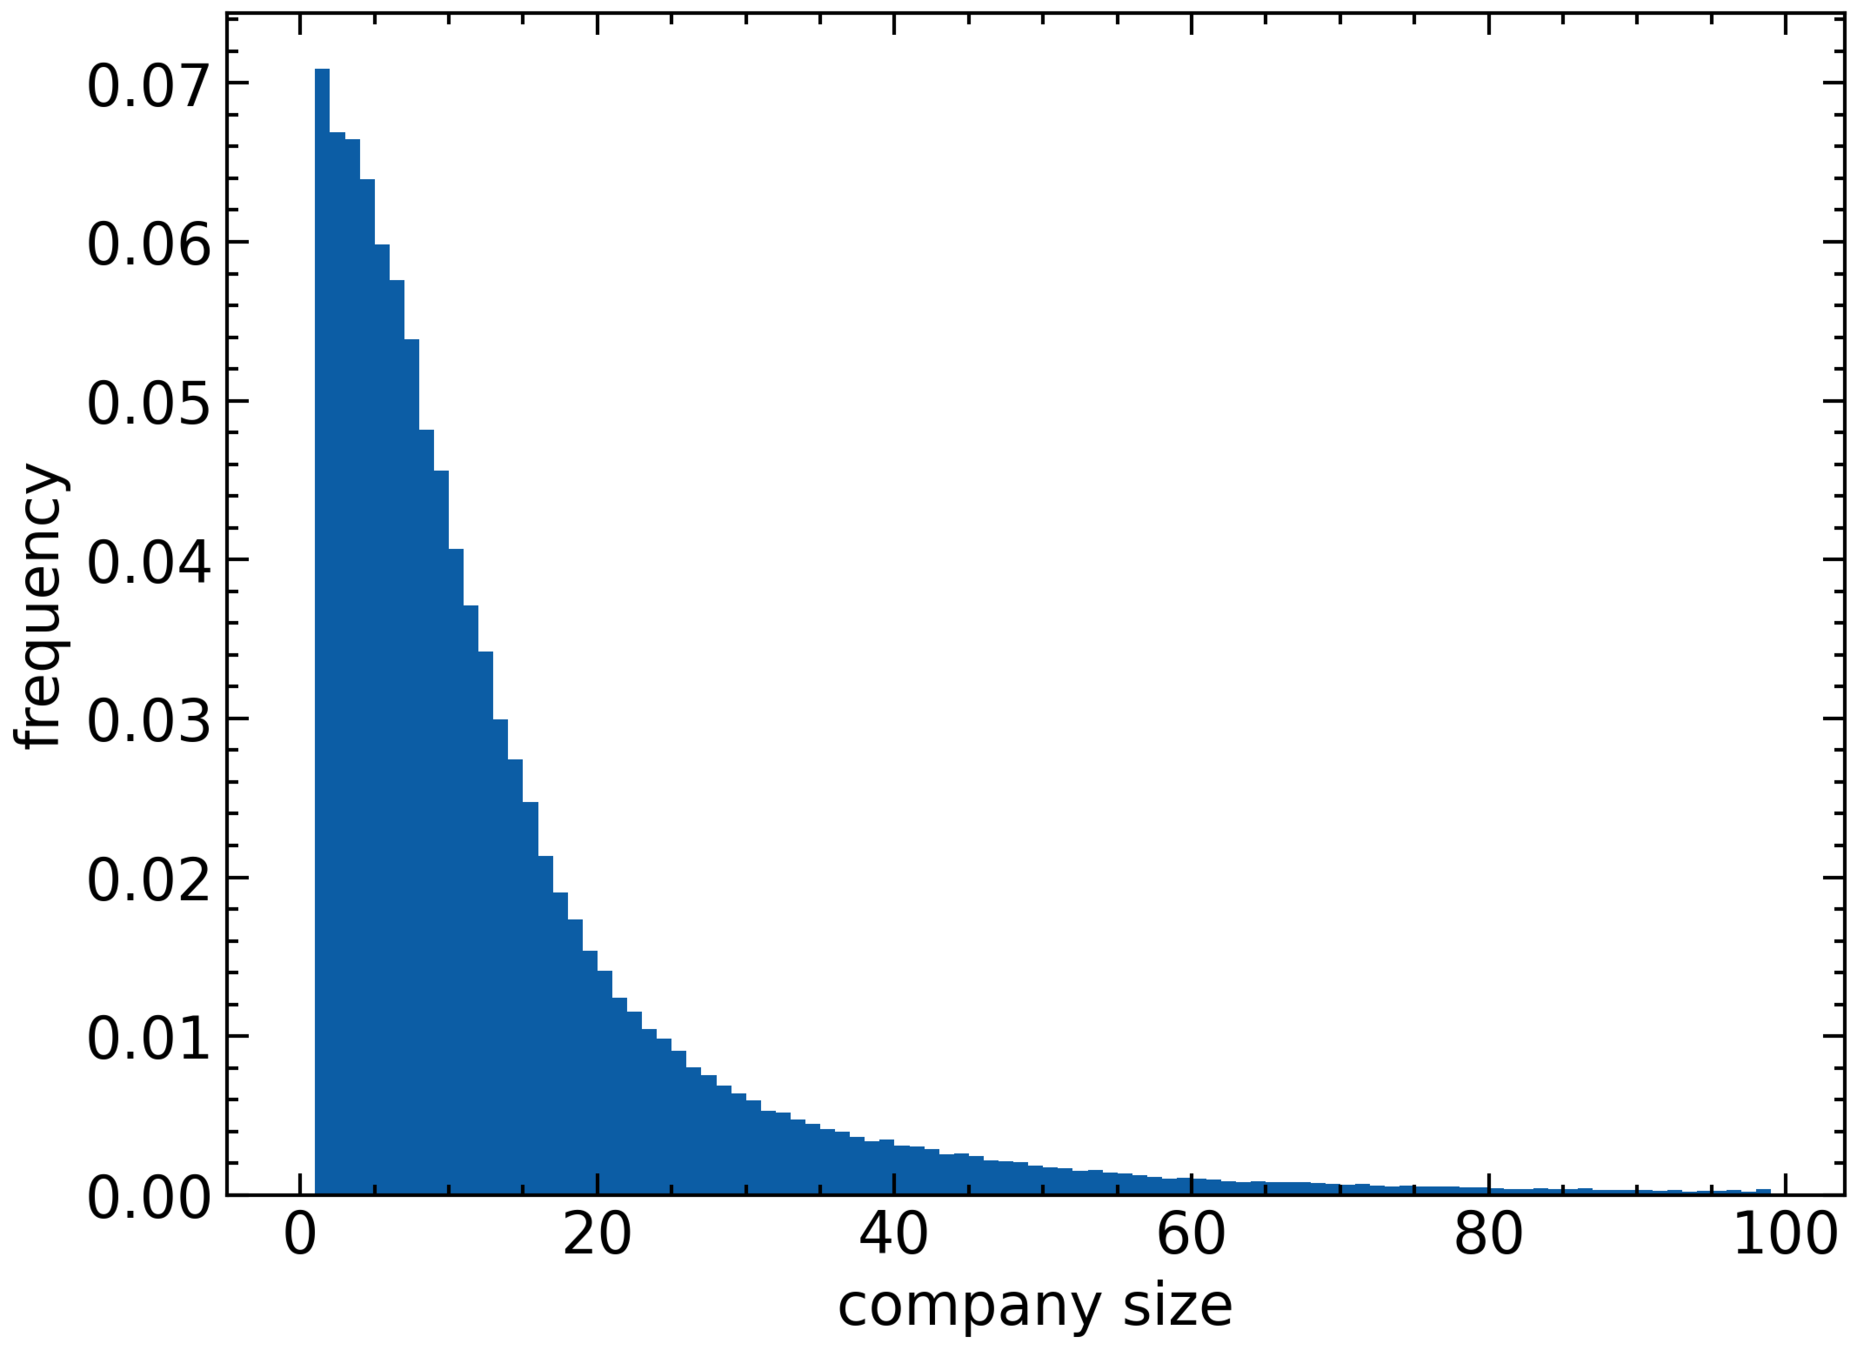
North East
Hospitals
- We model acute hospital trusts
North East region trusts.
beds
ICU beds
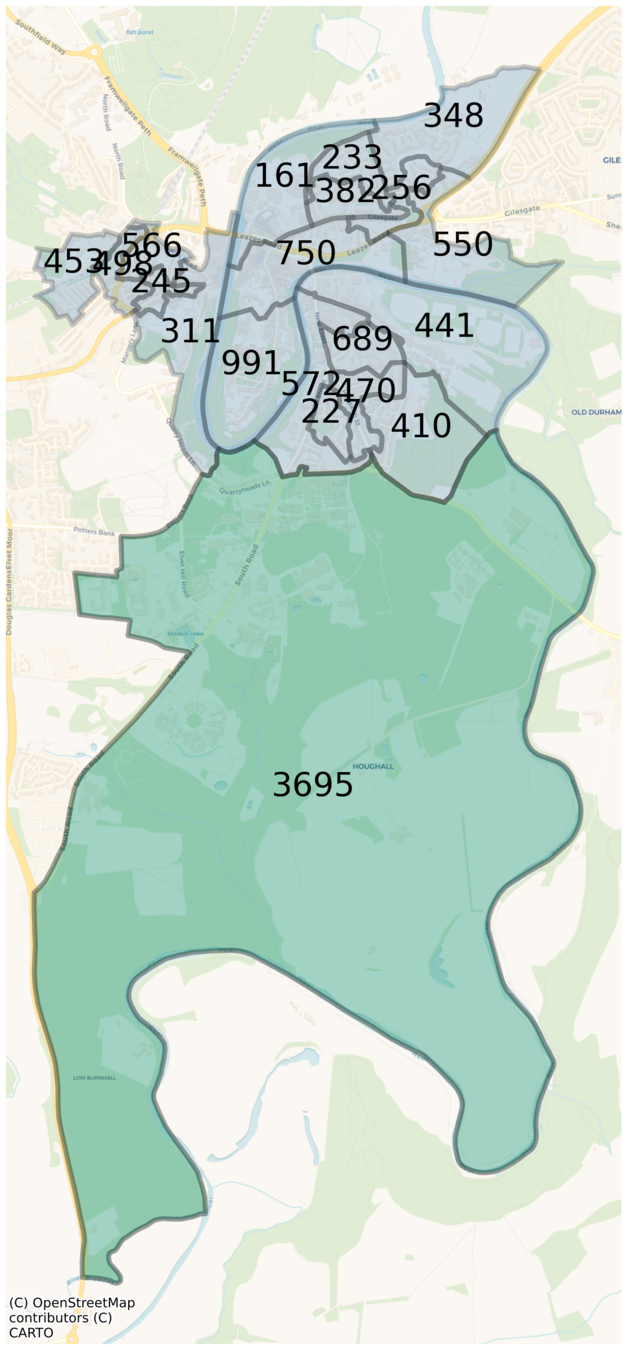
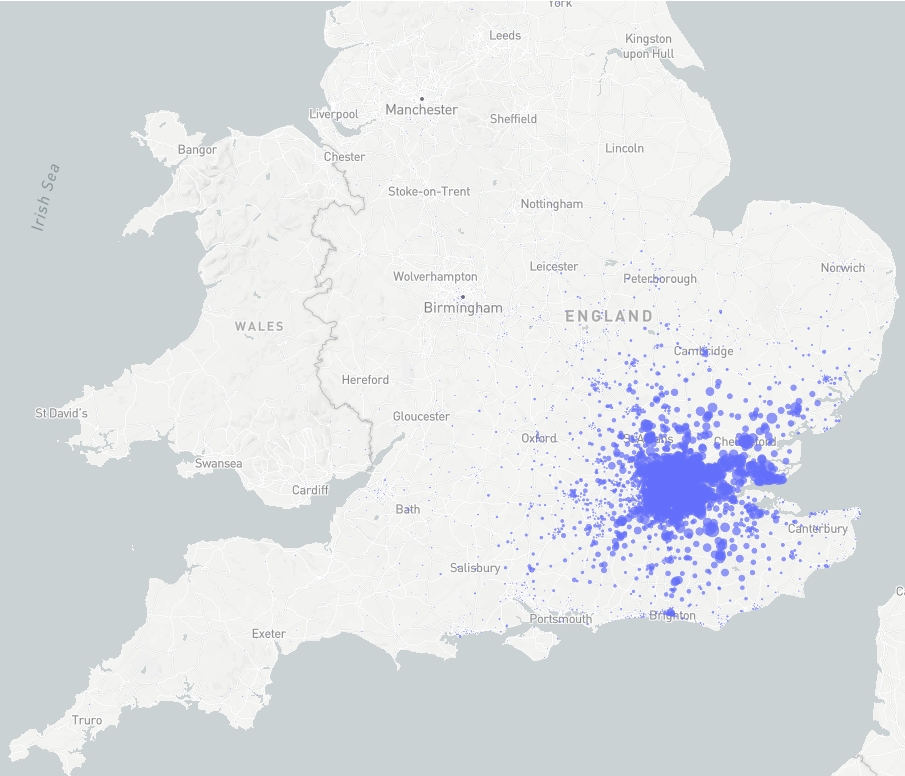
University
- All universities are included at their exact location.
- We match communal and student households to university enrolment.
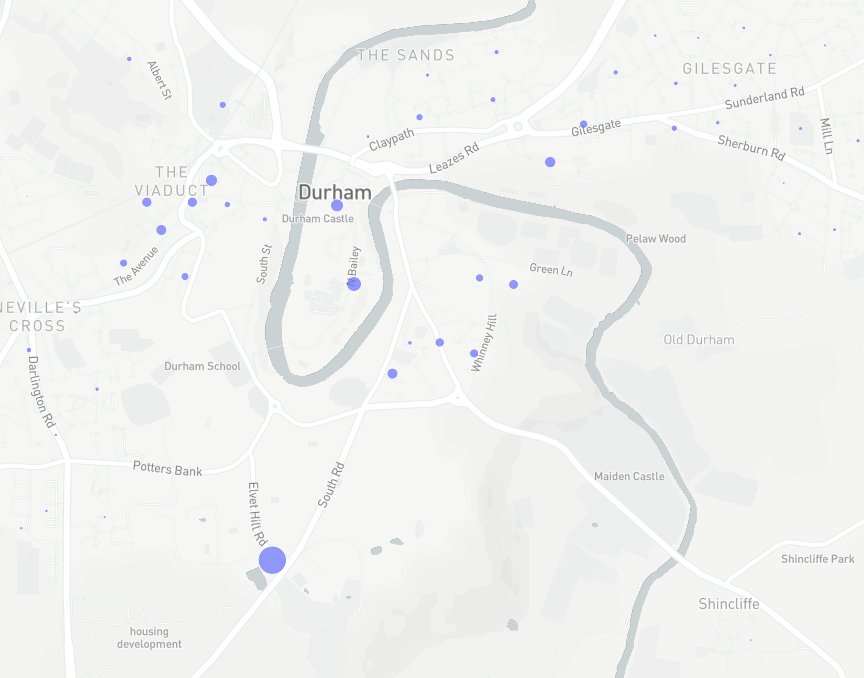
Durham University student households
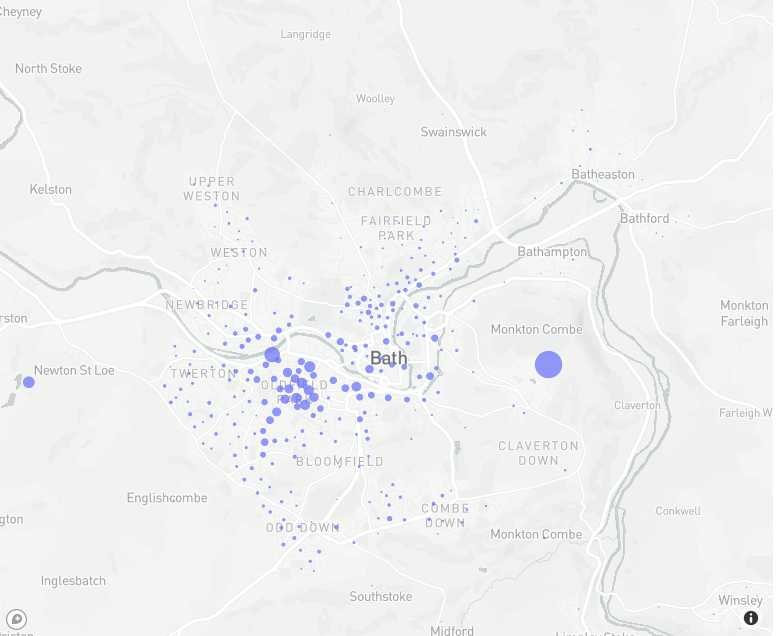
University
University of Bath student households
What can people do?
-
Residence
- Care Home
- Household
-
Primary activity
- Company
- Hospital
- School
- Care Home
- University
-
Travel
- Commute
- National travel
-
Leisure
- Shopping
- Pubs / restaurants
- Cinema
What can people do?
-
Residence
- Care Home
- Household
-
Primary activity
- Company
- Hospital
- School
- Care Home
- University
-
Travel
- Commute
- National travel
- Leisure
- Shopping
- Pubs / restaurants
- Cinema
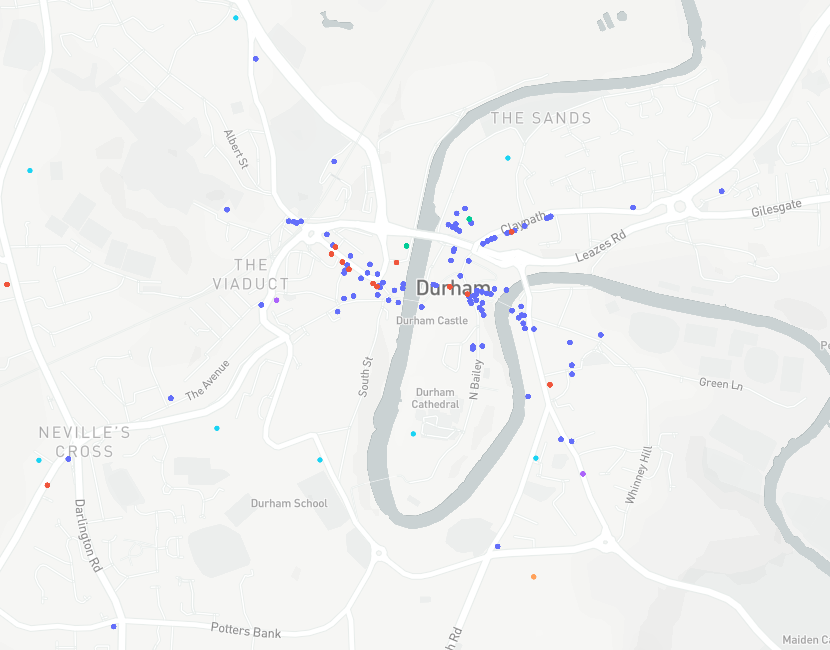
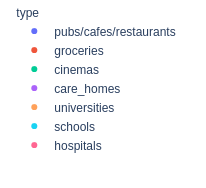
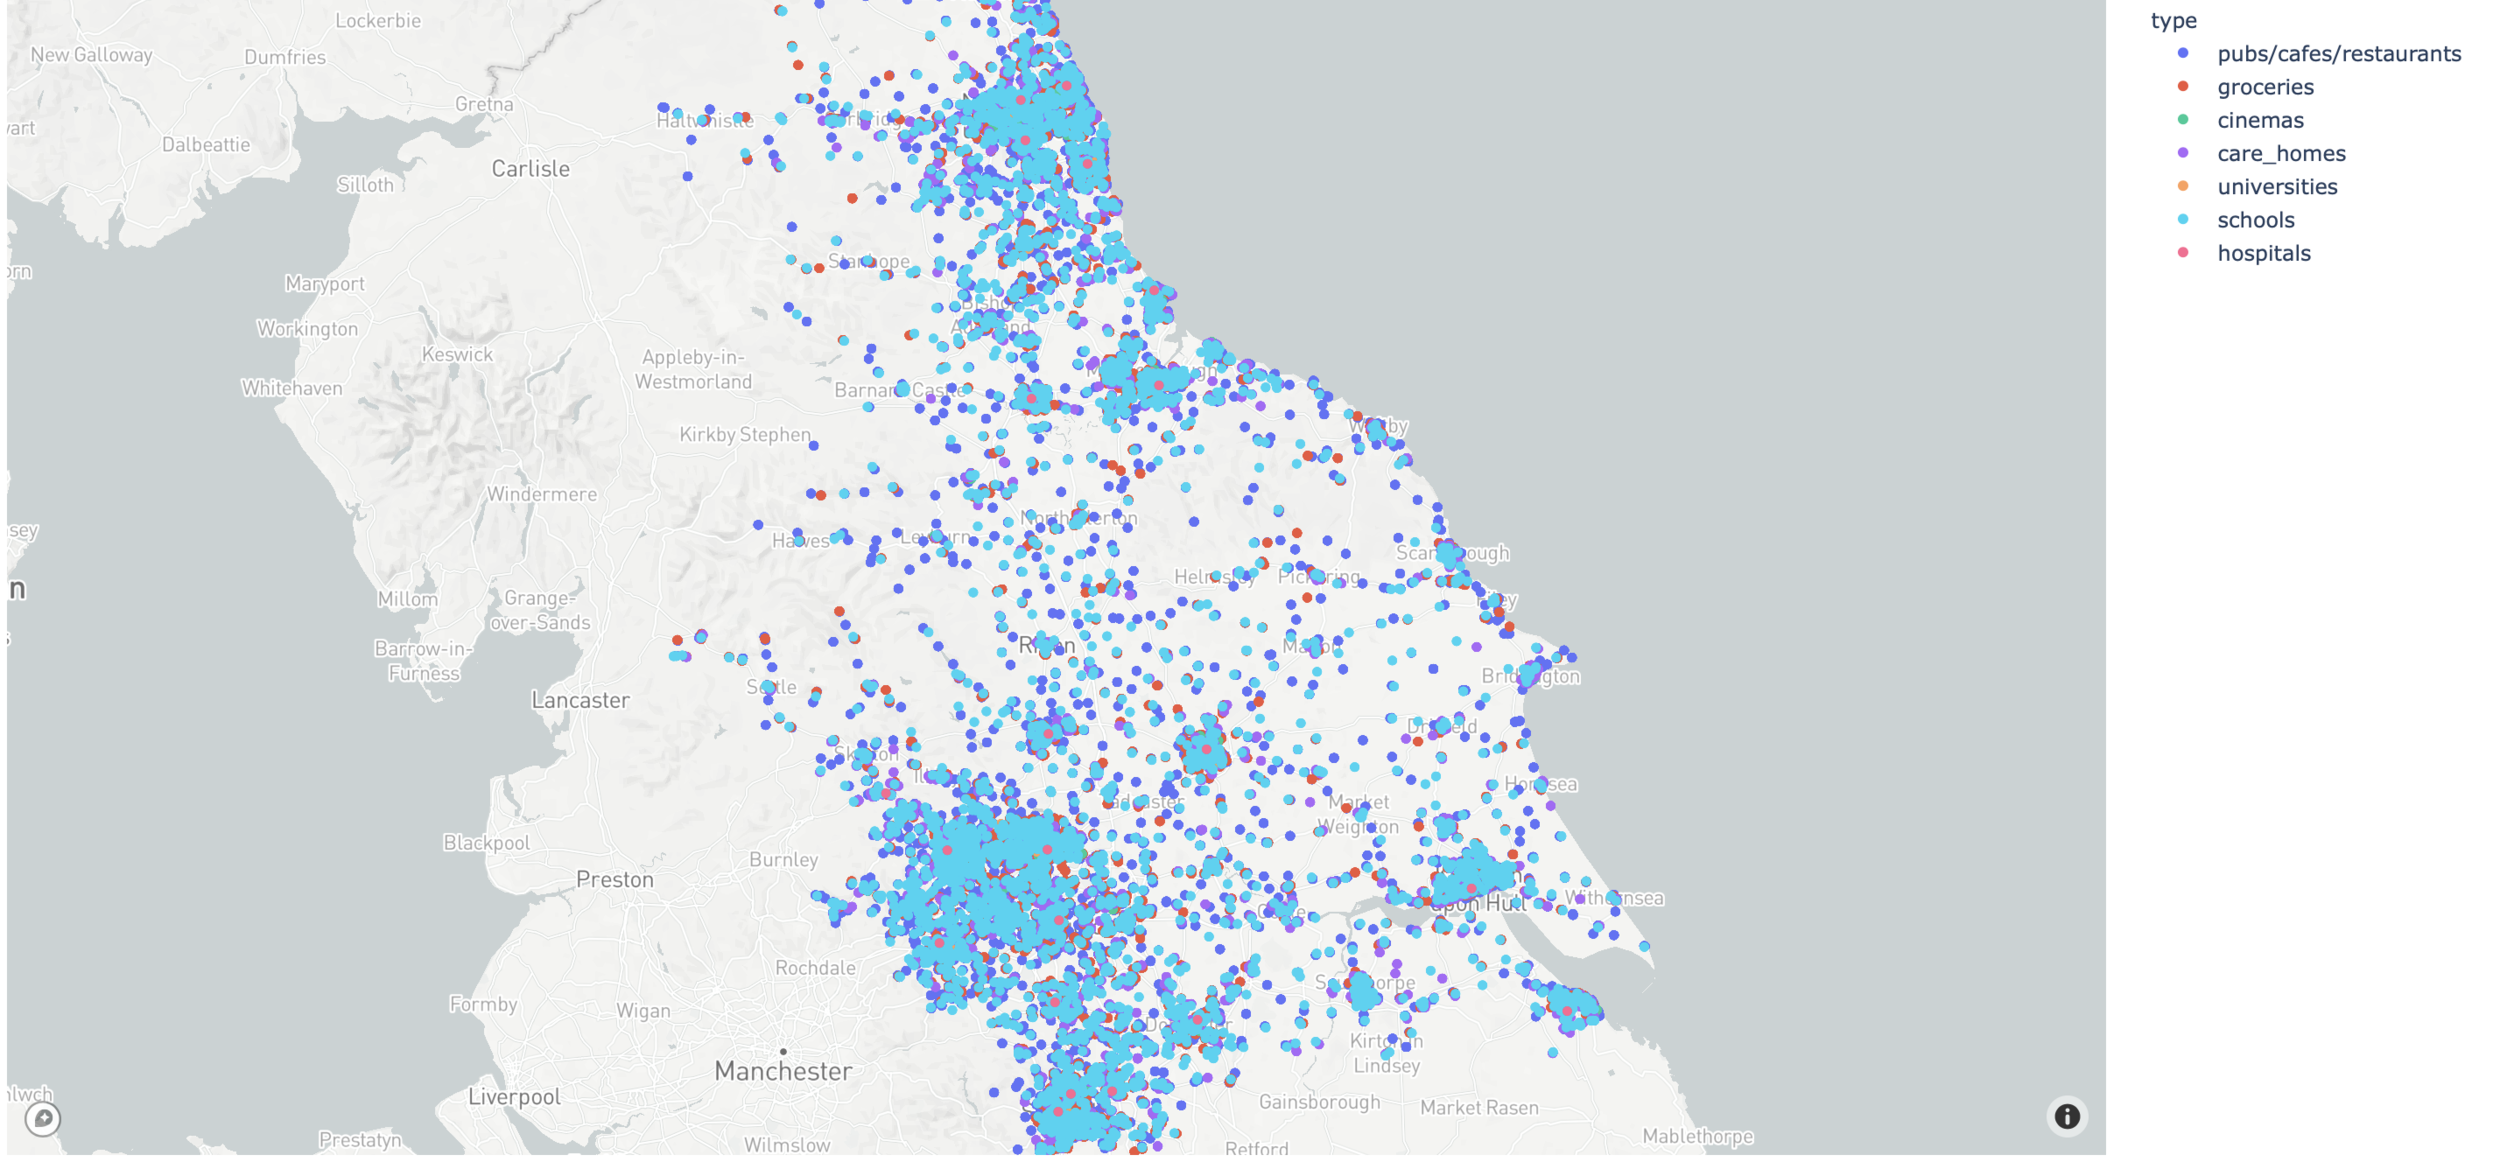
Leisure
- Exact locations of every single pub, restaurant, grocery store, cinema, etc. from OpenStreetMap
World dynamics
Visiting
Household visits
Care home visits

Leisure activities
We include:
- Grocery stores
- Pubs
- Cinemas
Visits and leisure activities
Probability of attending is based on data
p_{\text{attending}} = 1 - p_{\text{not-attending}}\\
p_{\text{not-attending}} = \text{exp}[-\Delta t* \lambda]
Poisson distribution for decision
male_age_probabilities:
  3-75: 0.03
  75-80: 0.01
female_age_probabilities:
  3-75: 0.03
  75-80: 0.01
neighbours_to_consider: 5
maximum_distance: 15
weekend_boost: 1
drags_household_probability: 0.5
Commuting
Commuting offers further mixing potential outside your immediate social and work group
Data on commuting derived from NOMIS 'flow data'
Public
Public
Private
Commuting
11 major stations identified for public commuting
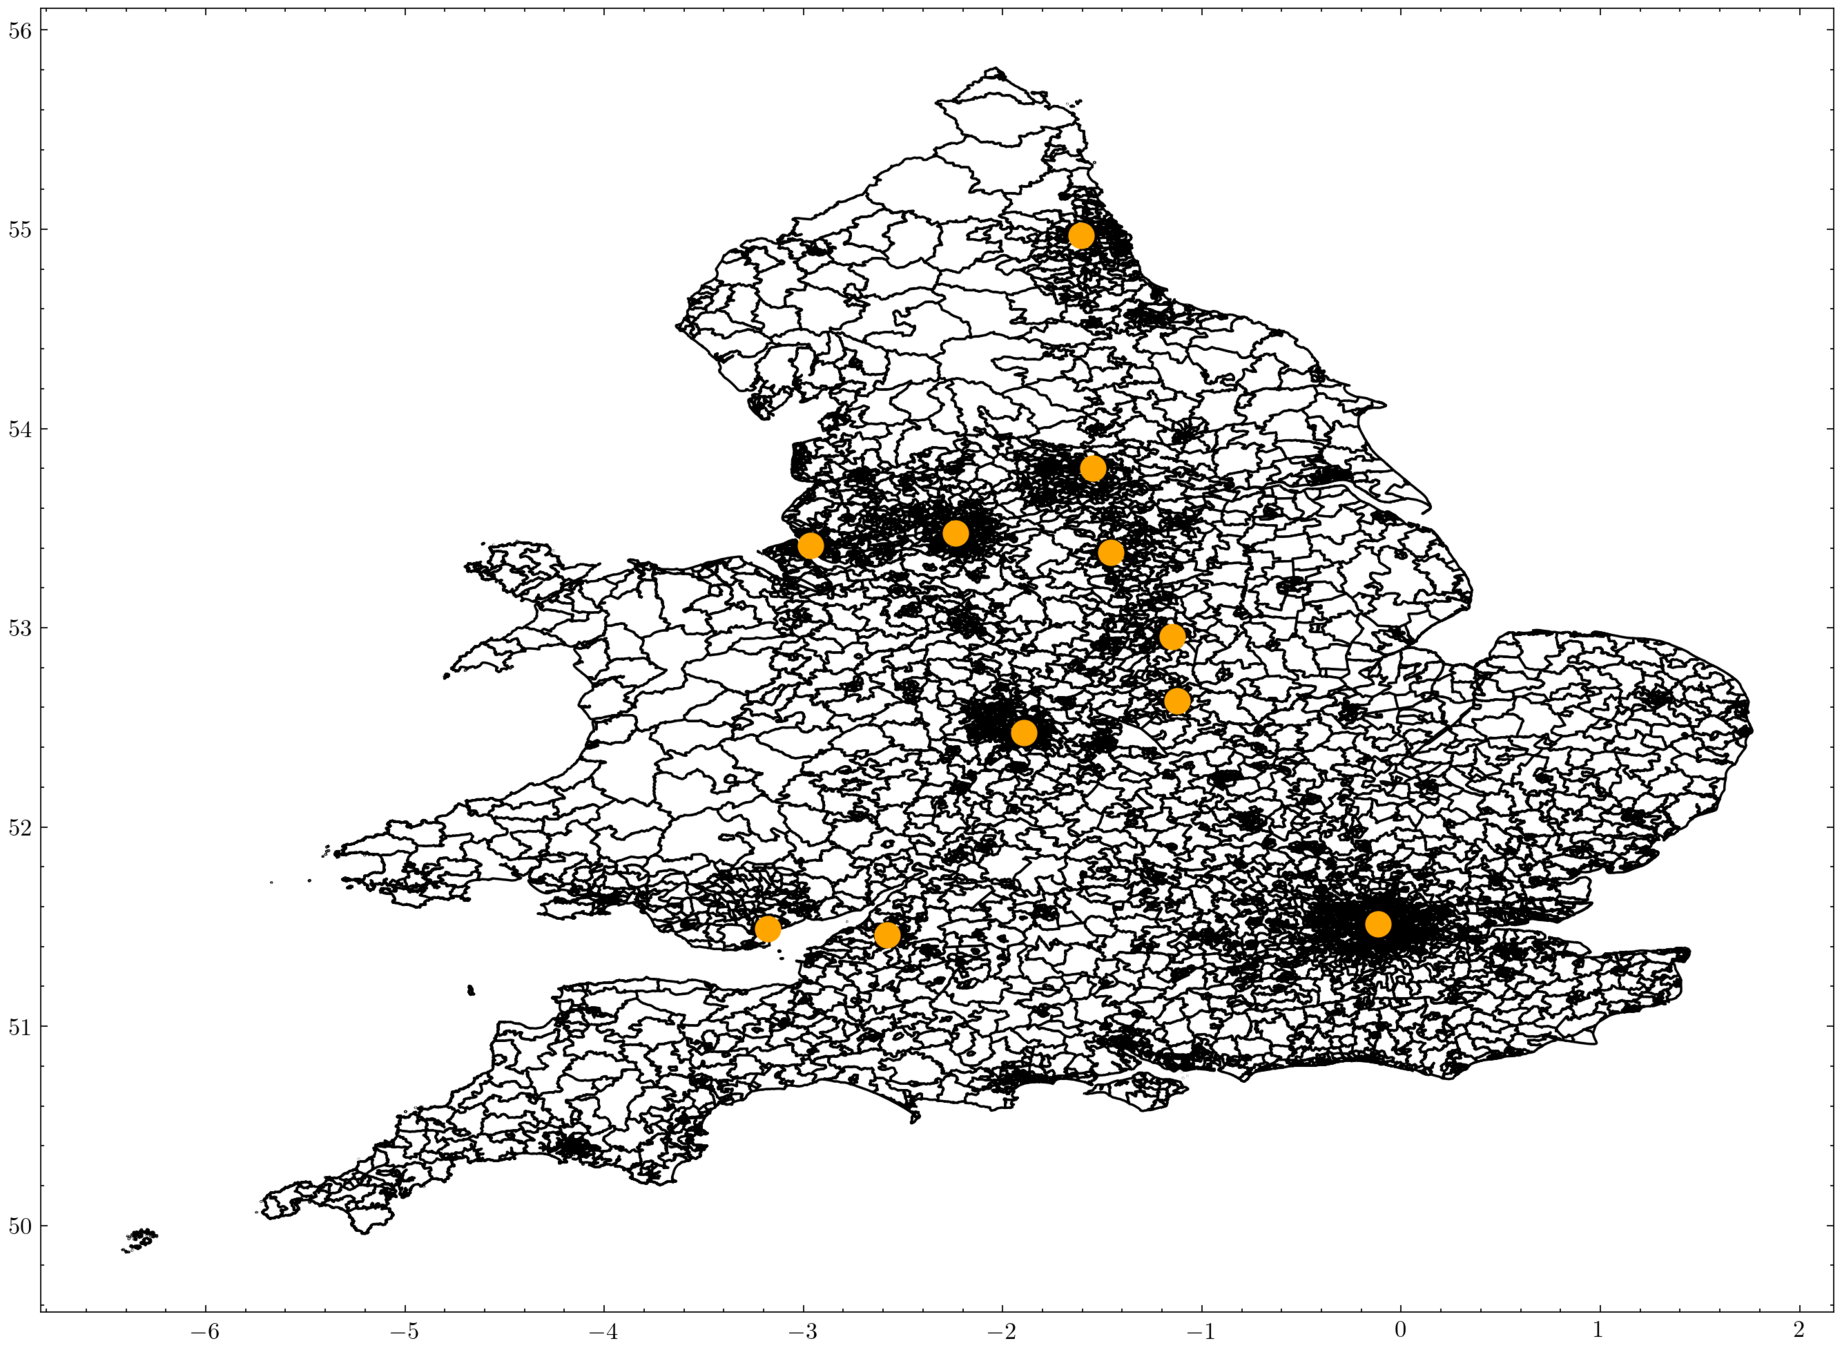
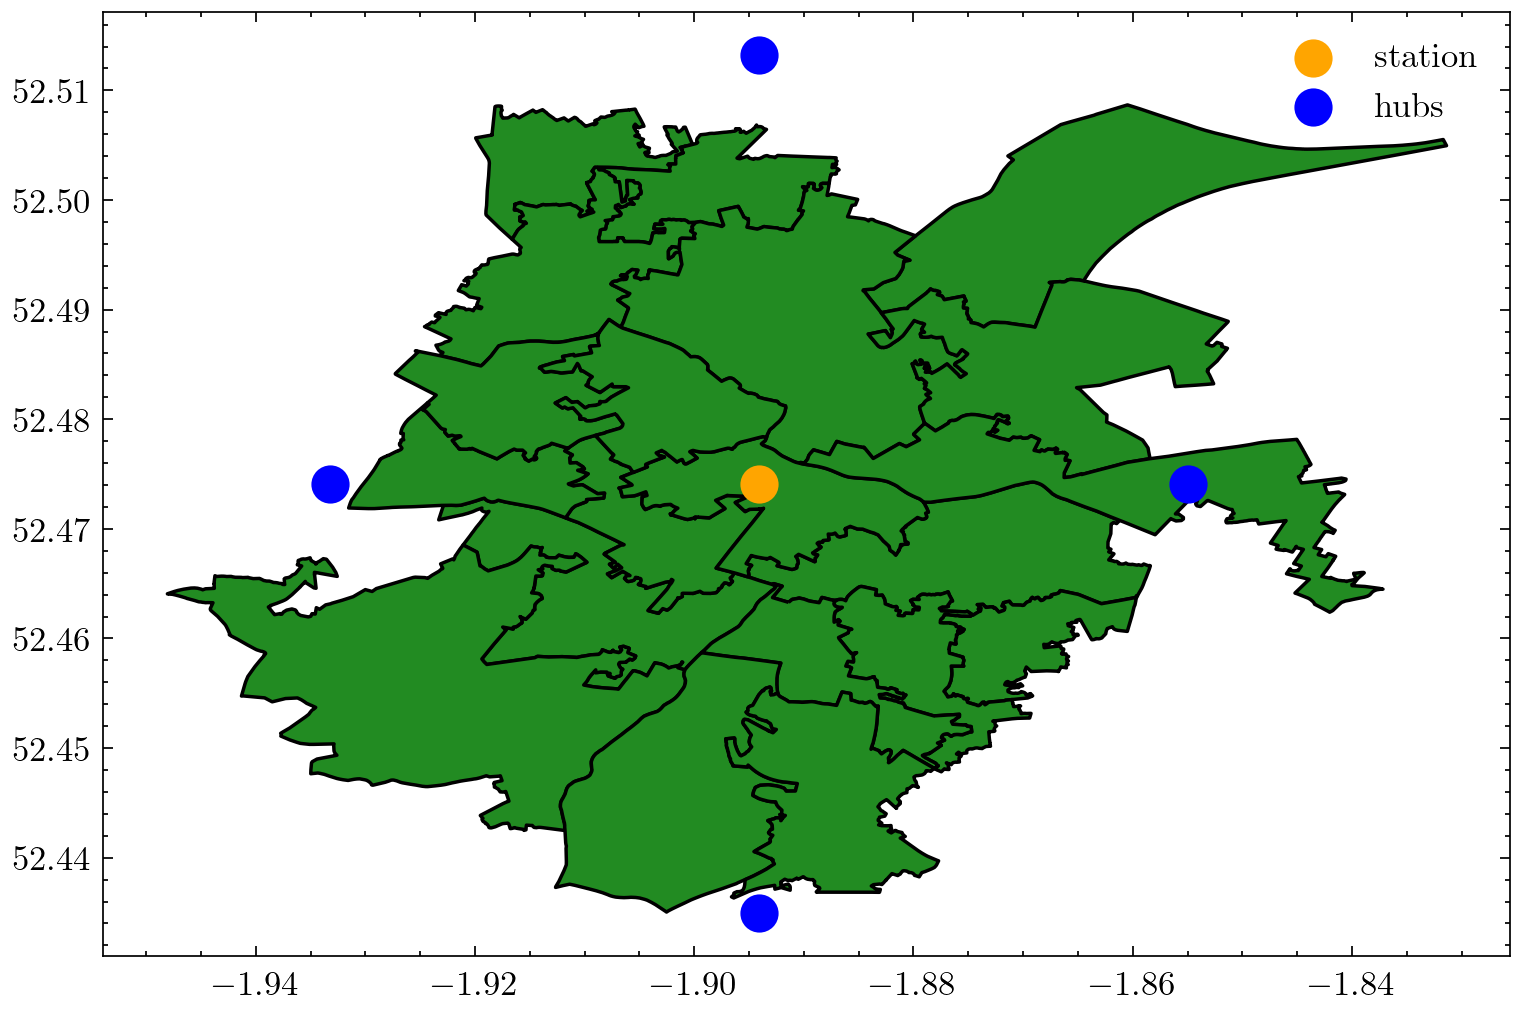
Inter-regional travel
Works in a similar way as commuting
Links created between 11 major cities
Data from National Rail and Department of Transport for departure/arrival numbers
Construct simulation for approximating origin-destination matrix

Validate against data
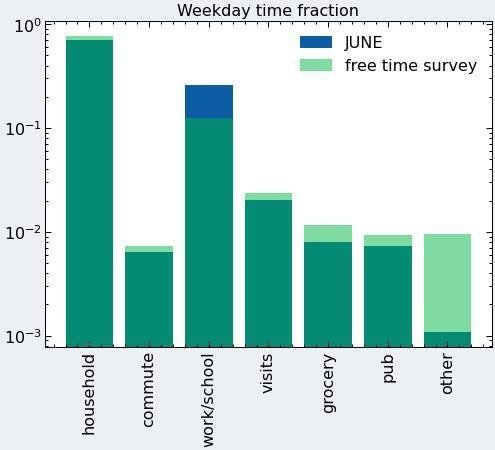
Free time survey:
Survey of how individuals spend their time during a typical work day
Modelling Covid-19
Infection requires proximity: social mixing patterns

43 yo
38 yo
10 yo

Contact matrices
43 yo
38 yo
10 yo
43 yo
38 yo
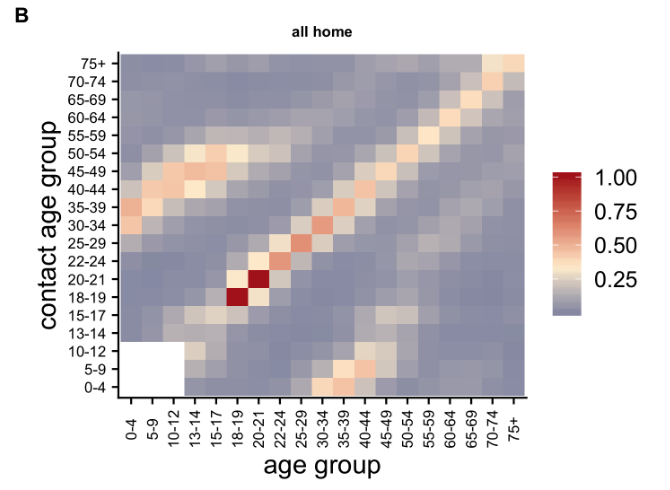
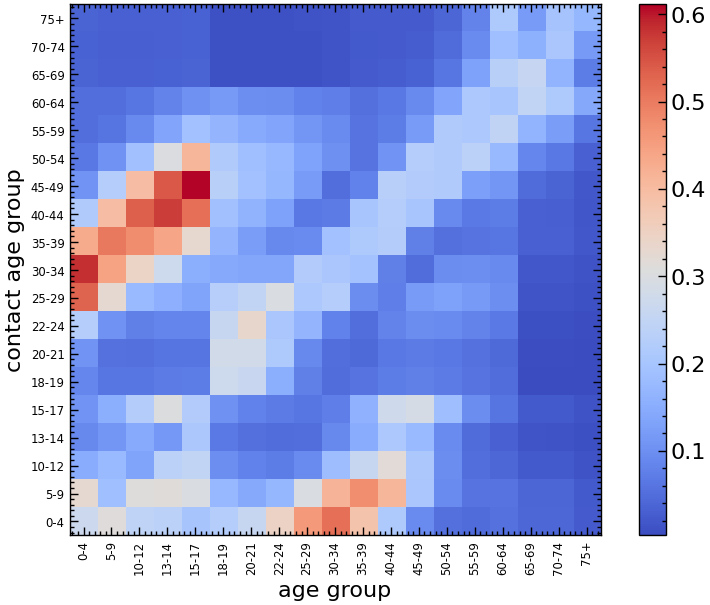
Household contact matrix
BBC pandemic survey: medRxiv 2020.02.16.20023754
Household contact matrix
BBC pandemic survey: medRxiv 2020.02.16.20023754
JUNE
BBC Pandemic Survey
School contact matrix
BBC pandemic survey: medRxiv 2020.02.16.20023754
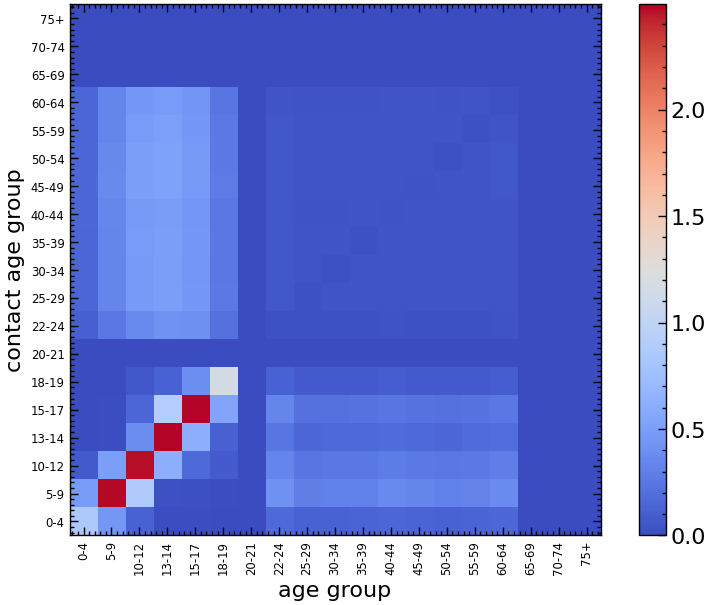
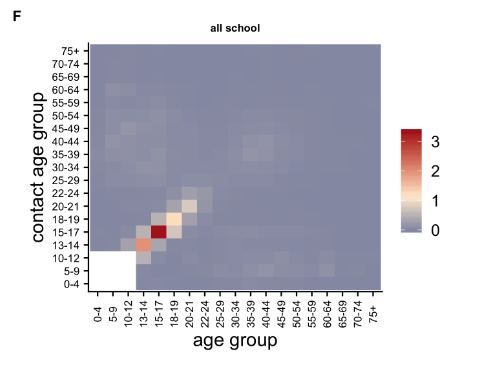
BBC Pandemic Survey
JUNE
43 yo
38 yo
10 yo
How do people transmit the infection?
j
j
i


Intensity of contacts (per group)
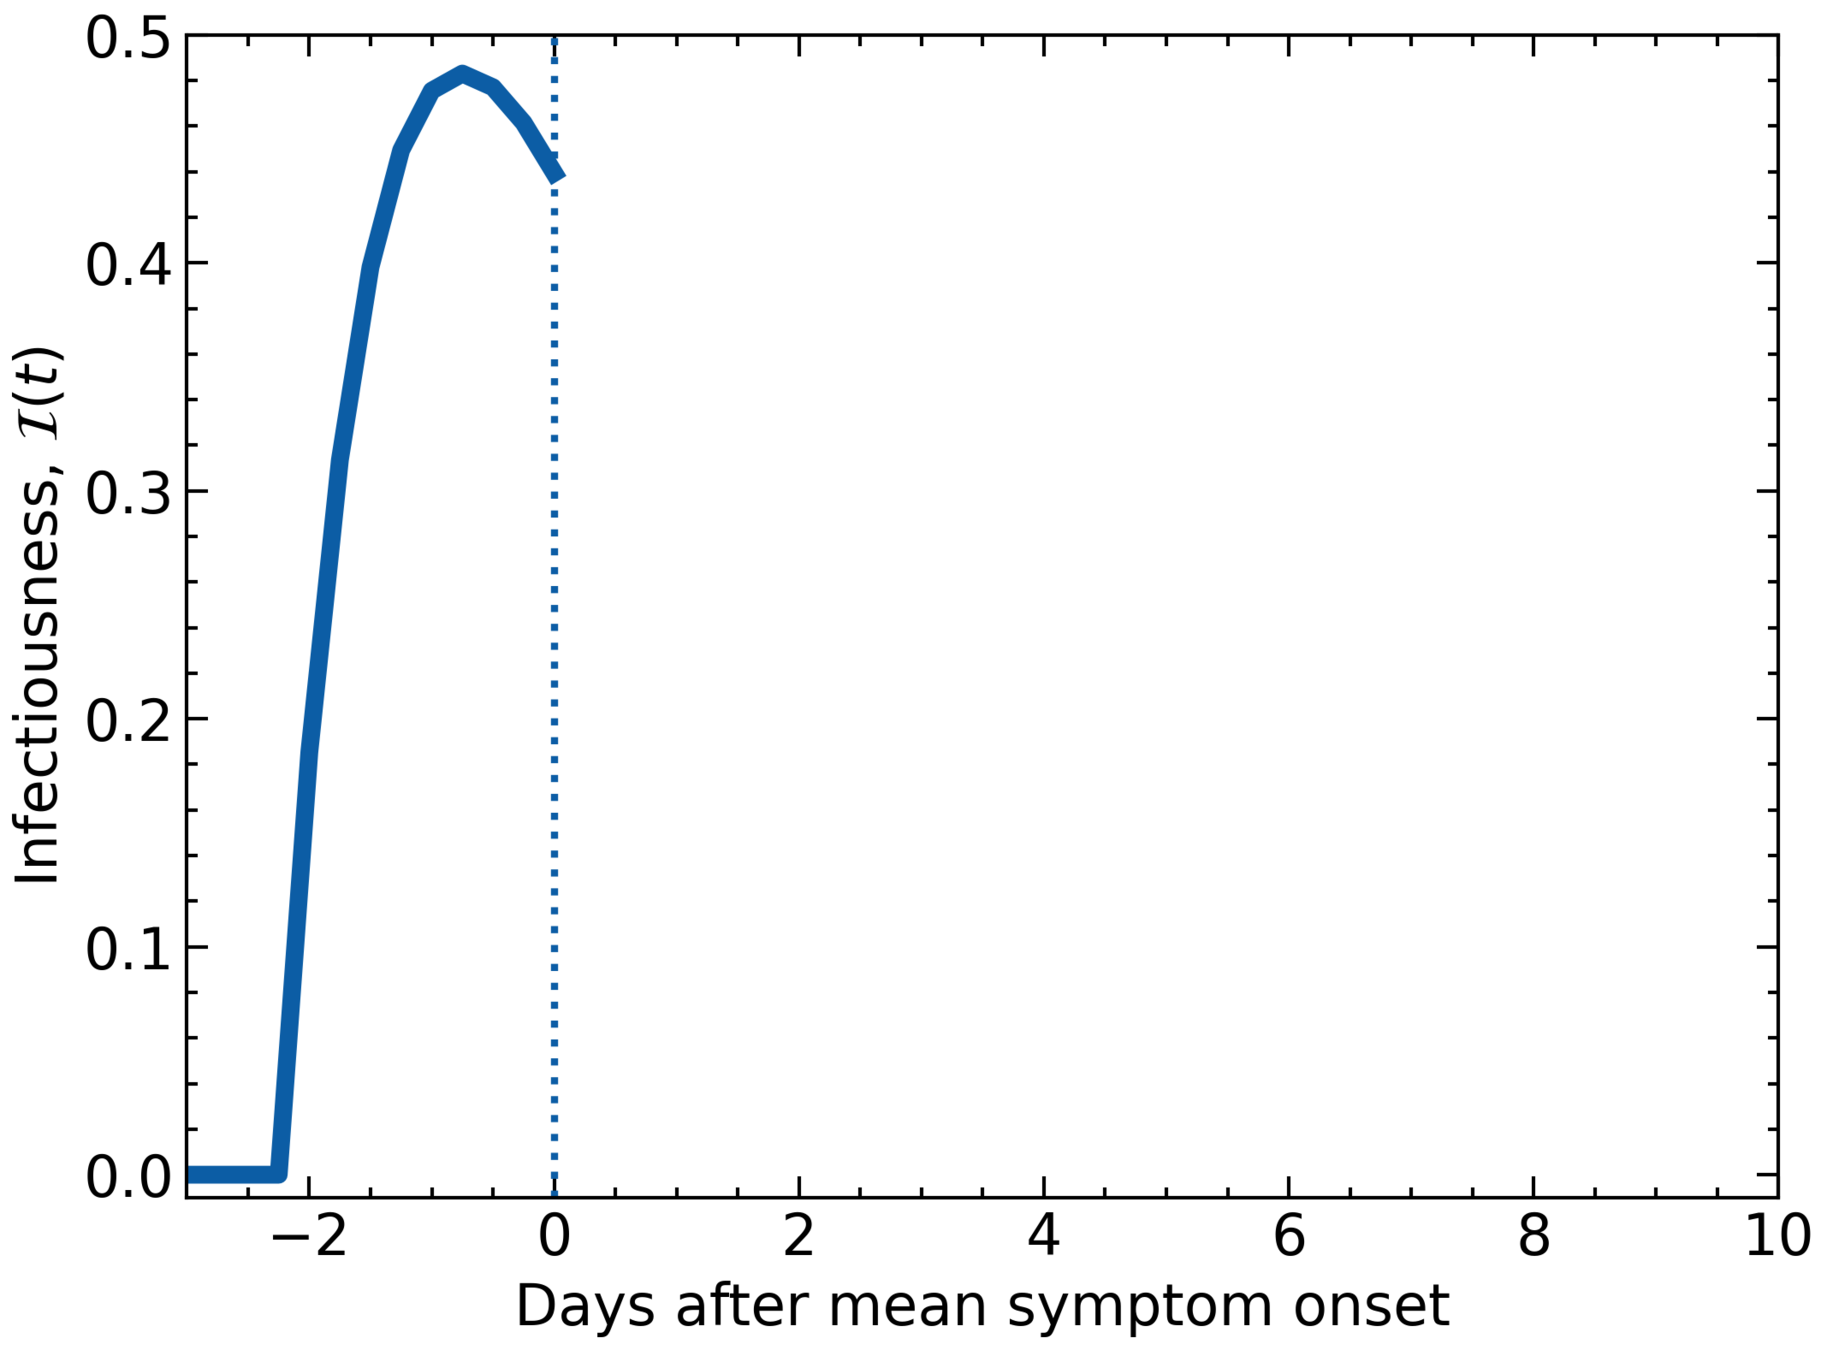
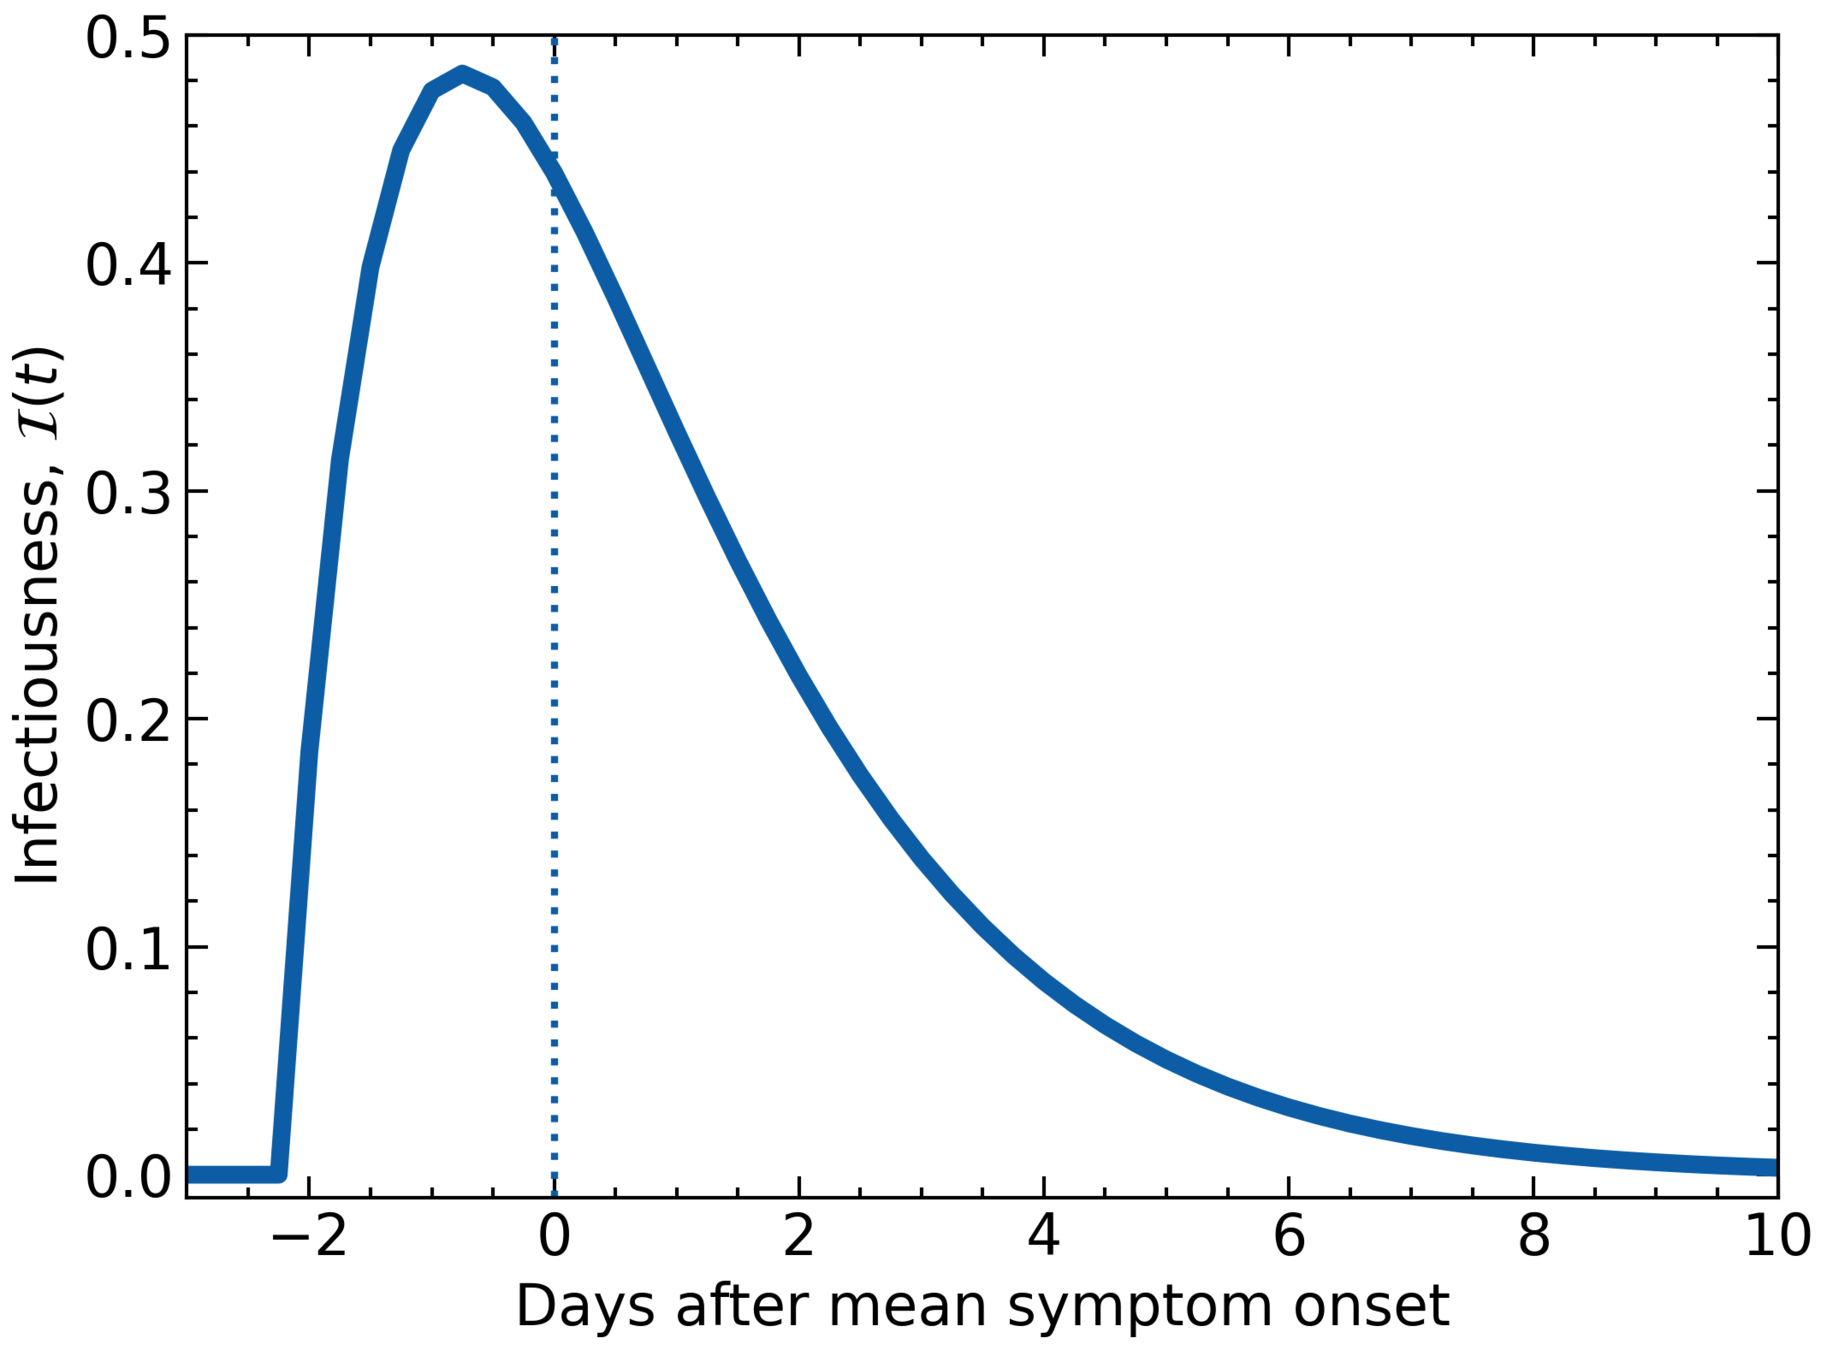
Infectiousness profile

Infectiousness profile

The fate of the infected

Credit: http://www.eoht.info/page/god+does+not+play+dice
Asymptomatic
Mild symptoms
Severe symptoms
Hospitalised
Intensive care
But it isn't a fair dice!
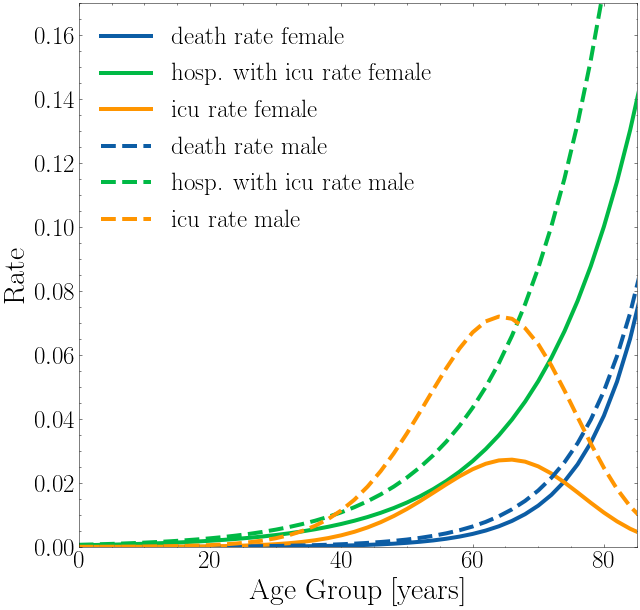
But it isn't a fair dice!
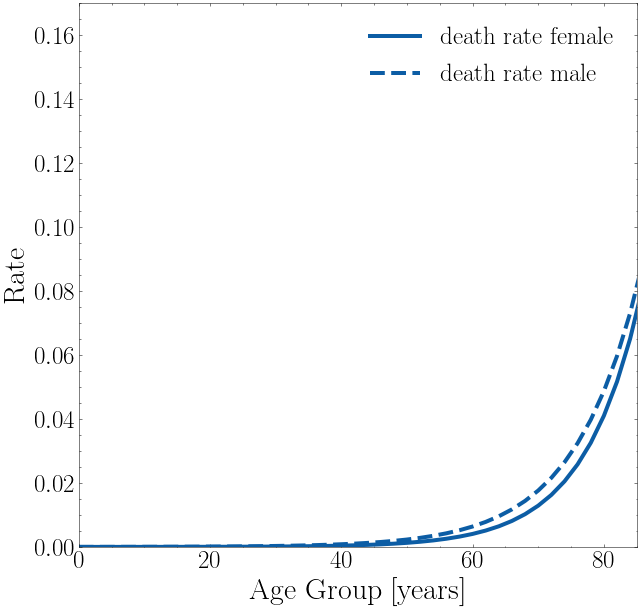
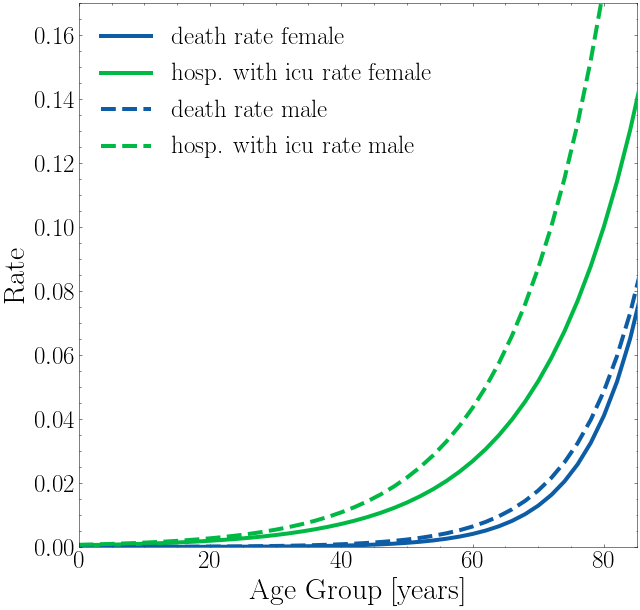
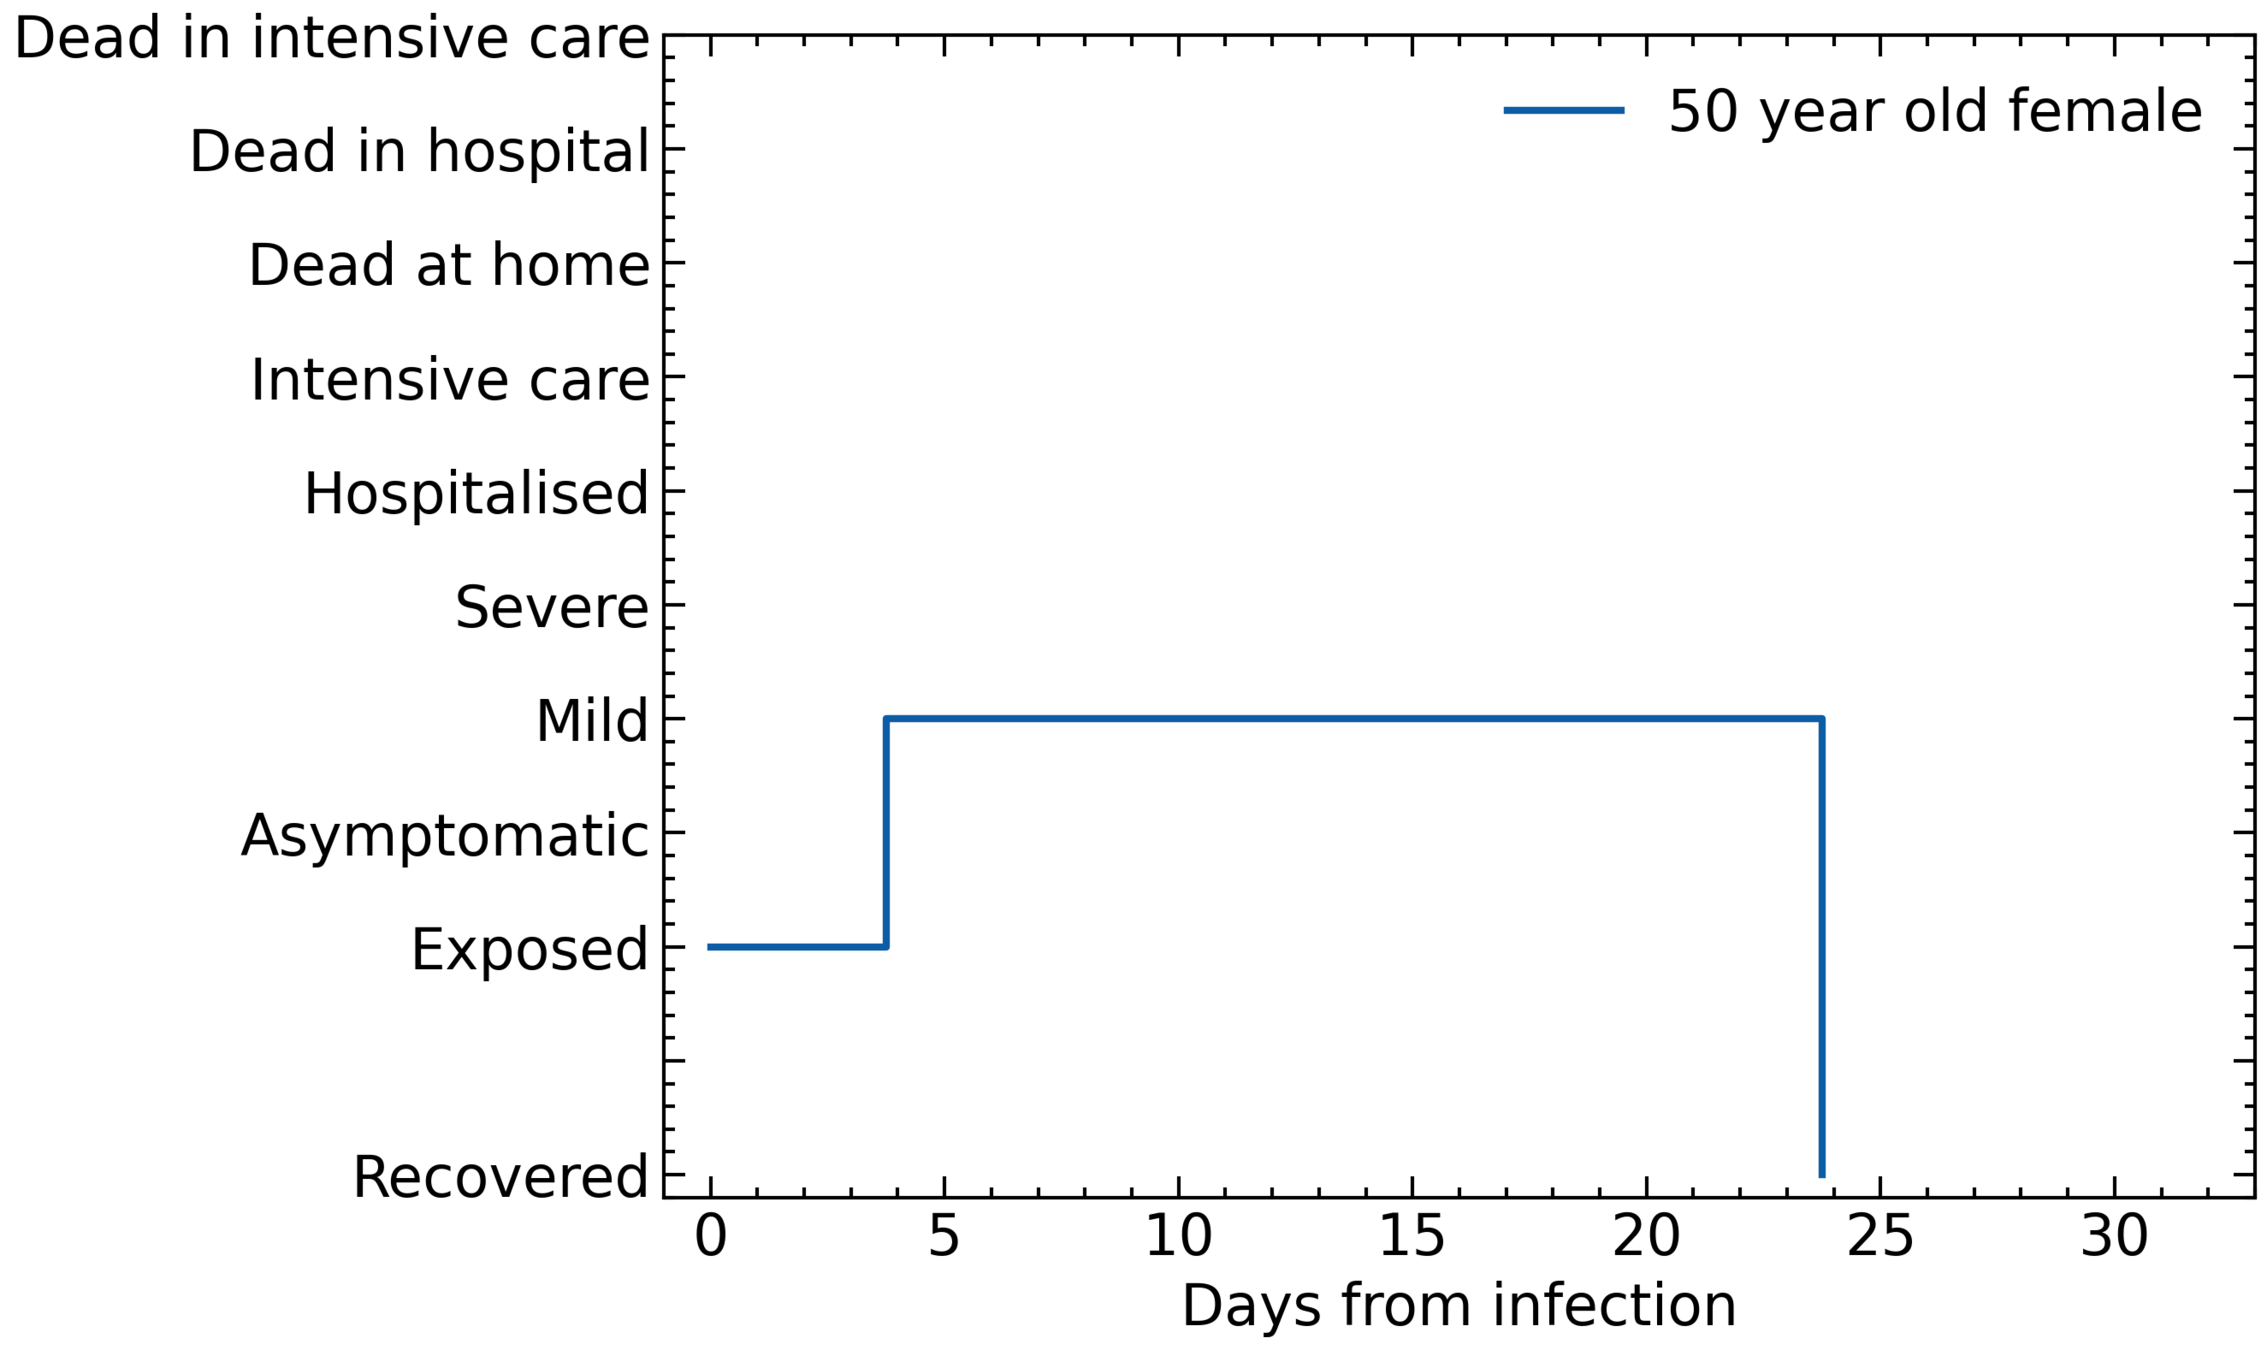
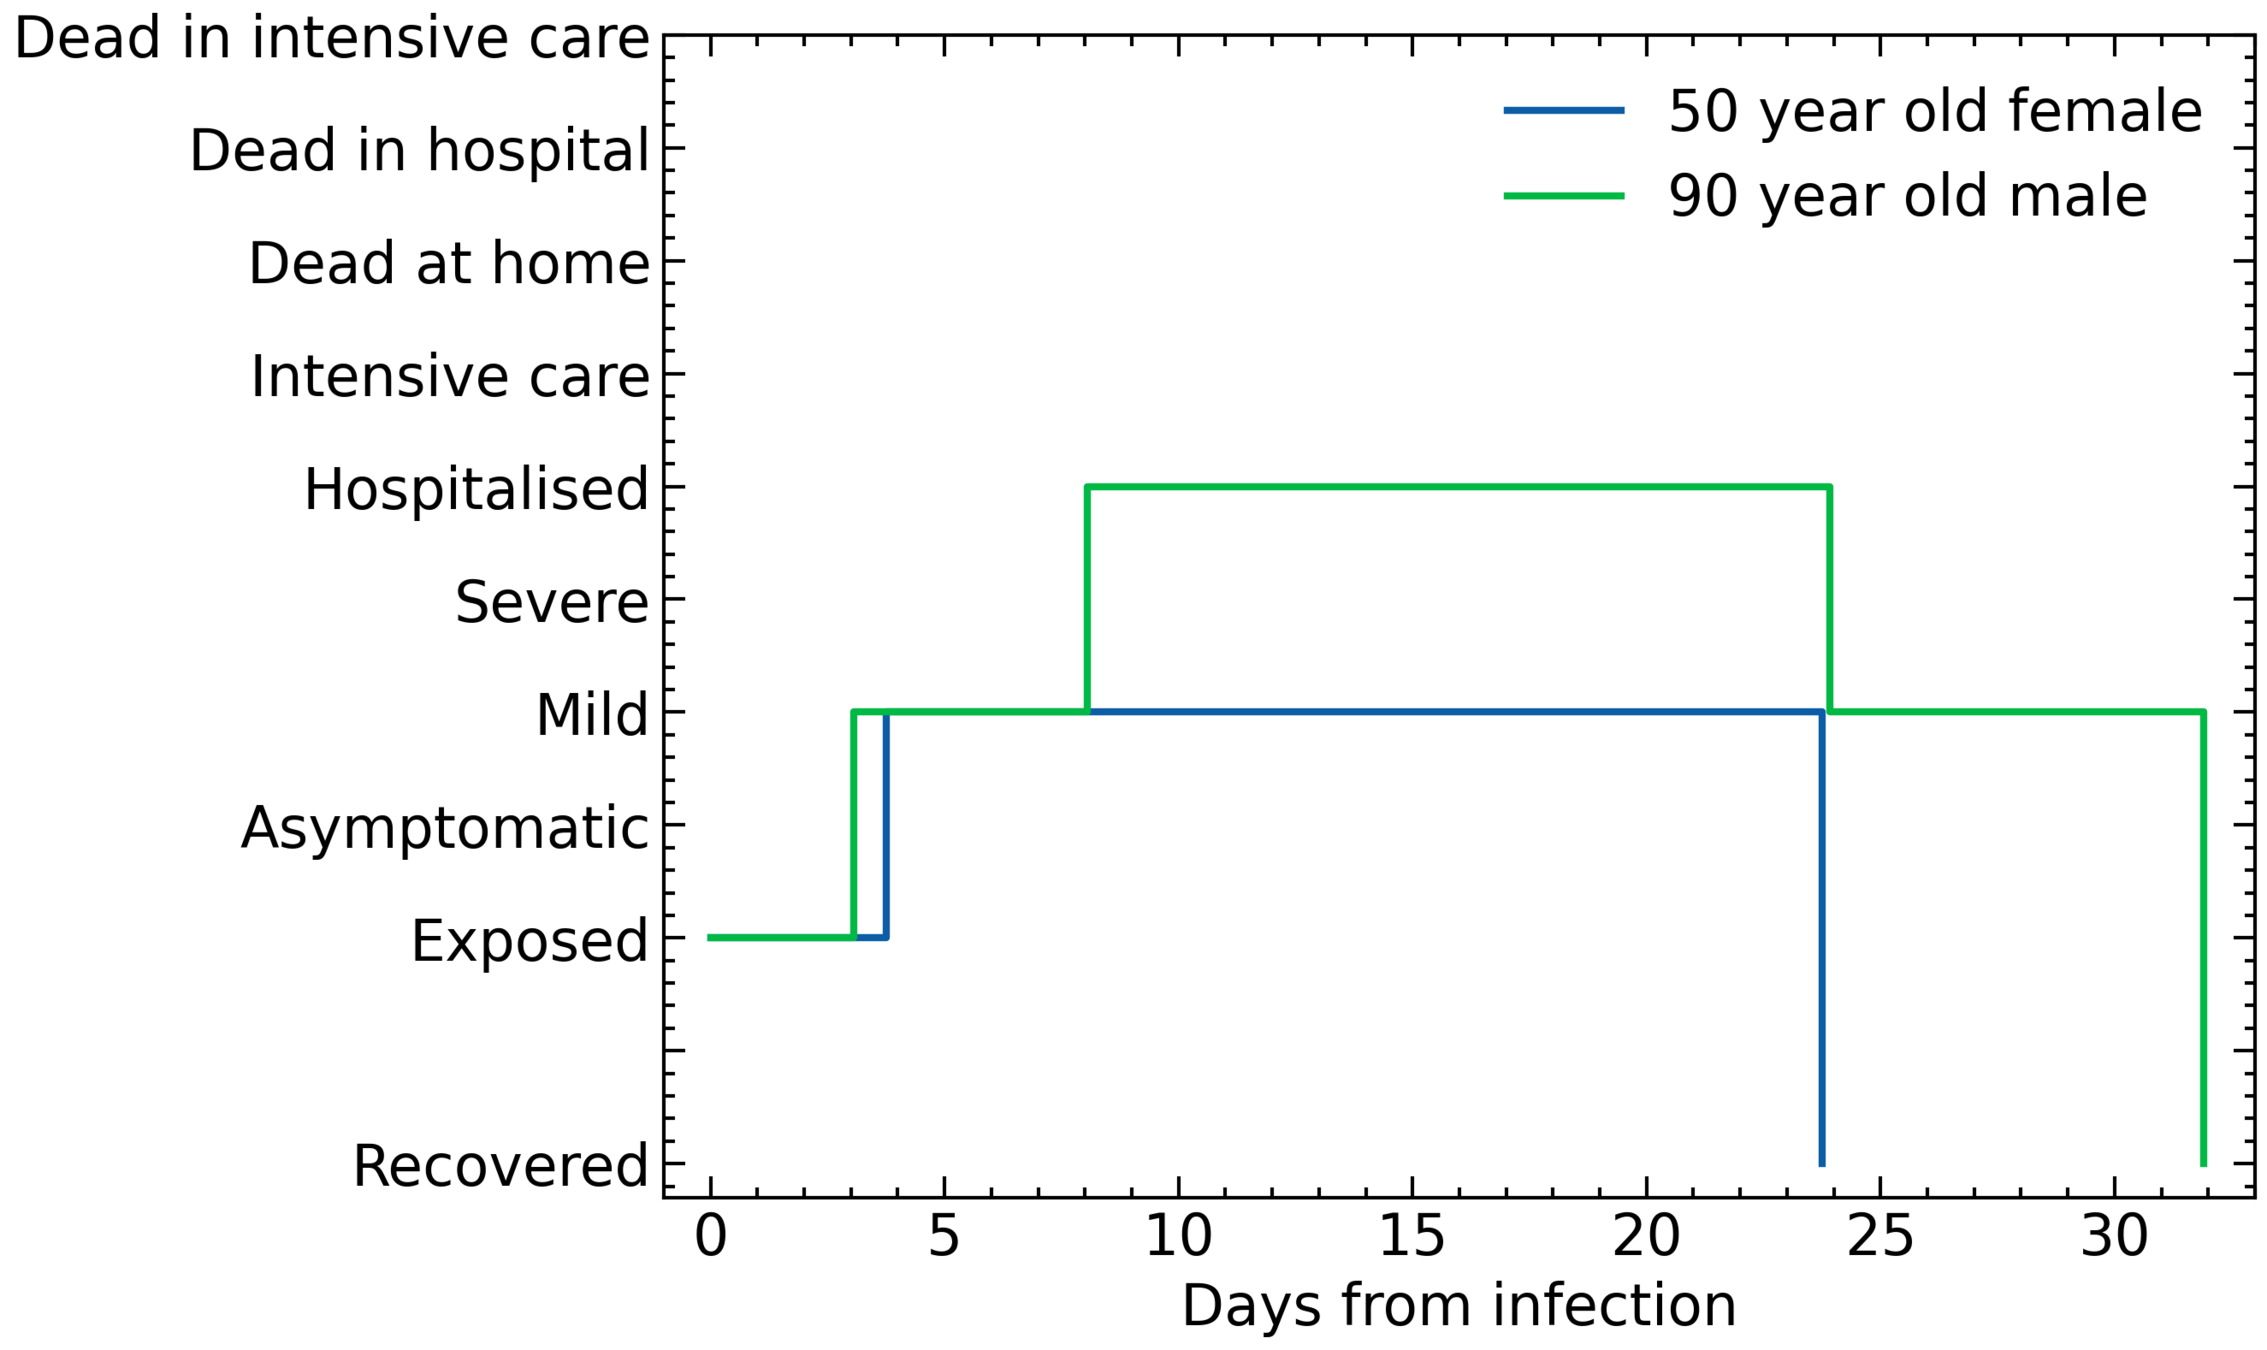
The symptom trajectories
Policies
Policies
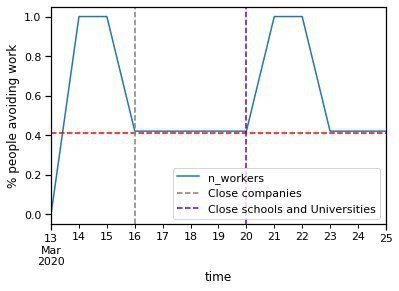
Policies can be turned on and off according to dates
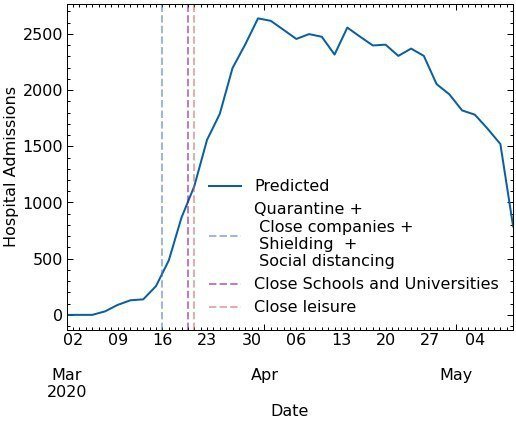
The following policies have been implemented by the UK Government and are in the model:
| Policy | Date |
|---|---|
| Case isolation at home | 12/03/2020 |
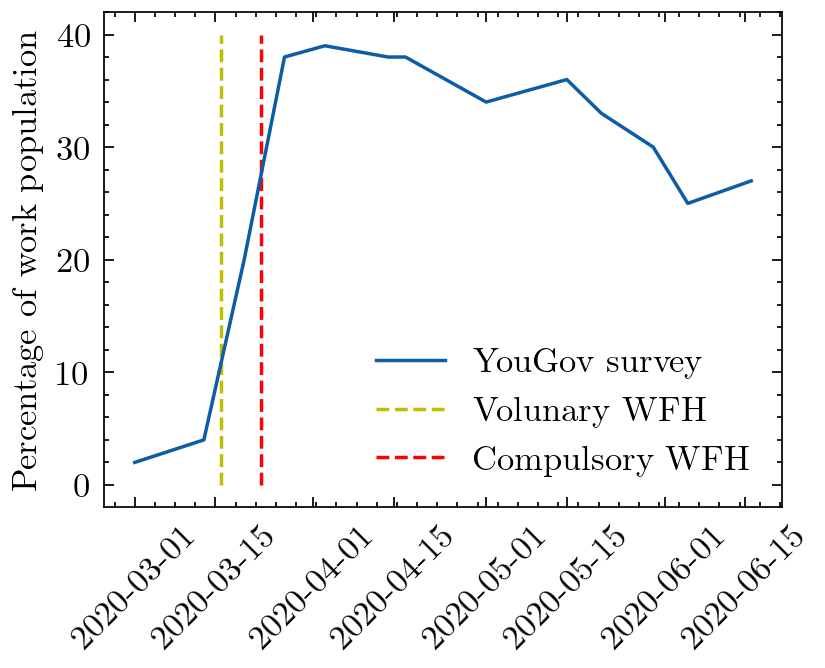
| Voluntary household quarantine | 16/03/2020 |
| Voluntary working from home | 16/03/2020 |
| Voluntary avoidance of leisure venues | 16/03/2020 |
| Social distancing | 16/03/2020 then 23/03/2020 ('stay at home') |
| Shielding of vulnerable population | 16/03/2020 |
| Closure of schools and universities | 20/30/2020 |
| Closure of leisure venues | 21/03/2020 |
Case isolation, shielding and quarantine
Case isolation is the default policy in the model
Implementation:
- Anyone with symptoms of COVID-19 must stay at home
- Anyone over a certain age must stay at home
- People staying at home can still infect other members of the household
shielding:
        min_age: 70
        complacency: 0.7
        start_time: 2020-03-16
        end_time: 2020-07-04

quarantine:
        n_days: 7 # for the symptomatic person
        n_days_household: 14 # for the housemates
        household_complacency: 0.6
        start_time: 2020-03-16
        end_time: 2021-07-04
Leisure avoidance and closure
Implementation:
- Leisure venues can be closed or avoided by type
close_leisure_venue:
        start_time: 2020-03-21
        end_time: 2020-07-04
        venues_to_close: ['pub', 'cinema', 'care_home_visit']
change_leisure_probability:
start_time: 2020-03-21
end_time: 2020-07-04
leisure_activities_probabilities:
household_visits:
men:
0-64: 0.50
65-100: 0.25
women:
0-64: 0.50
65-100: 0.25
leisure_activities_probabilities:
care_home_visits:
men:
0-100: 0.05
women:
0-100: 0.05School and university closure
Implementation:
- Schools can be closed by year group
- Universities fully close
close_schools:
        start_time: 2020-03-20
        end_time: 2020-07-04
        years_to_close: all
        full_closure: False

close_universities:
        start_time: 2020-03-20
        end_time: 2020-10-01
School and university closure
Implementation:
- Schools can be closed by year group
- Universities fully close
close_schools:
        start_time: 2020-03-20
        end_time: 2020-07-04
        years_to_close: all
        full_closure: False

close_universities:
        start_time: 2020-03-20
        end_time: 2020-10-01
Company closure
Implementation:
- Identify all SIC codes of companies closed and assigned workers as 'furloughed'
- Identify all SIC codes of companies containing key workers and assign workers as 'key'
- All remaining workers assigned 'random'
Social distancing
Implementation:
- Beta reduction by group
social_distancing:
        start_time: 2020-03-16
        end_time: 2021-07-04 # currently unknown
        beta_factor:
                box: 0.5
                pub: 0.5
                grocery: 0.5
                cinema: 0.5
                commute_unit: 0.5
                commute_city_unit: 0.5
                hospital: 0.5
                care_home: 0.5
                company: 0.5
                school: 0.5
                household: 1.0
                university: 0.5
"The strength of association was larger with increasing distance (2.02 change in RR per m)"
Chu et al., Lancet (2020)
Examples
Copy of JUNE - IDAS
By aidansedgewick
