Welcome


bit.ly/2aq5lf9
SSID: Studio_B_5G
Password: JP0!ntbv
Prashant Palikhe


prashantpalikhe
@prashantpalikhe
#694877

Prashant Palikhe
prashantpalikhe
@prashantpalikhe
#694877

(236 * 22 * 12) / 1440 =
~ 43 days


LETS BUILD AN APP!!!
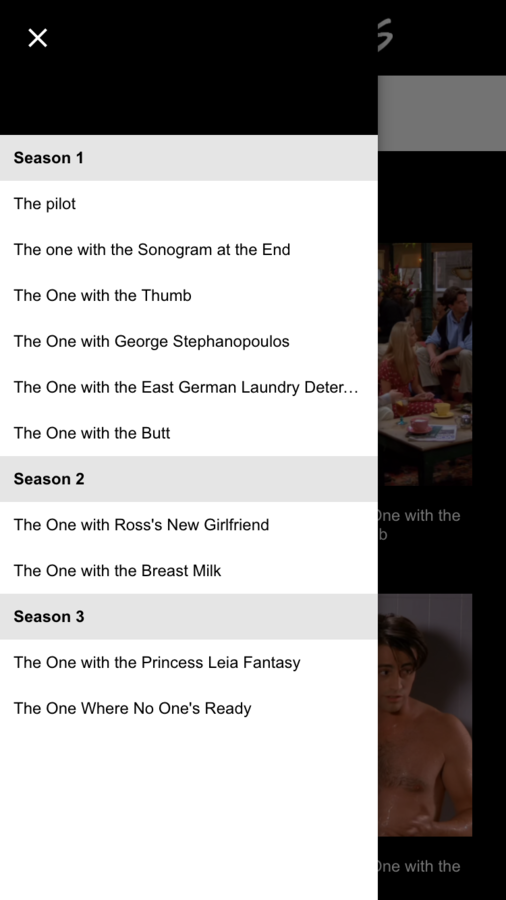


FRIENDSFLIX
LETS GO!
PRO TIPS
- console.time/timeEnd
- console.warn/info/error
- console.group
- console.table
- inspect
- debug/undebug
- monitor/unmonitor events
- sensors
- SNIPPETS!!


Umar Hansa
Addy Osmani
Paul Irish
@umaar
@addyosmani
@paul_irish
Chrome Docs
Github

THANK YOU
Chrome DevTools 02-08-2016
By ajrkemp
Chrome DevTools 02-08-2016
Chrome DevTools come with lots of features that allow developers to debug problems faster, stay productive and profile their apps for bottlenecks. I want to share my workflow on Chrome DevTools along with some handy tips and tricks. Some of the features that I will talk about are: - Profiling load-time performance using network waterfall view - Profiling runtime performance using timeline view - Auditing web app for memory leaks - Emulating networks and devices capabilities - Staying productive with shortcuts - Debugging in the devtool


