DECISION TREES ASSIGNMENT
Akhil Stanislavose
September 20, 2016
CODE
There is a lot of code, mostly repetitive, which I could not put on the slides as the lines are long and it will be difficult to read off the slides. So I have put the entire code on an IPython Notebook which can be accessed at
TASK 1
Exploring the Dataset
-
How many examples?
-
How many positives (survived)?
-
How many negatives (did not survive)?
EXCEL / CALC / NUMBERS
use filters and functions
USE A SCRIPTING LANGUAGE
PYTHON
RUBY
JS
OPEN CSV IN RUBY
require 'csv' csv = File.read('/path/to/titanic.csv')dataset = CSV.parse(csv, :headers => true)puts dataset.count# => 891
FILTERING RECORDS
How may died and survived?
died = dataset.select { |e| e['survived'] == '0' }.count
# => 549

survived = dataset.select { |e| e['survived'] == '1' }.count
# => 342
ENTROPY
AND
GINI
ENTROPY
def entropy(probablities) probablities.reduce(0.0) do |sum,p|if p > 0 sum += p * Math.log2(p)elsesum += 0end end * -1 end
GINI
  def gini(probablities)
    probablities.reduce(0.0) do |sum,p|
      sum += p * (1 - p)
    end
  end
PURITY
 def purity(mixtures, &block)
   purity = mixtures.reduce(0.0) do |sum,m|
     size = m.reduce(:+).to_f
     measure = yield(m.collect { |n| n/size })
     sum += size > 0 ? size * measure : 0
   end
   purity / mixtures.flatten.reduce(:+)
 end
ENTROPY & GINI OF DATASET
  died     = dataset.select { |e| e['survived'] == '0' }.count
  survived = dataset.select { |e| e['survived'] == '1' }.count

  dataset_entropy = purity([[died,survived]]) { |ps| entropy(ps) }
  dataset_gini    = purity([[died,survived]]) { |ps| gini(ps) }

  puts "Entropy of dataset = #{dataset_entropy}"
  puts "Gini of dataset    = #{dataset_gini}"

  # Entropy of dataset = 0.9607079018756469
  # Gini of dataset    = 0.4730129578614427
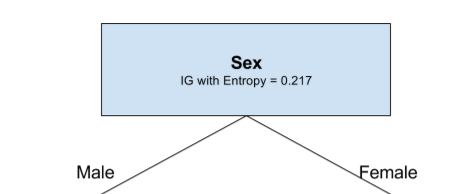
IG after gender split using Entropy
0.2176601066606143
IG after gender split using Gini
0.13964795747285225
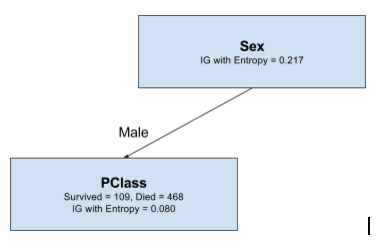
IG after pclass split using Entropy
0.08383104529601149IG after pclass split using Gini
0.05462157677138346IG after embarked split using Entropy
0.024047090707960517
IG after embarked split using Gini
0.015751498294317823
TASK 2
BUILD SIMPLE
DECISION TREE
IG(GENDER)
>
IG(PCLASS)
>
IG(EMBARKED)
ROOT NODE
SPLIT MALES BY
EMBARKED
AND
PCLASS
FIND IG IN EACH CASE
IG(MALE-PCLASS)
>
IG(MALE-EMBARKED)
TREE
WE JUST NEED 2 LEVEL TREE
SO WE USE
PLURALITY-VALUE
The function PLURALITY-VALUE selects the most common output value among a set of examples, breaking ties randomly.
TREE
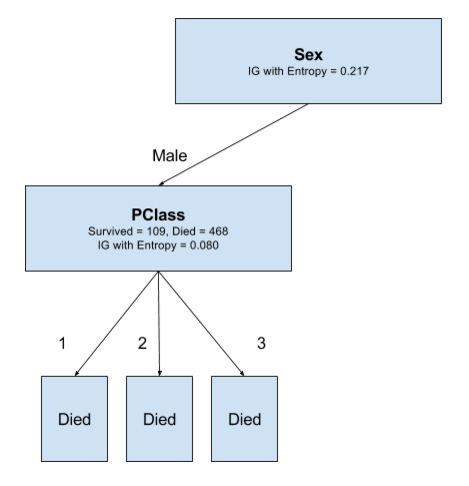
DIED(P1) > SURVIVED(P1)
DIED(P2) > SURVIVED(P2)
DIED(P3) > SURVIVED(P3)
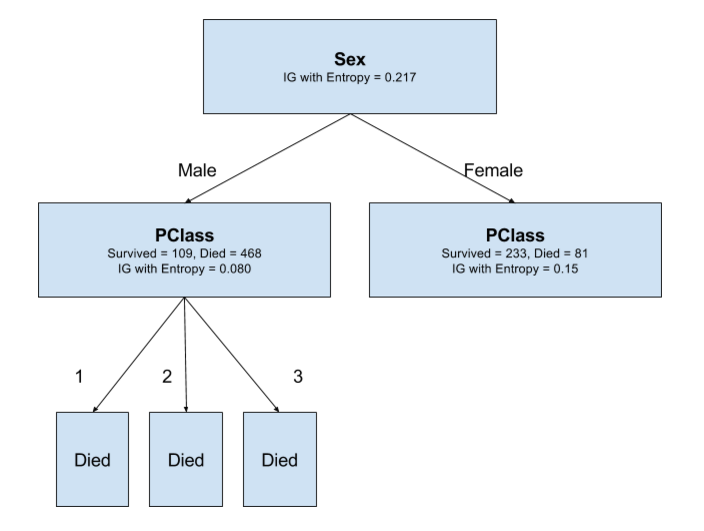
SPLIT FEMALES BY
EMBARKED
AND
PCLASS
FIND IG IN EACH CASE
IG(FEMALE-PCLASS)
>
IG(FEMALE-EMBARKED)
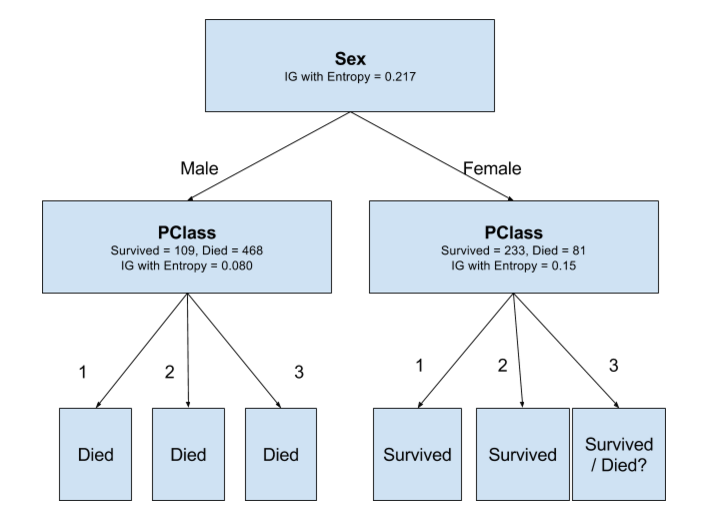
TREE
USE PLURALITY-VALUE
PERFORMANCE
If we look at the tree I have made it is very evident that
if the test example
is a female then she will survive
else if male he dies.
For simplicity if we use our entire training set as the test set,
predicted outcome will be
577 will die
and
314 will live
But from the data we know that actually only
549 dies
and
342 survives
Number of incorrectly predicted
109 male + 81 female = 190
Error percentage = 21%
Success percentage = 79%
WEKA
FIN.
Questions?
TITANIC DATASET
By akhil stanislavose


