eDreams ODIGEO test
Alejandro Casamajor
Section 1
● Which elements of the checkout funnel should be tracked?
I think the most important element here is the Conversion Rate. We have to focus on how both the Web Conversion Rate (% of users who see the product on the list) and the Click Conversion Rate (% of users who actually click and enter the shoe profile) have changed on the Shoe Selection 2 version for the Munich shoes.
The Web CR will now be close to, if not 100%, for the cheapest Munich shoe, since it appears the first one on the list. However, the Click CR will almost certainly decrease, because now not only users that were actually searching for that concrete shoe will see it, but also a huge amount of users who weren't necessarily interested in that concrete shoe.
After focusing on the cheapest Munich shoe, we will also have to see how the Click CR of all the Munich shoes has changed.
● Which KPIs should be defined to measure the effect of the change?
Web Conversion Rate, Click Conversion Rate, Purchase Conversion Rate, % of Munich orders vs Total Orders, # of cancelled orders...
● When do we consider the change to be successful?
Since our goal is to improve Munich sales, I would consider the change to be successful once the total Munich revenue for a x period of time (lets say one month) is higher than for the previous month (before making the changes). After the changes, the total number of orders for the cheapest Munich shoe will certainly increase, but this could cause a decrease on the other Munich shoes, so the Average Order Value for the Munich shoes will decrease. Nevermind, if the total revenue coming from Munich increases, to me it would be a success.
BUSINESS PART
Section 2
● Are we impacting our overall sales (either positively or negatively) by promoting more expensive content?
By promoting more expensive content we will improve the Average Order Value, but we will certainly decrease the total number of orders. This could be either positive or negative, we would have to look at the total revenue (AOV * #orders) to figure out.
● Are users selecting/purchasing different products on the Shoe Selection 2 version?
We will have to look at the # Munich orders vs # Total orders KPI, and compare it to the data we had before.
● Are there some specific scenarios/conditions in which the user is more likely to select the recommended result?
Yes, one in which a recurrent costumer reduces his/her purchase interval (users sees the offer and purchases before he/she would have do it in normal conditions)
Also, someone who has never bought Munich purchases after seeing the offer.
● Is the behavior different when the cheapest result is also the recommended one compared to when it is not?
I think it is. Munich will sell more when the offered shoe is not the cheapest one on the list.
● Any other aspect you find relevant to analyze?
I think it's important to notice that the more orders, the more shipments we have to make, so this might affect the equation of the first question of this section (AOV * #orders = total revenue).
Section 3
Assume that among the experiment results, we got the following:
● +5% Increase in Clickthrough Rate between the pages “Shoe Selection” -> “Billing Data”
● -3% Decrease in ClickThrough Rate between the pages “Billing Data” -> “Confirmed Purchase”
The team decided to roll out the feature; however, they’re thinking about doing a new test to find out why people decreased the Clickthrough rate in “Billing Data” -> “Confirmed”. The team wants to conduct a new AB and want your input (assume that you can track/store all the data that’s possible)
● What could be the reasons that drive this decrease? What hypothesis do you have? (i.e. the decrease in clickthrough rate in “Billing Data” -> “Confirmed” is due to…).
Stock break: Users try to purchase one concrete size that has run out due to the huge amount of sales caused by the offer.
Also, people curiosity: a lot of users will click and enter the shoe profile just because it is on offer.
● Which metrics would you like to use to prove/disprove your hypothesis and how would you do the analysis? (i.e. To prove the decrease I would use X KPIs and I would do Y analysis).
Number of Orders, Total Revenue, Average Order Value, % of Munich Sales compared to the Total Sales...
Section 1 (I'll use Python)
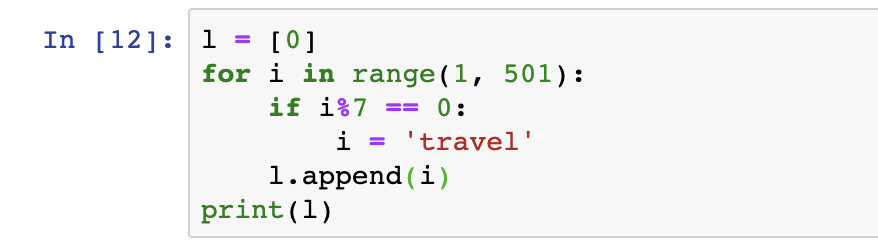
1- Write down a code that prints a sequence of numbers from 0 to 500, but on multiples of the number seven, the word “travel” is printed. Example output:
0,1,2,3,4,5,6, travel,8,9,10,11,12,13, travel,15…
CODING PART
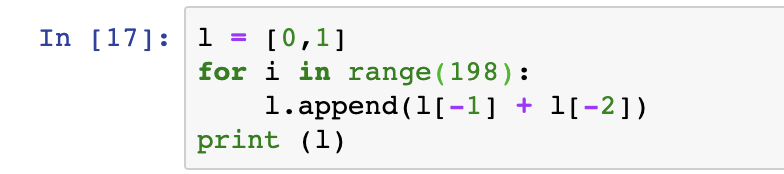
2- Starting with the first two numbers of the sequence (0, 1); write a code that prints out the first 200 numbers of the Fibonacci sequence.
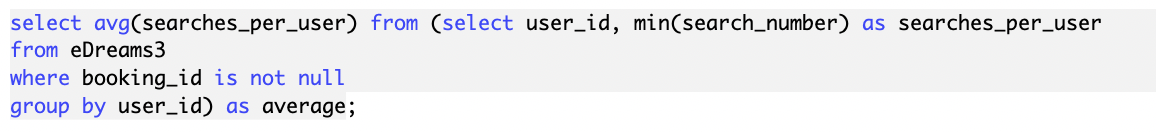
1- A product owner wants to know on average how many searches a user does before booking their FIRST flight (including the search where he purchased the flight). Write down a SQL code that calculates this. (For example, user 123 made 3 searches, and user 789 did 2 searches)
Section 2 (SQL)
2- A product owner wants to know on average what is the number of searches a user does. Write down a SQL query that calculates this.

eDreams test
By Alejandro Casamajor


