EMPLOYEE RETENTION
Objective:

HR Team works on better anticipating unplanned leave or retirement in our Parisian workforce

Workflow
1. Data Cleaning
2. Exploratory Analysis
3. Modelling
4. Takeaways
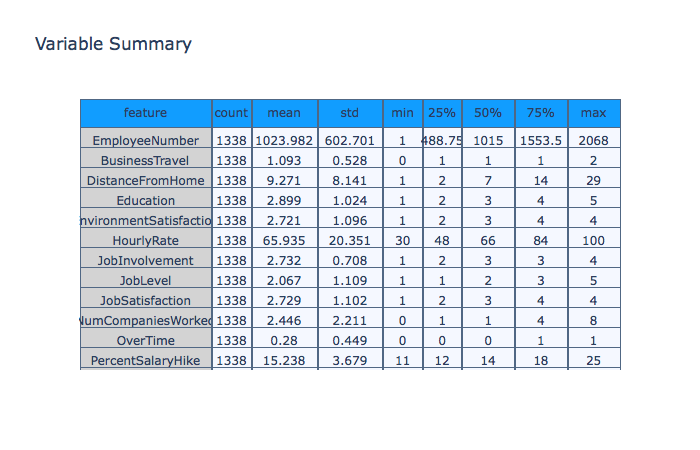
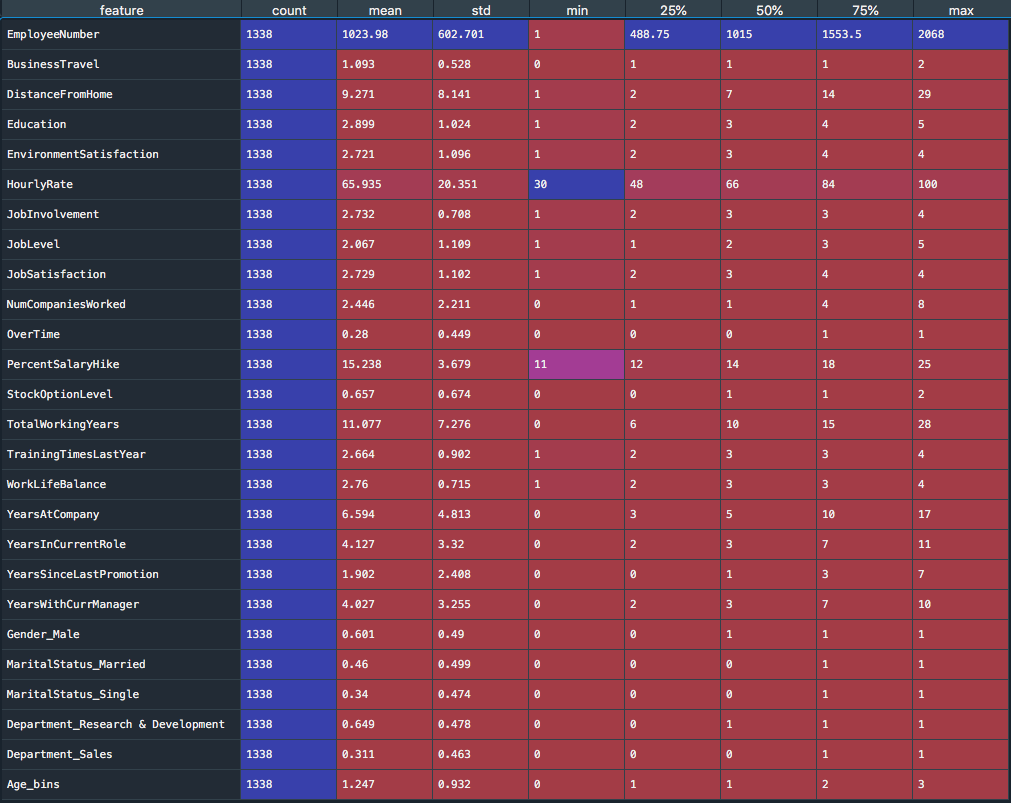
1338 rows
35 columns
26 Numerical columns
9 Categorical columns
No NaN values
After cleaning, our dataset shows 214 resignations (19%) over these past 2 years
y = df.Attrition (0, 1) = Resigned or not
3 retention strategies
Data Cleaning
-
Drop repetitive columns
-
Winsorize 6 columns by visualising box plots
-
Create dummies for Gender, MaritalStatus & Department, drop=True
-
Numerize Attrition & OverTime ({'Yes':1,'No':0}) and BusinessTravel ({'Travel_Rarely':1,'Travel_Frequently':2, 'Non-Travel':0})
-
Create bins for Age ( 30>40>50>60 ), drop=True
==> total of 27 numerical columns
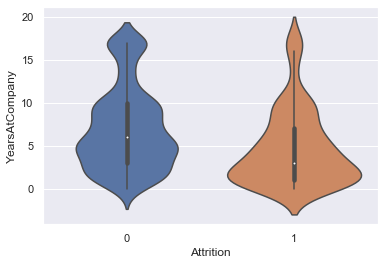
YearsAtCompany Violinplot

Attrition 1 = Employee Left
Insight:
< 5 years of experience at Sanofi, more chance to leave
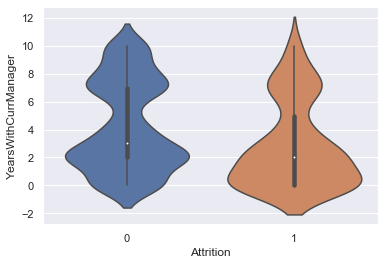
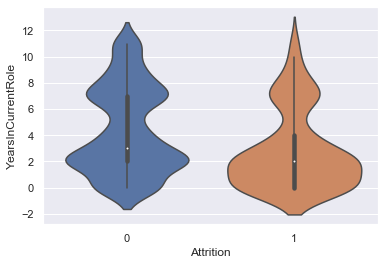
YearsWithCurrManager & YearsInCurrentRole
Violinplots

Attrition 1 = Employee Resigned
Insights:
After 2 YearsWithCurrManager, after 2 YearsInCurrentRole... more people staying
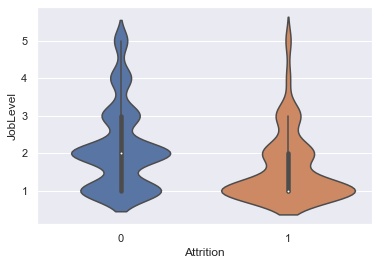
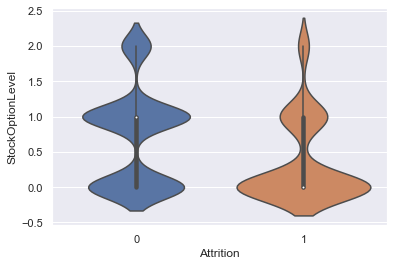
JobLevel & StockOptionLevel
Violinplots
Attrition 1 = Employee Left
JobLevel 1 = Entry-Level position
Insights:
The higher the JobLevel and Benefit Packages ... the less chance of leaving
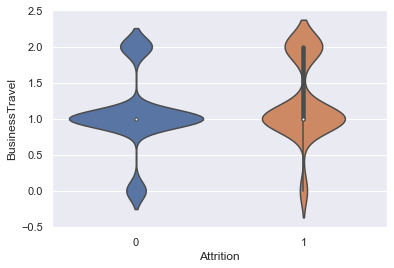
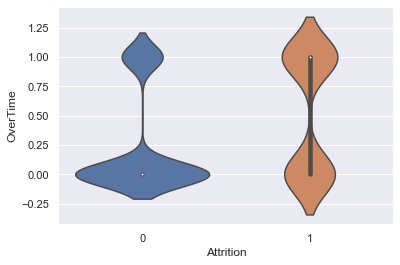
BusinessTravel & OverTime
Violinplots
Attrition 1 = Employee Left
1 = Casual Businesstrip or overtime
Insights:
Travelling for work and doing overtime affects retention ... less resignations for 0
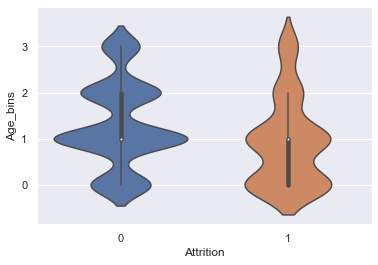
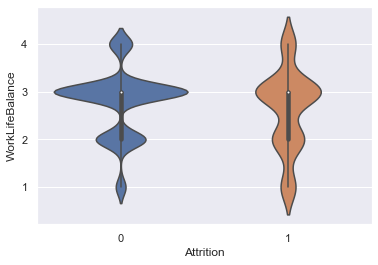
WorkLifeBalance & Age
Violinplots

Attrition 1 = Employee Left
WorkLifeBalance 4 = Employee highly values
Insights:
< 30 years old or Work-life balance highly valued... more risk to see the employee leave
Other Insights
No impact

PercentSalaryHike; DistanceFromHome; HourlyRate; NumCompaniesWorked; YearsSinceLastPromotion;
EnvironmentSatisfaction;
JobSatisfaction;
People say what you wanna hear

EnvironmentSatisfaction & JobSatisfaction,
probably explained by a response bias
(internal survey)
Let's check these assumptions with our models
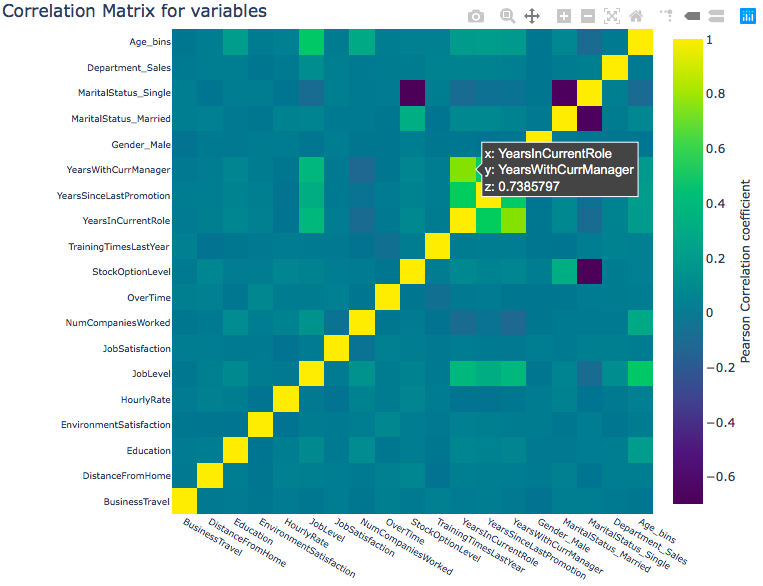
VIF Test performed

Remaining columns saved in X variables
Correlation Matrix for X
Input Data Selection
Input Data
MODELS
Priorities:
1. Maximise AUC, the model's precision
2. Minimise False Negative rate (= predicted no resignation but the employee left)

# Model 1: Logistic Regression
# Model 2: Logistic Regression w/ normalizing HourlyRate
# Model 3 & 4: KNearest Neighbors
# Model 5: Naive Bayes Model
# Model 6 & 7: Decision Tree
# Model 8 & 9: Random Forest
# Model 10: Support Vector Machine
# Model 11: Nu SVC
For every model
lst=[]
for i in range(1,13):
FP = eval(f'conf{i}')[0][1]
FN = eval(f'conf{i}')[1][0]
TP = eval(f'conf{i}')[1][1]
TN = eval(f'conf{i}')[0][0]
FNR = FN/(TP+FN)*100
FPR = FP/(FP+TN)*100
ACC = (TP+TN)/(TP+FP+FN+TN)*100
AUC = eval(f'model{i}_roc')
lst.append([i,FNR,FPR,ACC,AUC])
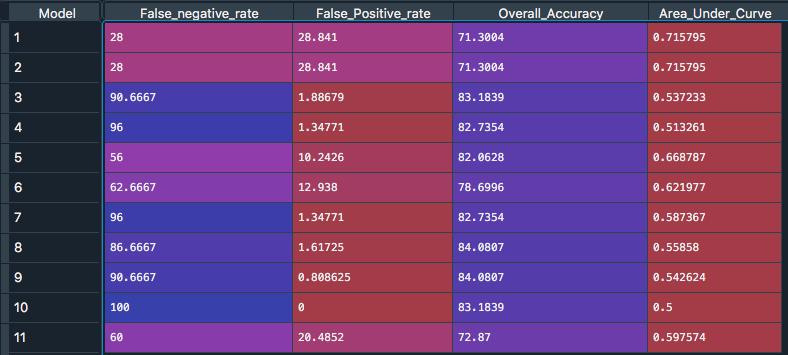
results = pd.DataFrame(lst, columns=['Model','False_negative_rate',
'False_Positive_rate','Overall_Accuracy','Area_Under_Curve']).
False Negative Rate         False Positive Rate

Area Under the Curve        Overall Accuracy
Model Evaluation
Priorities:
1. Maximise AUC, the model's precision
2. Minimise False Negative rate (= predicted no resignation but the employee left)
.
Logistic Regression with PCA
Priorities:
1. Maximise AUC, the model's precision
2. Minimise False Negative rate (= predicted no resignation but the employee left)

# Model 1: Logistic Regression
# Model 12: Logistic Regression with X_train_PCA & X_test_PCA


AUC = 0.54 & FNR = 54.6
We keep our X
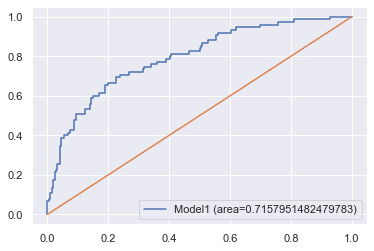
FINAL MODEL: Logistic Regression without PCA
AUC = 0.71 & FNR = 28
Expression:
0.64*BusinessTravel + 0.033*DistanceFromHome - 0.046*Education - 0.39*EnvironmentSatisfaction + 0.003*HourlyRate - 0.4*JobLevel - 0.39*JobSatisfaction + 0.14*NumCompaniesWorked' + 1.4*OverTime - 0.69*StockOptionLevel - 0.07*TrainingTimesLastYear - 0.01*YearsInCurrentRole + 0.02*YearsSinceLastPromotion - - 0.11*YearsWithCurrManager + 0.34*Gender_Male + 0.23*MaritalStatus_Married + 0.44*MaritalStatus_Single + 0.69*Department_Sales - 0.29*Age_bins
Employee Retention Strategy
Key take aways:

1. Major focus on Sales department (high turnover) and entry-level position

2. Minimise business trips and anticipate high-demand cycles to  foster a work environment pro work-life balance

3. Minimise overtime as much as possible and reward with stock options or training sessions
deck
By Alexis Lacabane

