
The Science of Signals: Mastering Telemetry for Observability

Belgium 2014
Alex Van Boxel
Almost 30 years in the sector
Mostly as Software Engineer
Web - 3D - Middleware - Mobile - Big Data
More recent as Architect
Data - SRE - Infrastructure
Community
Apache Beam contributor
OpenTelemetry Collector contributor
Collibra
Principal Systems Architect
Maximilien Richer
10 years of Linux and o11y
Software engineer
Hosting provider & ISP experience
Community
Self-hosting at deuxfleurs.fr
Garage geo-distributed S3 engine
https://garagehq.deuxfleurs.fr/
Collibra
Staff Production Engineer, SRE
"That Grafana guy"
A data intelligence platform powered by active metadata
AI Governance
Data Catalog
Data Governance
Data Lineage
Data Notebook
Data Privacy
Data Quality & Observability
Protect
Belgian Origin but now a global company

Agenda
HISTORY

Metrics
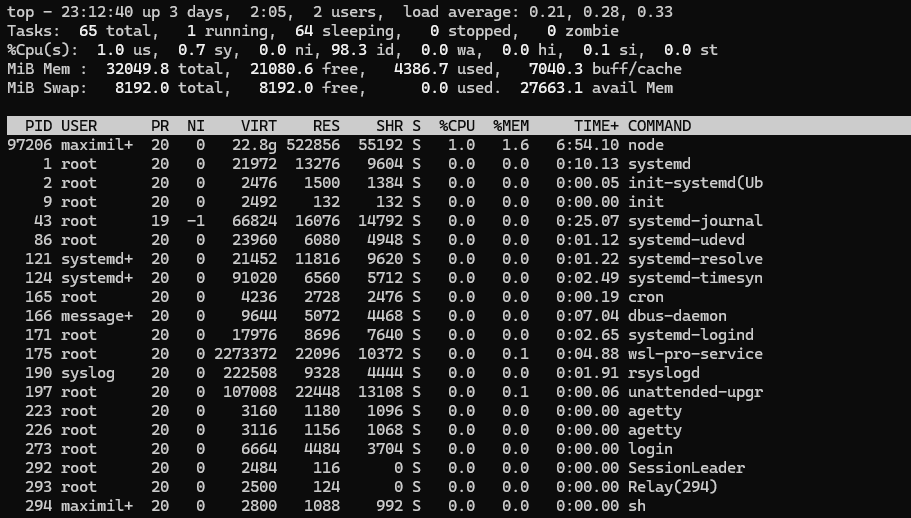
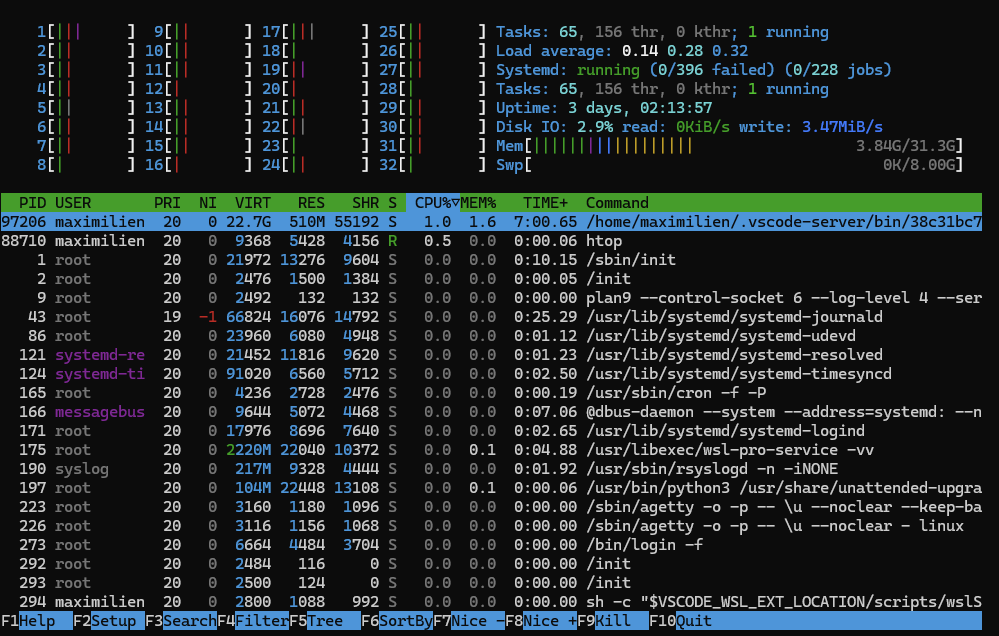
$ uptime
23:13:08 up 3 days, 2:06, 2 users, load average: 0.27, 0.29, 0.33
Metrics are all around
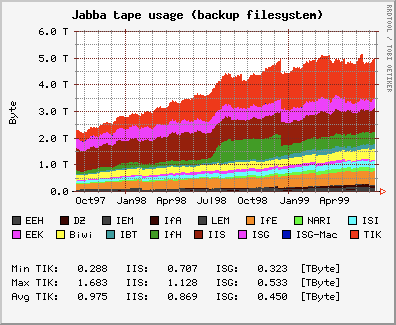
RRDtool, released July 1999 (25 years ago)
- metric database with circular buffer
- fixed interval, automatically consolidated
- graphs are images (bitmaps)
- still used today (Nagios...)
The beginning of time series
- collectd, StatsD
- Graphite, Carbon (2006)
- InfluxDB and telegraf (2013)
Breaking up collection, storage and display
collectd
statsd
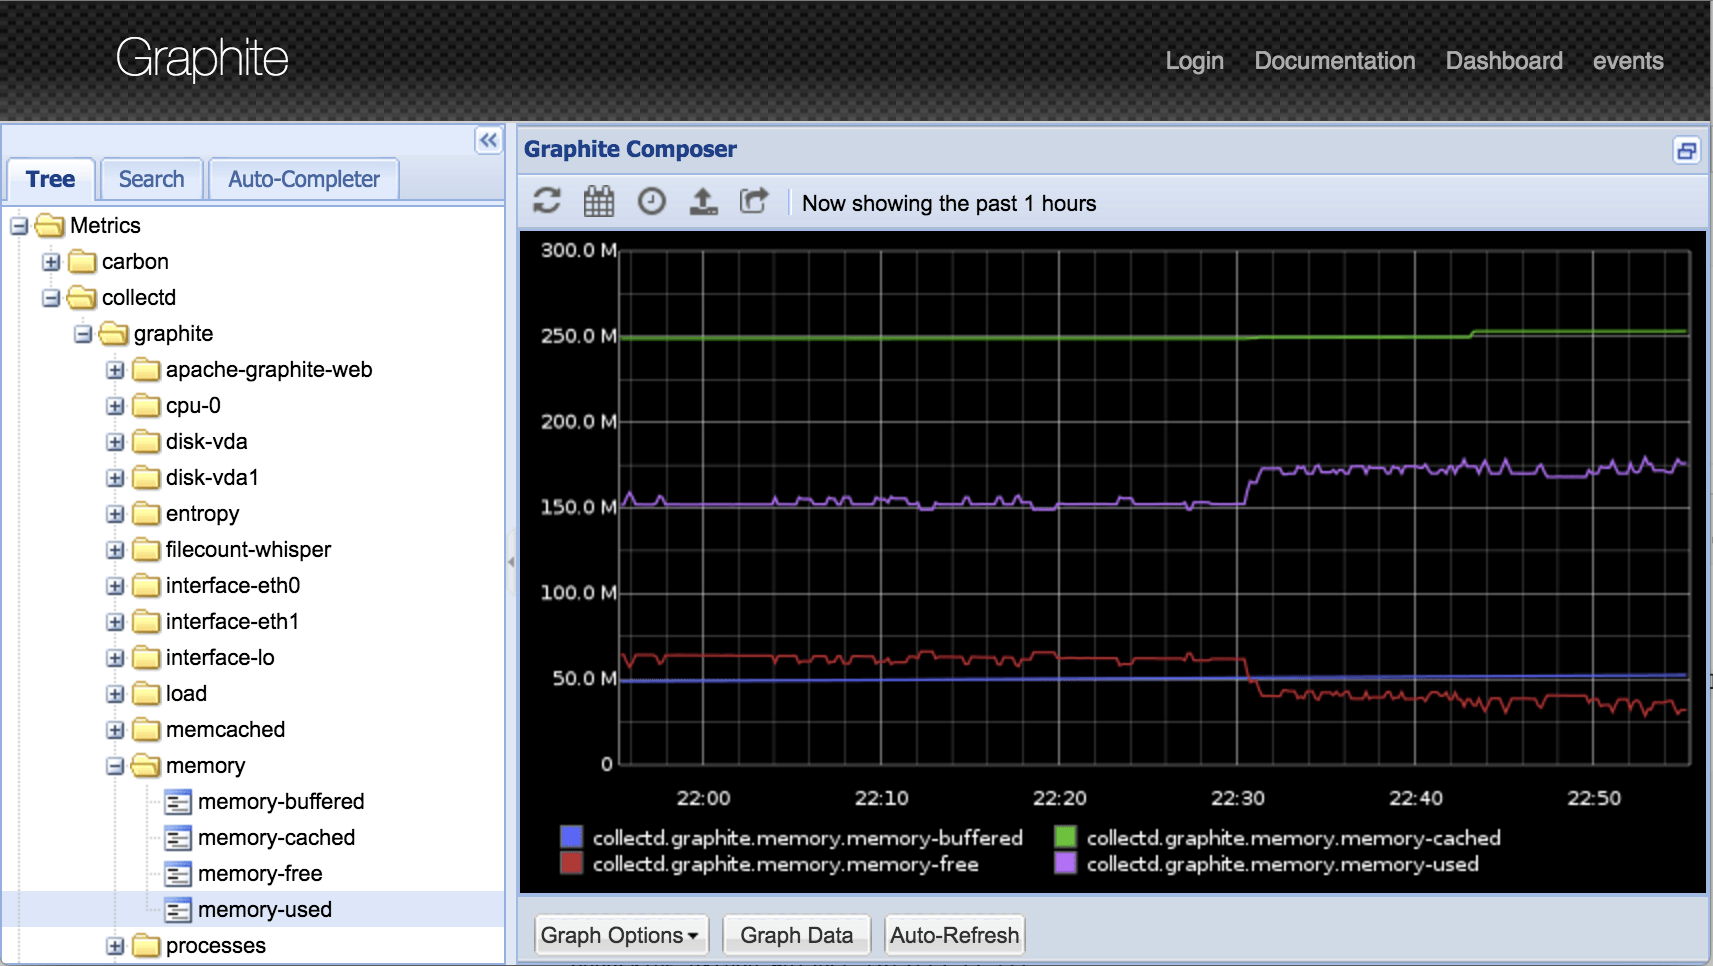
graphite
The graphite web interface, from the graphite kickstart
push
query
gather and broker metrics
store and serve query
Prometheus and the pull model
application
exporter
prometheus
pull
query
expose metrics
store and serve query
- Born at SoundCloud (2012)
- No central data collection
- No big storage backend
- "slice & dice" query language
- Associated alert manager
alert manager
dashboard tool
Text
Text
api.http.requests.get.200 <value> <epoch_timestamp>Metric protocols over time
api_http_requests method="GET",endpoint="/api",status="200" <value> <epoch_timestamp>api_http_requests_total{method="GET",
endpoint="/api", status="200"} <value>Carbon
InfluxDB line protocol
Prometheus
Exporter
api.http.requests.get.200 <value> <epoch_timestamp>Metric protocols over time
api_http_requests method="GET",endpoint="/api",status="200" <value> <epoch_timestamp>api_http_requests_total{method="GET",
endpoint="/api", status="200"} <value>Carbon
InfluxDB line protocol
Prometheus
Exporter

Logs
[278968.646837] systemd-journald[43]: Time jumped backwards, rotating.
Log structure
Plain text
Structured text
Time jumped backwards, rotating.
Exported 182 nodes from 1 roots in 0.038s
172.169.5.255 - - [01/Oct/2024:22:18:13 +0000] "GET / HTTP/1.1" 200 1608 "-" "Mozilla/5.0 zgrab/0.x"
  .   ____          _            __ _ _
 /\\ / ___'_ __ _ _(_)_ __  __ _ \ \ \ \
( ( )\___ | '_ | '_| | '_ \/ _` | \ \ \ \
 \\/  ___)| |_)| | | | | || (_| |  ) ) ) )
  '  |____| .__|_| |_|_| |_\__, | / / / /
 =========|_|==============|___/=/_/_/_/
 :: Spring Boot ::        (v2.3.2.RELEASE)
.
.
.
... : Started SpringLoggerApplication in 3.054 seconds (JVM running for 3.726)
... : Starting my application 0
ASCII art
JSON logs, the end of the scale
JSON logs
{
"timestamp": "2022-01-18T11:12:13.000Z",
"level": "INFO",
"logger": "c.c.i.a.w.a.UserAuthenticationListener",
"message": "User demo logged in for the 84th time as admin", 🧙
"app_username": "demo",
"session_id": "ea4811878fbd8780367c16fb64ad6658",
"session_timeout_ms": 86400000,
"app_product_permissions": "viewer,editor,admin",
"user_consecutive_login": 84,
"app_action": "LOGIN",
"client_ip": "127.0.0.1"
}
The log format scale
🧙 Human
🤖 Machine
ASCII art
Plain Sentences
Formated, key-values pairs
JSON-format
Binary-encoded (eg. gRPC, WAL)
Log backends
Flat files
Indexed storage
Columnar storage
Syslog...
ELK stack, Graylog
Grafana Loki, Clickhouse
TRACES

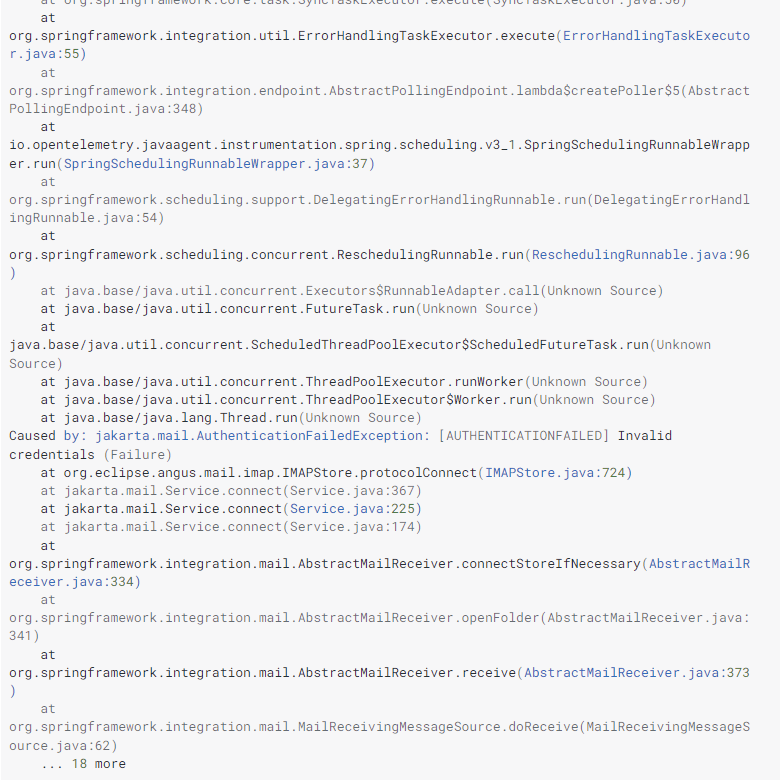
The (stack)traces
The issues
- Single service only
- Slowness?
- No metadata
- WAY too much data
...and 18 more
Traces - requirements
- Track latency and errors
- Across services
- Stitch things together
- Provide context
Traces require deep code integration
Traces protocols over time
Dapper (Google, 2010)
Zipkin (Twitter, 2012)
Jaeger (Uber, 2015)
OpenTracing (2016)
W3C tracing context (2019)
OpenTelemetry (2019)

https://xkcd.com/927/
OpenCensus (Google, 2018)
2014
Men and The Machine
Dashboarding

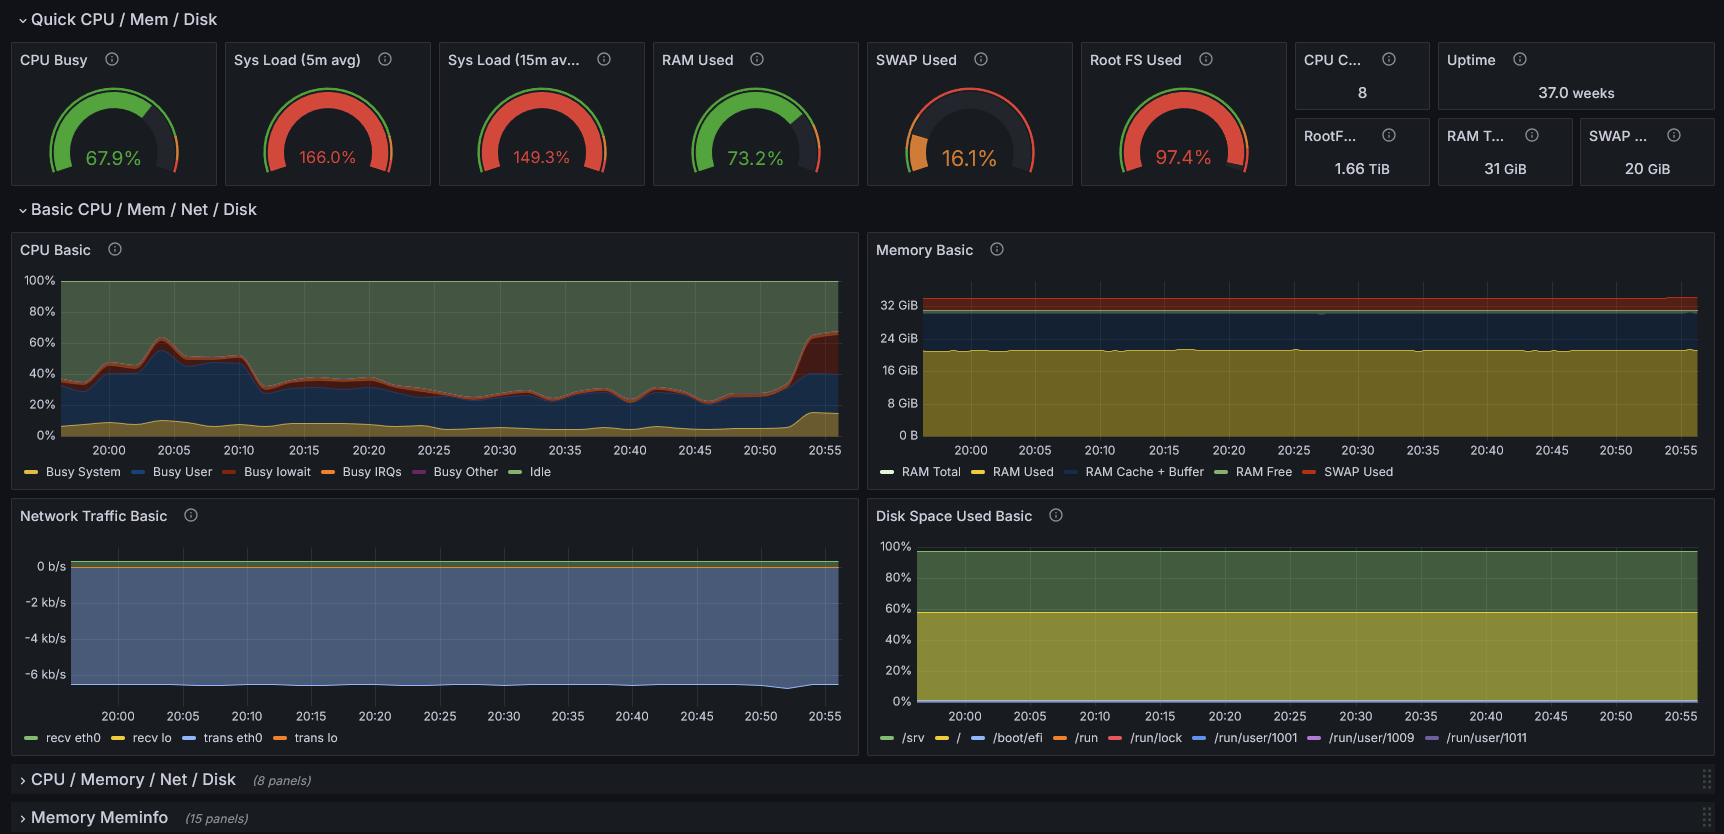
DashboARDS
A PICTURE IS WORTH A THOUSAND WORDS
DashboARDS
A PICTURE IS WORTH A THOUSAND WORDS
DashboARDS
shape your data to show what matters
- Dashboarding tools are limited
- Query languages are limited
- Humans perception is limited
Plan !
...and remove what you don't use!
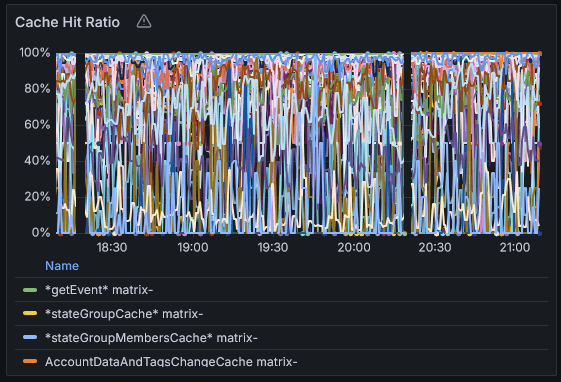
DashboARDS
Keep things simple, use text, units and tooltips
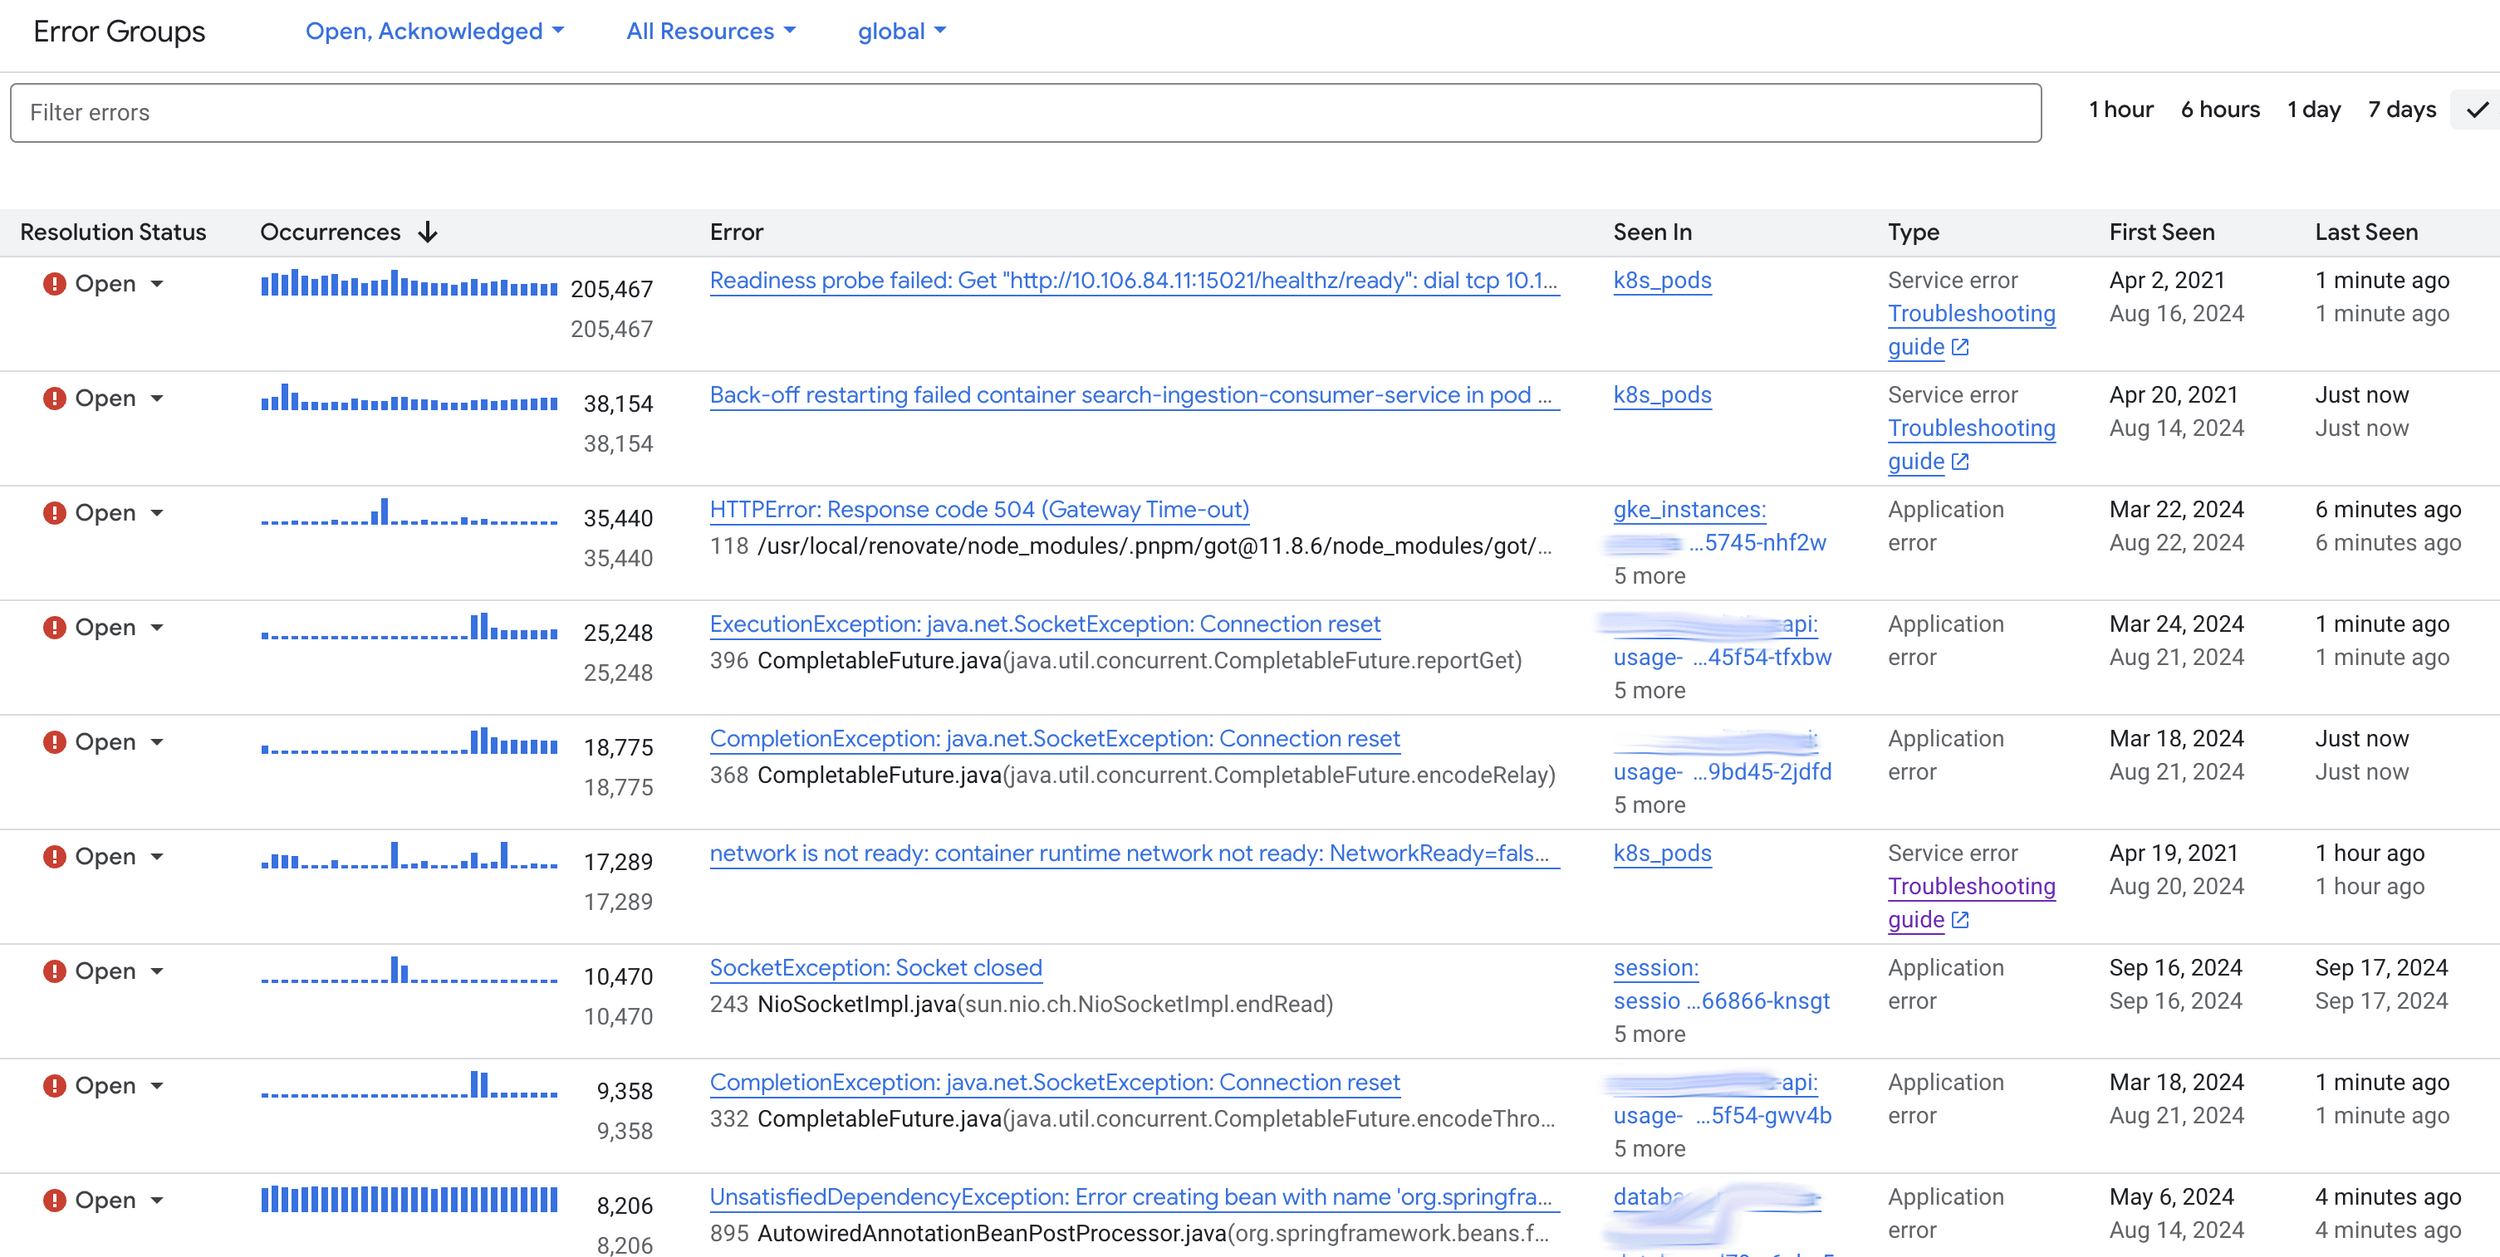
Error Reporting

Error Reporting
Sourced from logs
Text
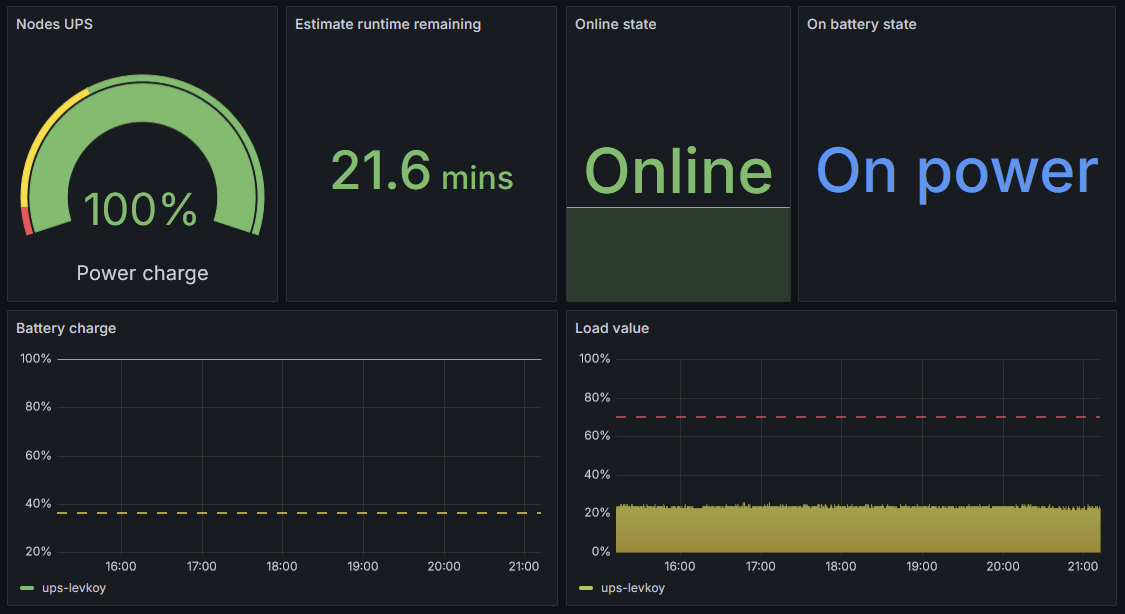
Alerting & Notifications

Alerting is horrible
alerts vs. notifications
An alert MUST NOT fire unless there is an issue
We do not alert on planned changes
(maintenance, de-provisioning...)
An alert SHOULD indicate an actual problem
70% CPU is NOT an actual problem
(unless it impacts the service)
The rests are not alerts, they are NOTIFICATIONS or REPORTS
Still important, but not worth waking someone up for
Alerting conditions
let's look at disks
- Alert if the disk is used at >80%
- Alert if the disk is used at >80% OR <25GB free
- Alert if the disk is used at >80% OR <25GB free OR inodes use >80%
What metrics do we need?
What about the time window?
Alert check
Disk 75%
T
Application write to disk
T+10s
Alert check
Disk 75%
T+60s
Disk full, app delete file
T+40s
Complex conditions
the dependency hell
Service A depends on service B
Service B is down
Who should alert?
Complex conditions
the dependency hell
Service A depends on service B
Service B is down
Who should alert?
1000 instances of service A depends on service B
Service B is down
Who should alert?
Complex conditions
it is just the beggining...
The client cannot reach service A
- Client timeout before the server
- Service A doesn't log anything because the client walked away
- How do we alert?
Complex conditions
it is just the beggining...
The client cannot reach service A
- Client timeout before the server
- Service A doesn't log anything because the client walked away
- How do we alert?
A service is returning 99% of 4xx responses
- Did we break authentication?
- Or is a user just hammering us with bad credentials?
SOME answers
your millage may vary
- Monitor application behavior
- Implement blackbox monitoring, probe as a client
- Implement alerts on lack of traffic
- Implements alerts to be deployed and removed with the workload
- BUT also have some manual alerts
- Alert on things that should NOT work/happen
- Build your maintenance windows INTO the alerts
- Move alerts to reports if you cannot trust them
The Signals
Metrics - Types
The Signals
〞
Metrics are always an aggregation. You lose information.
– Me
Gauge
Up and Down, Up and Down

Gauge
Not everything is like it seems
Gauge
Not everything is like it seems
COUNTER
Up and Up

COUNTER
Up and Up
Counter
Continues Metrics
Counter
Application Restart
Counter
Delta Metrics
Counter
Delta Metrics
Counter
Delta Metrics
Conversion
From Gauge To Counter

Gauge > Counter
Can WE Convert a Gauge to a Counter?
Gauge > Counter
CPU to CPU time
RATE: Gauge > Counter
CPU to CPU time
RATE: Gauge > Counter
CPU to CPU time
Metrics - Histograms
The Signals
HiSTOGRAMS
Aggregate Better
HiSTOGRAMS
Aggregate Better
Exponential Histograms
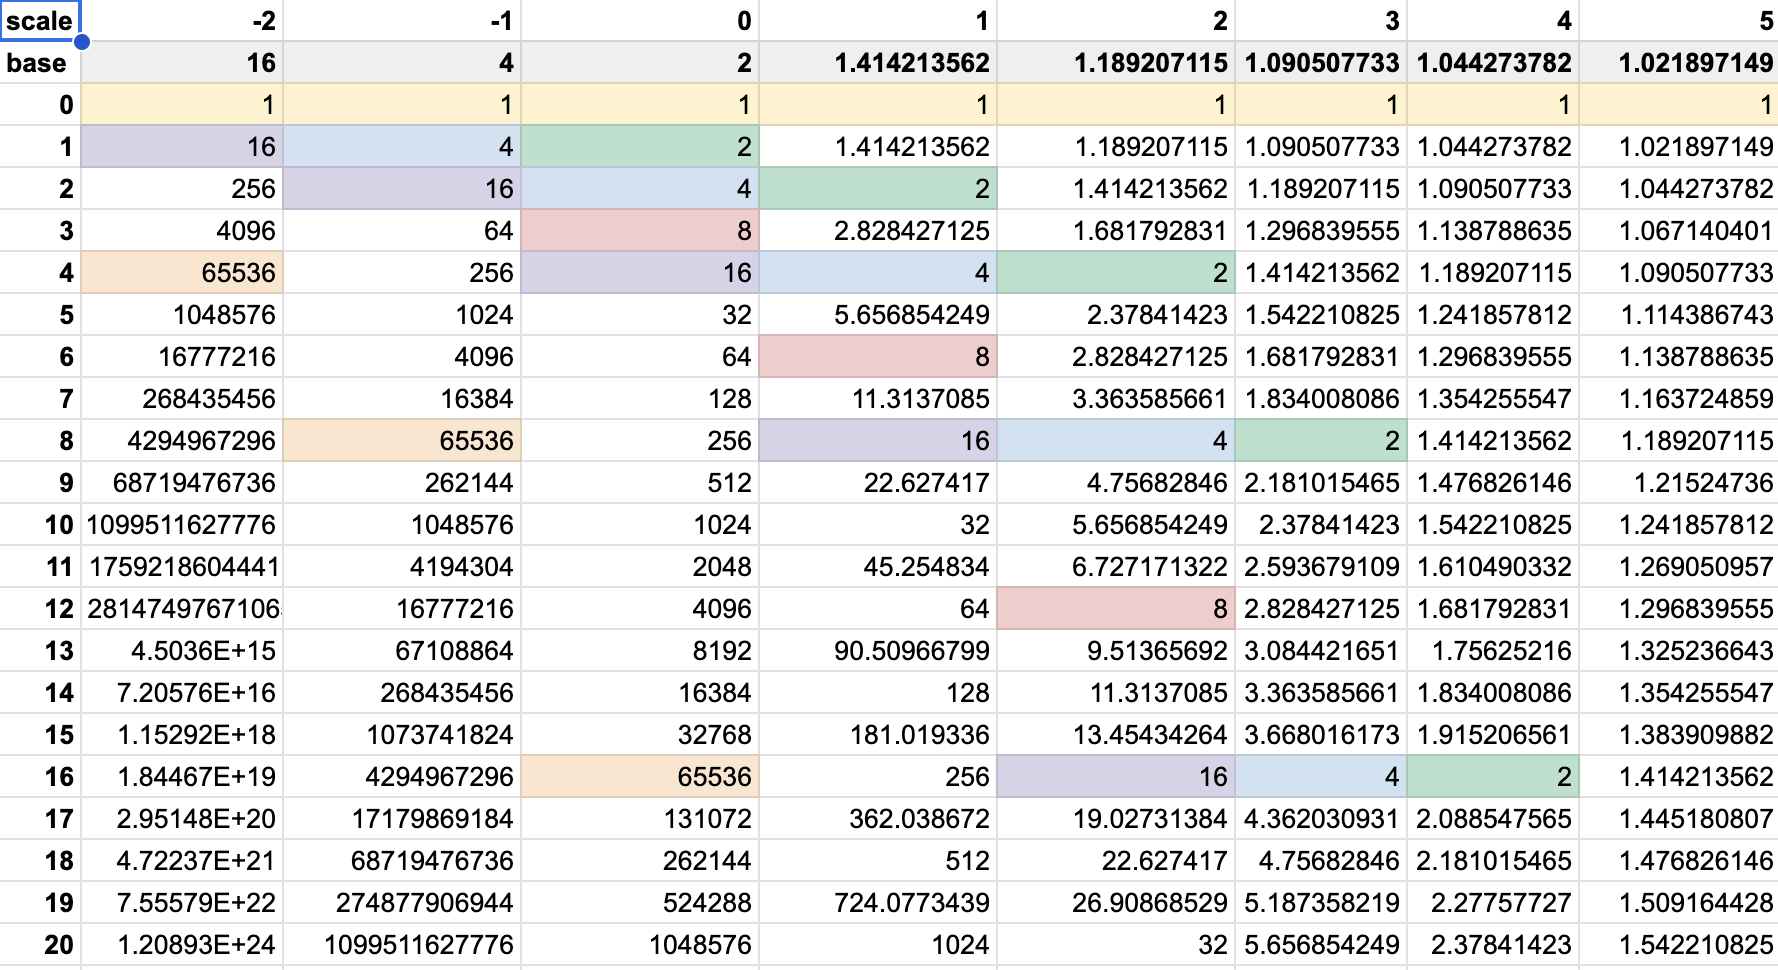
Exponential Histograms
1
2
8
4
| COUNT | 0 |
| # | 0 |
| AVG | 0 |
| hist bytes | 32 |
| raw bytes | 0 |
Exponential Histograms
1
2
8
4
| COUNT | 4.1234 |
| # | 1 |
| AVG | 4.1234 |
| hist bytes | 68 |
| raw bytes | 4 |
4.1234
Exponential Histograms
1
2
8
4
| COUNT | 7.8176 |
| # | 2 |
| AVG | 3.9088 |
| hist bytes | 68 |
| raw bytes | 8 |
3.6942
Exponential Histograms
1
2
8
4
| COUNT | 12.9287 |
| # | 3 |
| AVG | 4.3096 |
| hist bytes | 72 |
| raw bytes | 12 |
5.1111
Exponential Histograms
1
2
8
4
| COUNT | 17.5643 |
| # | 4 |
| AVG | 4.3911 |
| hist bytes | 72 |
| raw bytes | 16 |
4.6356
Exponential Histograms
1
2
8
4
| COUNT | 21.8207 |
| # | 5 |
| AVG | 4.3641 |
| hist bytes | 72 |
| raw bytes | 20 |
4.2564
Exponential Histograms
1
2
8
4
| COUNT | 25.8206 |
| # | 6 |
| AVG | 4.3034 |
| hist bytes | 72 |
| raw bytes | 24 |
3.9999
Exponential Histograms
1
2
8
4
| COUNT | 29.5572 |
| # | 7 |
| AVG | 4.2225 |
| hist bytes | 72 |
| raw bytes | 28 |
3.7366
Exponential Histograms
1
2
8
4
| COUNT | 34.1006 |
| # | 8 |
| AVG | 4.2626 |
| hist bytes | 72 |
| raw bytes | 32 |
4.5434
Exponential Histograms
1
2
8
4
| COUNT | 37.0351 |
| # | 9 |
| AVG | 4.1150 |
| hist bytes | 72 |
| raw bytes | 36 |
2.9345
Exponential Histograms
1
2
8
4
| COUNT | 42.7585 |
| # | 10 |
| AVG | 4.2759 |
| hist bytes | 76 |
| raw bytes | 40 |
5.7234
Exponential Histograms
1
2
8
4
| COUNT | 42.7585 |
| # | 11 |
| AVG | 5.1153 |
| hist bytes | 96 |
| raw bytes | 44 |
13.5101
Exponential Histograms
1
2
8
4
| COUNT | 42.7585 |
| # | 12 |
| AVG | 5.8141 |
| hist bytes | 96 |
| raw bytes | 48 |
13.5000
Examplar
Exponential Histograms
1
2
8
4
| SUM | 153.7686 |
| # | 32 |
| AVG | 4.8053 |
| hist bytes | 96 |
| raw bytes | 128 |
4.2
Metrics - Characteristics
The Signals
Cardinality
labels and values
Tags (InfluxDB), labels (prometheus), attributes (OpenTelemetry)
serie_name [attributes...] value
Cardinality
labels and values
Tags (InfluxDB), labels (prometheus), attributes (OpenTelemetry)
serie_name [attributes...] value
Attributes have a value space.
http_code :
100, 101, 102, 103, 200, 201, 202, 203, 204, 205, 206, 207, 208, 226, 300, 301, 302, 303, 304, 305, 306, 307, 308, 400, 401, 402, 403, 404, 405, 406, 407, 408, 409, 410, 411, 412, 413, 414, 415, 416, 417, 418, 421, 422, 423, 424, 425, 426, 427, 428, 429, 431, 451, 500, 501, 502, 503, 504, 505, 506, 507, 508, 510, 511
Max cardinality is 64
Cardinality
cardinality estimate: theory
Attributes cardinality can combine
request_count [http_code, http_verb] value
http_verb can be HEAD, GET, POST, PUT, PATCH, OPTIONS, DELETE, LINK, UNLINK (9)
Cardinality
cardinality estimate: theory
Attributes cardinality can combine
request_count [http_code, http_verb] value
http_verb can be HEAD, GET, POST, PUT, PATCH, OPTIONS, DELETE, LINK, UNLINK (9)
Total (theoretical) cardinality is 64 x 9 = 576
Cardinality
cardinality estimate: practice
Unlikely in practice
- HEAD, GET, POST, PUT, DELETE
- 1xx : 101
- 2xx : 200, 201, 202, 204, 299
- 3xx : 301, 302, 304, 307
- 4xx : 400, 401, 403, 404, 405, 406, 409, 426, 460
- 5xx : 500, 501, 502, 503, 504
Total (likely) cardinality : 5 x 23 = 115 (~25%)
Cardinality
in the real word
Keep series cardinality below 10k
Monitor your usage
Drop metrics you don't need
Drop metrics you don't use
Configure software for variable cardinality levels
Only export details when you need them
Pulling vs Pushing
Who is in Control
Depending on the framework
Pull Mode - Prometheus
Push Mode - OpenTelemetry
Metrics - Backend
The Signals
Time Series
how to store datapoints by the billions
TSDB stores time series datapoints
Any database system can be a TSDB
Some are simply more... efficient than others!
Time Series
how to store datapoints by the billions
TSDB stores time series datapoints
Any database system can be a TSDB
Some are simply more... efficient than others!
SPECIFICS
- Write-once
- No arbitrary delete
- Very uniform data (compresses well)
- Downsampling
- Few indices (time, labels)
- Limited query capabilities
Time Series
a few self-hosted solutions
TSDB examples (Apache 2.0 or MIT)
| Solution | Query language(s) | Clustering |
|---|---|---|
| Elasticsearch | Lucene, KQL | Yes |
| Prometheus | PromQL | No |
| InfluxDB (3.x) | Flux | Yes (Enterprise) |
| TimescaleDB | SQL | No |
| VictoriaMetrics | PromQL (extended) | Yes* |
| Grafana Mimir | PromQL | Yes |
Retrieving Metrics
query languages
SQL and Lucene
- Analytic queries
- Custom format
- Mixed payload
- Possible schema issues
Good for...
Log-events containing metrics
PromQL
- Metrics only
- Very efficient
- Need in-order data*
Good for...
Metrics and histograms
*for the vast majority of backend
metric specifics
counter reset & aggregation shortcomings
- Gafana + Lucene = one aggregation
- Challenging to aggregate counters
- Support for counter reset?
Application restart
Controlling Cost
Costs hide everywhere
Re-Aggregation - Spatial
Re-Aggregation - Temporal
Dropping Data
Logs
The Signals
The Oldest tricks in the book
Printf
Manually laying breadcrumbs
This error happened here
Hiding duration and counts in log lines
Logging Frameworks
The beginning of some structure
JUL, Log4J, SLF4J
Appenders and Formatters : JSON, Console, TCP, ...
OpenTelemetry adapts the existing API's

Logging Frameworks
Log Levels
public enum StandardLevel {
    FATAL(100),
    ERROR(200),
    WARN(300),
    INFO(400),
    DEBUG(500),
    TRACE(600),
    ALL(Integer.MAX_VALUE);
}
Context
Mapped DiagNostic Context
ThreadContext.put("ipAddress", request.getRemoteAddr());
ThreadContext.put("hostName", request.getServerName());
ThreadContext.put("loginId", session.getAttribute("loginId"));

void performWork() {
    ThreadContext.push("performWork()");

    LOGGER.debug("Performing work");
    // Perform the work

    ThreadContext.pop();
}

ThreadContext.clear();
Context
Nested DiagNostic Context
ThreadContext.put("ipAddress", request.getRemoteAddr());
ThreadContext.put("hostName", request.getServerName());
ThreadContext.put("loginId", session.getAttribute("loginId"));

void performWork() {
    ThreadContext.push("performWork()");

    LOGGER.debug("Performing work");
    // Perform the work

    ThreadContext.pop();
}

ThreadContext.clear();
Collecting
Agent defines the output
Syslog, journald, Filebeats, OpenTelemetry
StdOut/Err, Network, File
Challenging Parsing
The list goes on and on
Challenging Parsing
The list goes on and on
Use structured logs!
Challenging ownership
who's responsible?
TB of logs per month
300 developers
No accountability
No visibility
Challenging ownership
who's responsible?
TB of logs per month
300 developers
No accountability
No visibility
- Use C4 model for architecture
- Tag logs with a C4 area
- eg. container=backend, component=search
- Keep team aware of their usage
payload limits
blowing things up
2MB+ log line in the wild
Entire queries, value dump, stacktraces
payload limits
blowing things up
2MB+ log line in the wild
Entire queries, value dump, stacktraces
- Limit log line size at application level
- Be upfront with devs
- Separate system to handle error artefacts
TRACES
The Signals
Trace
Lots of Spans
Trace
Can be distributed
Context Propagation
W3c Trace Context
traceparent:
00-0af7651916cd43dd8448eb211c80319c-b9c7c989f97918e1-01
version
trace-id
parent-id
flags

Context Propagation
Baggage
tracestate:
sub=urn:usr:me,ip=127.0.0.1
OpenTelemetry implementation Warning: Baggage is not added automatically to your signals
The Span
...of the trace
{
  "name": "/v1/sys/health",
  "context": {
    "trace_id": "7bba9f33312b3dbb8b2c2c62bb7abe2d",
    "span_id": "086e83747d0e381e",
    "flags": "01"
  },
  "parent_id": "",
  "start_time": "2021-10-22 16:04:01.209458162 +0000 UTC",
  "end_time": "2021-10-22 16:04:01.209514132 +0000 UTC",
  "status_code": "STATUS_CODE_OK",
  "status_message": "",
  "attributes": {
    "net.transport": "IP.TCP",
    "net.peer.ip": "172.17.0.1",
    "net.peer.port": "51820",
    "net.host.ip": "10.177.2.152",
    "net.host.port": "26040",
    "http.method": "GET",
    "http.target": "/v1/sys/health",
    "http.server_name": "mortar-gateway",
    "http.route": "/v1/sys/health",
    "http.user_agent": "Consul Health Check",
    "http.scheme": "http",
    "http.host": "10.177.2.152:26040",
    "http.flavor": "1.1"
  },
}- Name
- Context
- Start - Stop
- Status
The Span
...of the trace
{
  "name": "/v1/sys/health",
  "context": {
    "trace_id": "7bba9f33312b3dbb8b2c2c62bb7abe2d",
    "span_id": "086e83747d0e381e",
    "flags": "01"
  },
  "parent_id": "",
  "start_time": "2021-10-22 16:04:01.209458162 +0000 UTC",
  "end_time": "2021-10-22 16:04:01.209514132 +0000 UTC",
  "status_code": "STATUS_CODE_OK",
  "status_message": "",
  "attributes": {
    "net.transport": "IP.TCP",
    "net.peer.ip": "172.17.0.1",
    "net.peer.port": "51820",
    "net.host.ip": "10.177.2.152",
    "net.host.port": "26040",
    "http.method": "GET",
    "http.target": "/v1/sys/health",
    "http.server_name": "mortar-gateway",
    "http.route": "/v1/sys/health",
    "http.user_agent": "Consul Health Check",
    "http.scheme": "http",
    "http.host": "10.177.2.152:26040",
    "http.flavor": "1.1"
  },
}
Text
- Name
- Context
- Start - Stop
- Status
- Attributes
Context Propagation
Linking
When the execution flow is broken we can split the traces with a link
Request
Process
Return
Job start
Job end
link: 584ca56
trace_id: 7836bc4
trace_id: 584ca56
link: 7836bc4
async
Sampling
Too Much Data
Head Sampling
% of trace-id
Tail Sampling
based on error state
Automatic vs Manual
It's not vs, it should be and
Automatic Instrumentation
use it when it's available: Java has good support
Manual Instrumentation
automatic doesn't solve all your traces
Eventing

The Signals
Logs but better
Bring in the structure
Logs have a history of not being well-structured
OpenTelemetry Events are Log + Semantic Conventions
Traces are richer than logs, but can be sampled
Events
Rich data
Don't do it without events governance
Don't stop at operational, start thinking business-events
Make sure you are in control over your data stream, route it to BI systems
Events
Characteristics
Raw Data stored
Cardinality is less of an issue
Handled by logging systems, BigQuery, Snowflake
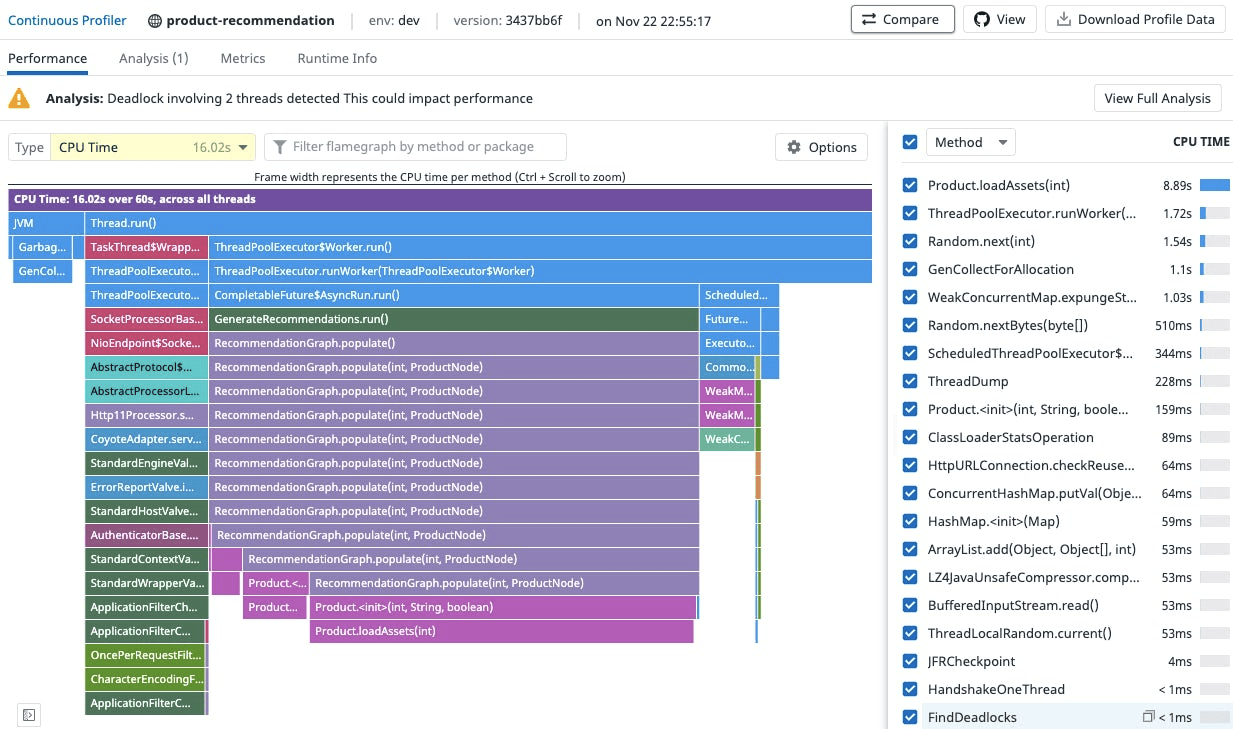
Profiling

The Signals
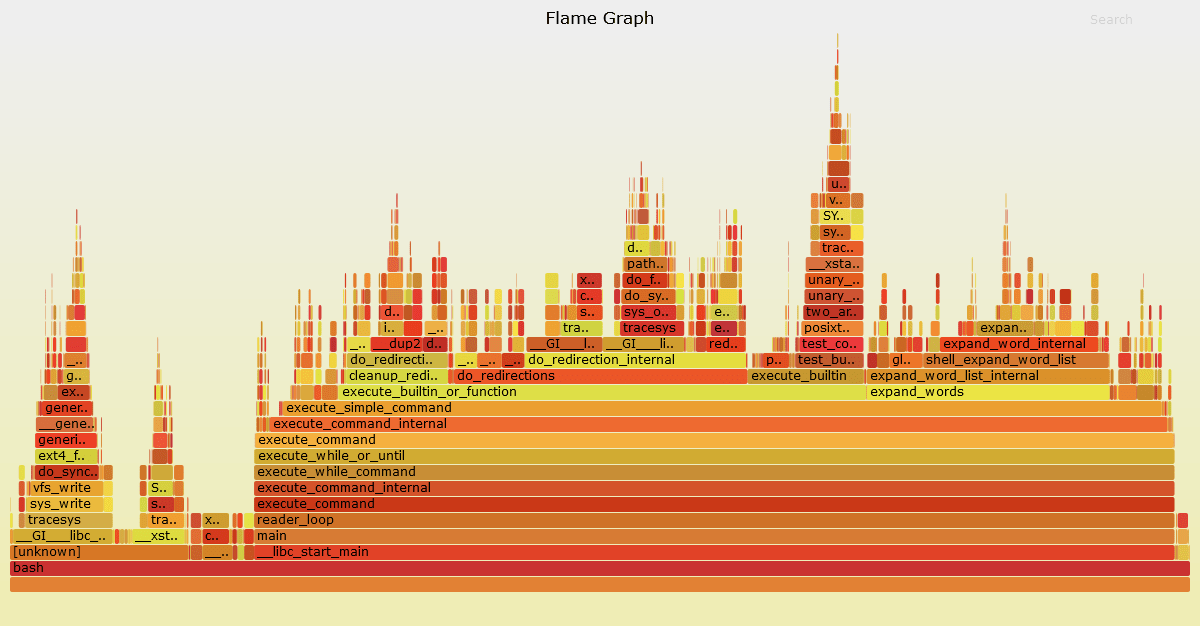
profiles
flame graph Example
profiles
vendor CPU PROFILE Example
Signals Closing thought

The Signals
Closing Thought
Signals
Use Tracing for your breadcrumbs
Use Events for important operations and business events
Augment with Metrics were you think you need to alert or act upon in real time
Logs should be last resort
OpenTelemetry
Community
OpenTelemetry
Unique in the Open Source Space
The project has some heritage
OpenTracing
OpenCensus
2019 - Two Open-Source Projects merged
Industry Backing
Text
Many companies realized they were doing the same
Still, investigate carefully of companies providing their own SDK version
Avoid companies/projects that say they are OTEL compatible
Second Largest CNCF Project
That's huge
Kubernetes does better
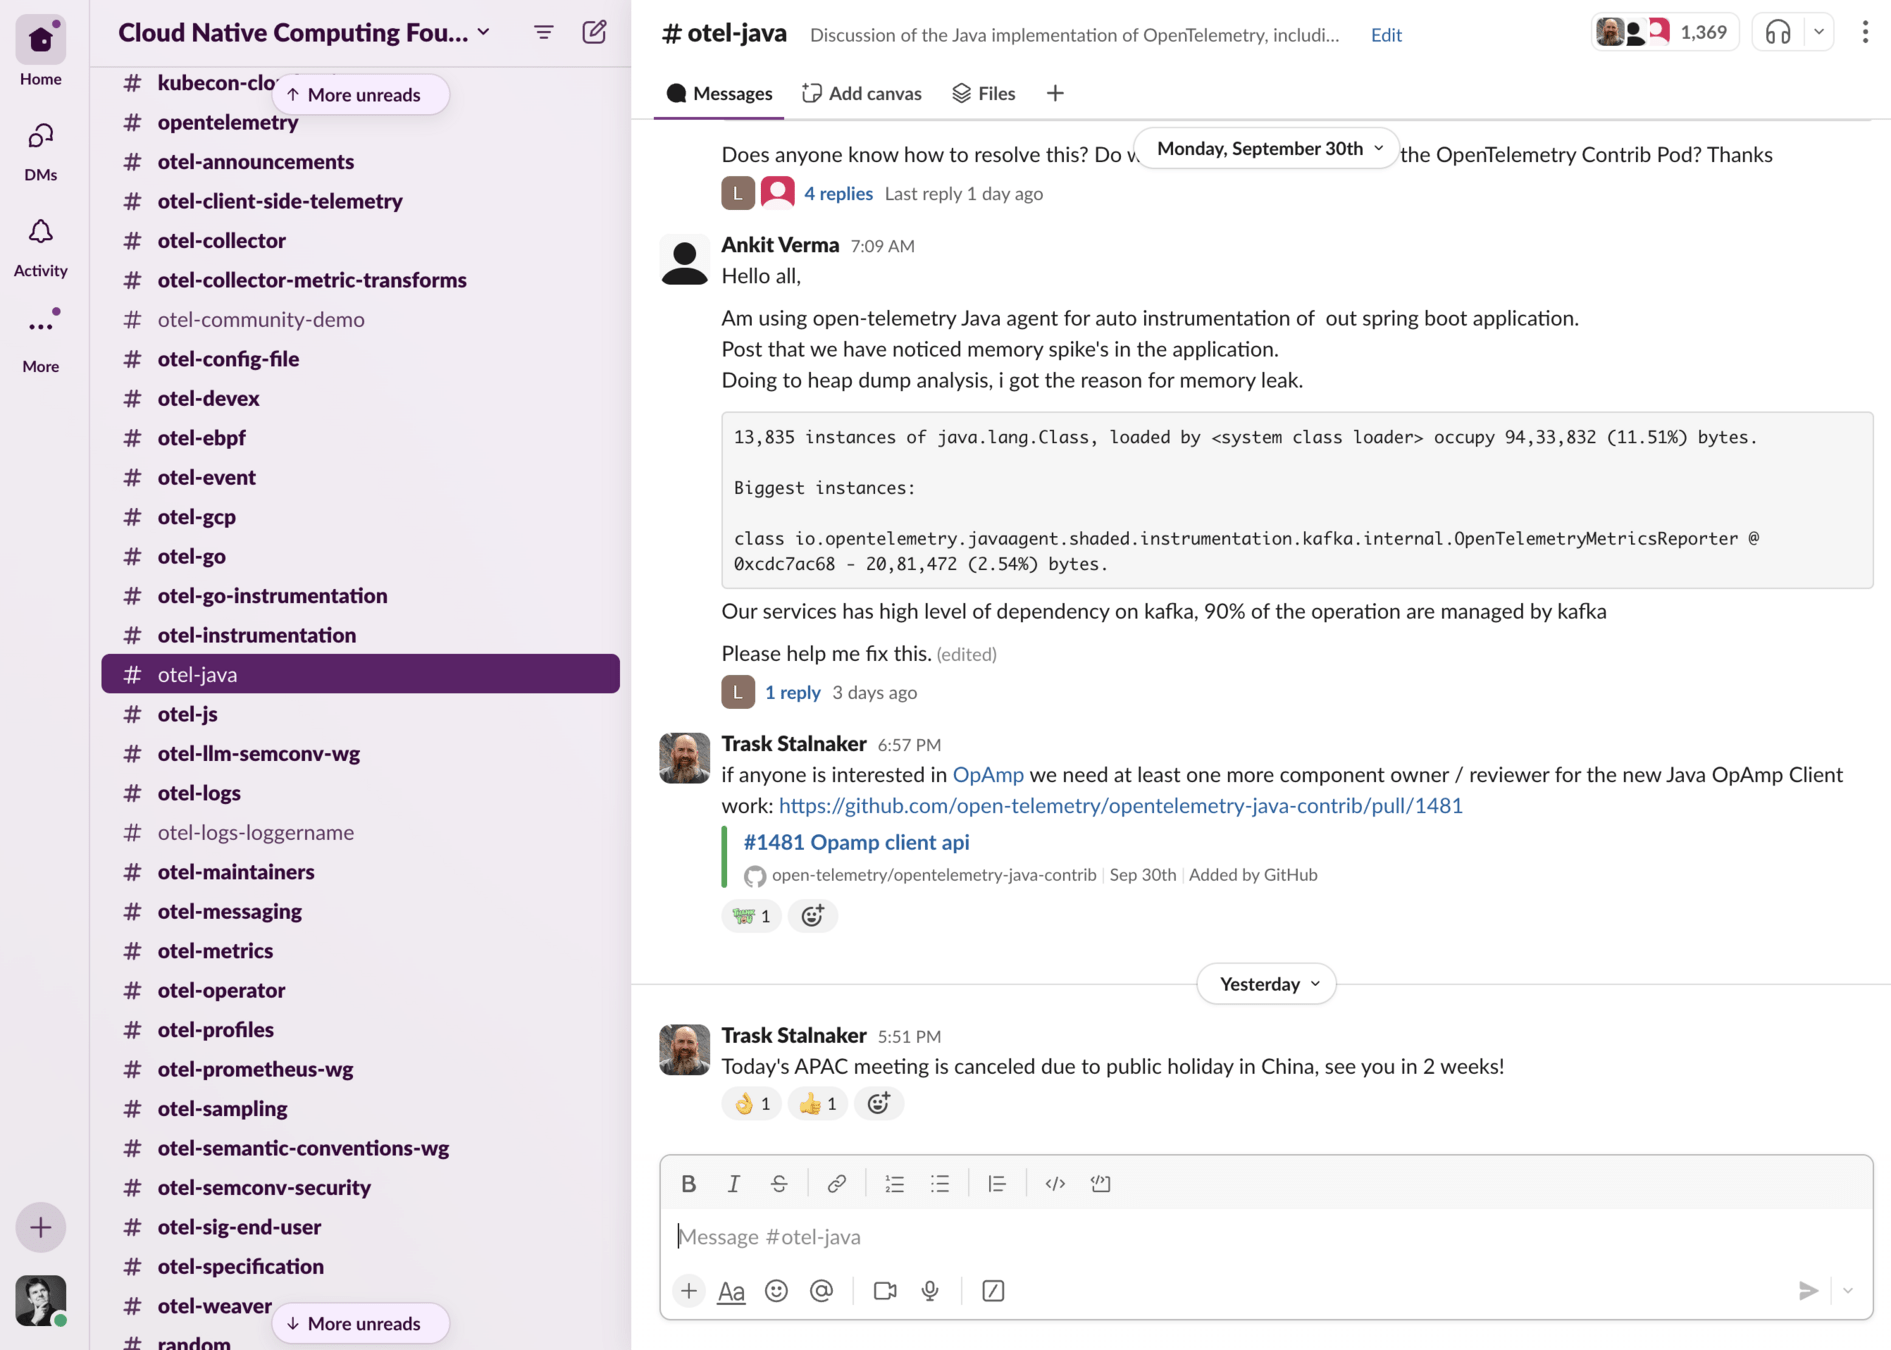
Slack is the best place to get help
But it can be overwelming
Join A meeting
Be a fly on the wall
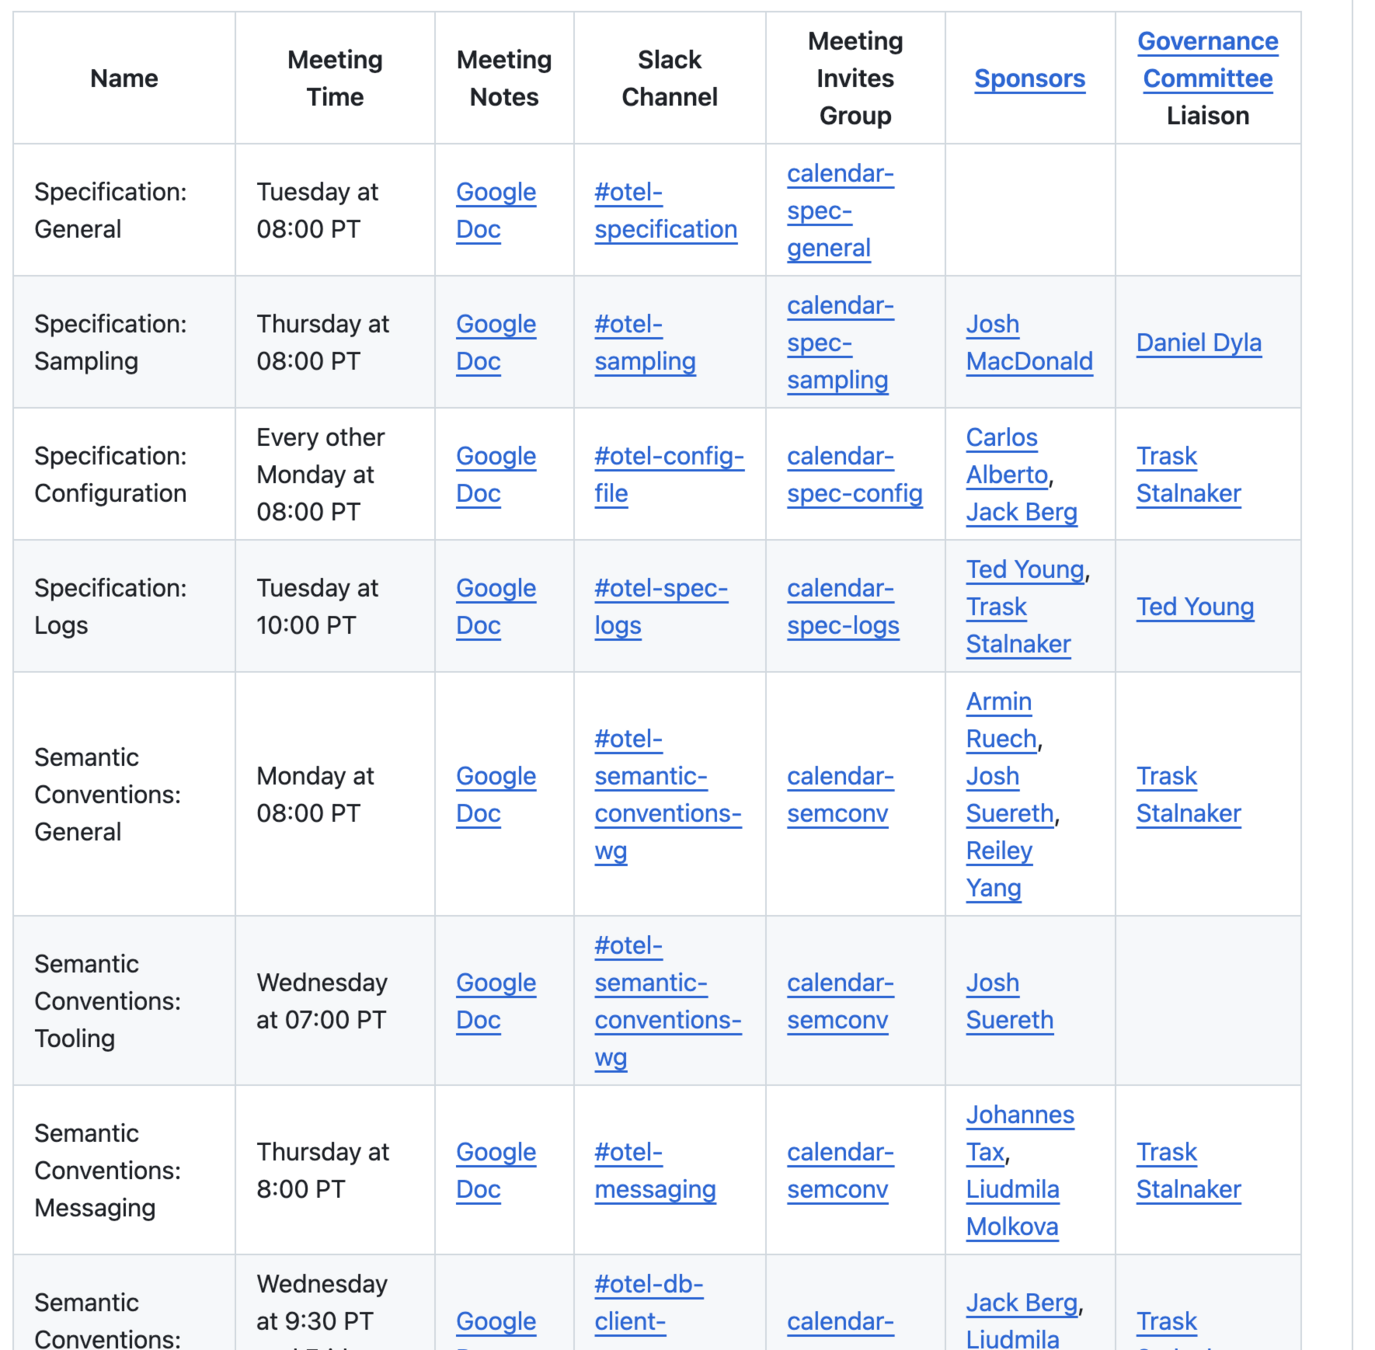
Go to the community page
OpenTelemetry Protocol

OpenTelemetry
OTLP
Protobuf and gRPC - Span Example
message Span {

  bytes trace_id = 1;
  bytes span_id = 2;
  string trace_state = 3;
  bytes parent_span_id = 4;
  fixed32 flags = 16;
  string name = 5;

  enum SpanKind {
    SPAN_KIND_UNSPECIFIED = 0;
    SPAN_KIND_INTERNAL = 1;
    SPAN_KIND_SERVER = 2;
    SPAN_KIND_CLIENT = 3;
    SPAN_KIND_PRODUCER = 4;
    SPAN_KIND_CONSUMER = 5;
  }

  SpanKind kind = 6;

  fixed64 start_time_unix_nano = 7;
  fixed64 end_time_unix_nano = 8;

  repeated opentelemetry.proto.common.v1.KeyValue attributes = 9;
}
OTLP
Span - Event
message Span {

  bytes trace_id = 1;
  bytes span_id = 2;
  string trace_state = 3;
  bytes parent_span_id = 4;
  fixed32 flags = 16;
  string name = 5;

  repeated opentelemetry.proto.common.v1.KeyValue attributes = 9;

  message Event {
    fixed64 time_unix_nano = 1;
    string name = 2;
    repeated opentelemetry.proto.common.v1.KeyValue attributes = 3;
  }

  repeated Event events = 11;
}
OTLP
Span - Link
message Span {

  bytes trace_id = 1;
  bytes span_id = 2;
  string trace_state = 3;
  bytes parent_span_id = 4;
  fixed32 flags = 16;
  string name = 5;

  repeated opentelemetry.proto.common.v1.KeyValue attributes = 9;

  message Link {
    bytes trace_id = 1;
    bytes span_id = 2;
    string trace_state = 3;
    repeated opentelemetry.proto.common.v1.KeyValue attributes = 4;
    fixed32 flags = 6;
  }
  repeated Link links = 13;
}
OTLP
Span - Status
message Span {

  bytes trace_id = 1;
  bytes span_id = 2;
  string trace_state = 3;
  bytes parent_span_id = 4;
  fixed32 flags = 16;
  string name = 5;

  repeated opentelemetry.proto.common.v1.KeyValue attributes = 9;

  Status status = 15;
}

message Status {
  string message = 2;

  enum StatusCode {
    STATUS_CODE_UNSET               = 0;
    STATUS_CODE_OK                  = 1;
    STATUS_CODE_ERROR               = 2;
  };

  StatusCode code = 3;
}
OTLP
Protocol - Hierarchy - Resource
message TracesData {
  repeated ResourceSpans resource_spans = 1;
}

message ResourceSpans {
  opentelemetry.proto.resource.v1.Resource resource = 1;
  repeated ScopeSpans scope_spans = 2;
  string schema_url = 3;
}

message Resource {
  repeated opentelemetry.proto.common.v1.KeyValue attributes = 1;
  uint32 dropped_attributes_count = 2;
}

message ScopeSpans {
  opentelemetry.proto.common.v1.InstrumentationScope scope = 1;
  repeated Span spans = 2;
  string schema_url = 3;
}
OTLP
Protocol - Hierarchy - Scope
message TracesData {
  repeated ResourceSpans resource_spans = 1;
}

message ResourceSpans {
  opentelemetry.proto.resource.v1.Resource resource = 1;
  repeated ScopeSpans scope_spans = 2;
  string schema_url = 3;
}

message ScopeSpans {
  opentelemetry.proto.common.v1.InstrumentationScope scope = 1;
  repeated Span spans = 2;
  string schema_url = 3;
}

message InstrumentationScope {
  string name = 1;
  string version = 2;

  repeated KeyValue attributes = 3;
  uint32 dropped_attributes_count = 4;
}
Semantic Conventions

OpenTelemetry
Semantic Conventions
Text
Keys and values which describe commonly observed concepts, protocols, and operations
Semantic Conventions
Areas
General: General Semantic Conventions.
Cloud Providers: Semantic Conventions for cloud providers libraries.
CloudEvents: Semantic Conventions for the CloudEvents specification.
Database: Semantic Conventions for database operations.
Exceptions: Semantic Conventions for exceptions.
FaaS: Semantic Conventions for Function as a Service (FaaS) operations.
Feature Flags: Semantic Conventions for feature flag evaluations.
Generative AI: Semantic Conventions for generative AI (LLM, etc.) operations.
GraphQL: Semantic Conventions for GraphQL implementations.
HTTP: Semantic Conventions for HTTP client and server operations.
Messaging: Semantic Conventions for messaging operations and systems.
Object Stores: Semantic Conventions for object stores operations.
RPC: Semantic Conventions for RPC client and server operations.
System: System Semantic Conventions.
Semantic Conventions
Example - Container
| Attribute | Type | Description | Examples | Requirement Level | Stability |
|---|---|---|---|---|---|
| container.id | string | Container ID. Usually a UUID, as for example used to identify Docker containers. The UUID might be abbreviated. | a3bf90e006b2 | Recommended | Experimental |
| container.image.id | string | Runtime specific image identifier. Usually a hash algorithm followed by a UUID. [1] | sha256:19c92d0a00d1b66d897bceaa7319bee0dd38a10a851c60bcec9474aa3f01e50f | Recommended | Experimental |
| container.image.name | string | Name of the image the container was built on. | gcr.io/opentelemetry/operator | Recommended | Experimental |
| container.image.tags | string[] | Container image tags. An example can be found in Docker Image Inspect. Should be only the <tag> section of the full name for example from registry.example.com/my-org/my-image:<tag>. | ["v1.27.1", "3.5.7-0"] | Recommended | Experimental |
| container.label.<key> | string | Container labels, <key> being the label name, the value being the label value. | container.label.app=nginx | Recommended | Experimental |
| container.name | string | Container name used by container runtime. | opentelemetry-autoconf | Recommended | Experimental |
| container.runtime | string | The container runtime managing this container. | docker; containerd; rkt | Recommended | Experimental |
| container.command | string | The command used to run the container (i.e. the command name). [4] | otelcontribcol | Opt-In | Experimental |
SDK

OpenTelemetry
Language APIs & SDKs
| Language | Traces | Metrics | Logs |
|---|---|---|---|
| C++ | Stable | Stable | Stable |
| C#/.NET | Stable | Stable | Stable |
| Erlang/Elixir | Stable | Development | Development |
| Go | Stable | Stable | Beta |
| Java | Stable | Stable | Stable |
| JavaScript | Stable | Stable | Development |
| PHP | Stable | Stable | Stable |
| Python | Stable | Stable | Development |
| Ruby | Stable | Development | Development |
| Rust | Beta | Alpha | Alpha |
| Swift | Stable | Development | Development |
The Collector

OpenTelemetry
the opentelemetry collector
a telemetry swiss knife
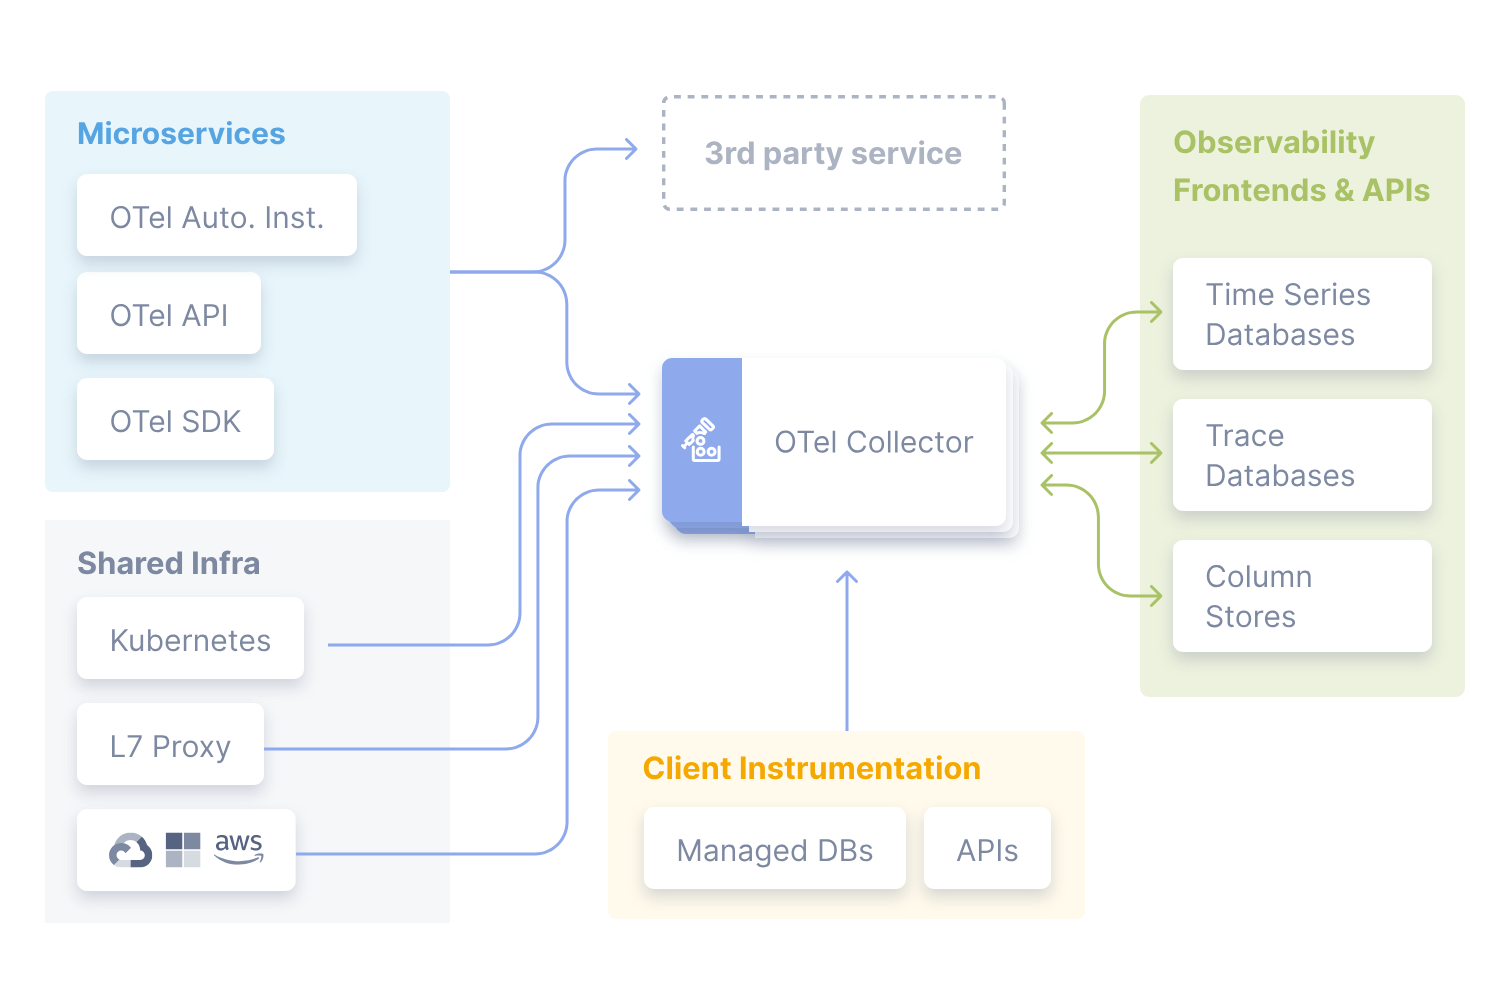
the opentelemetry collector
Pipeline
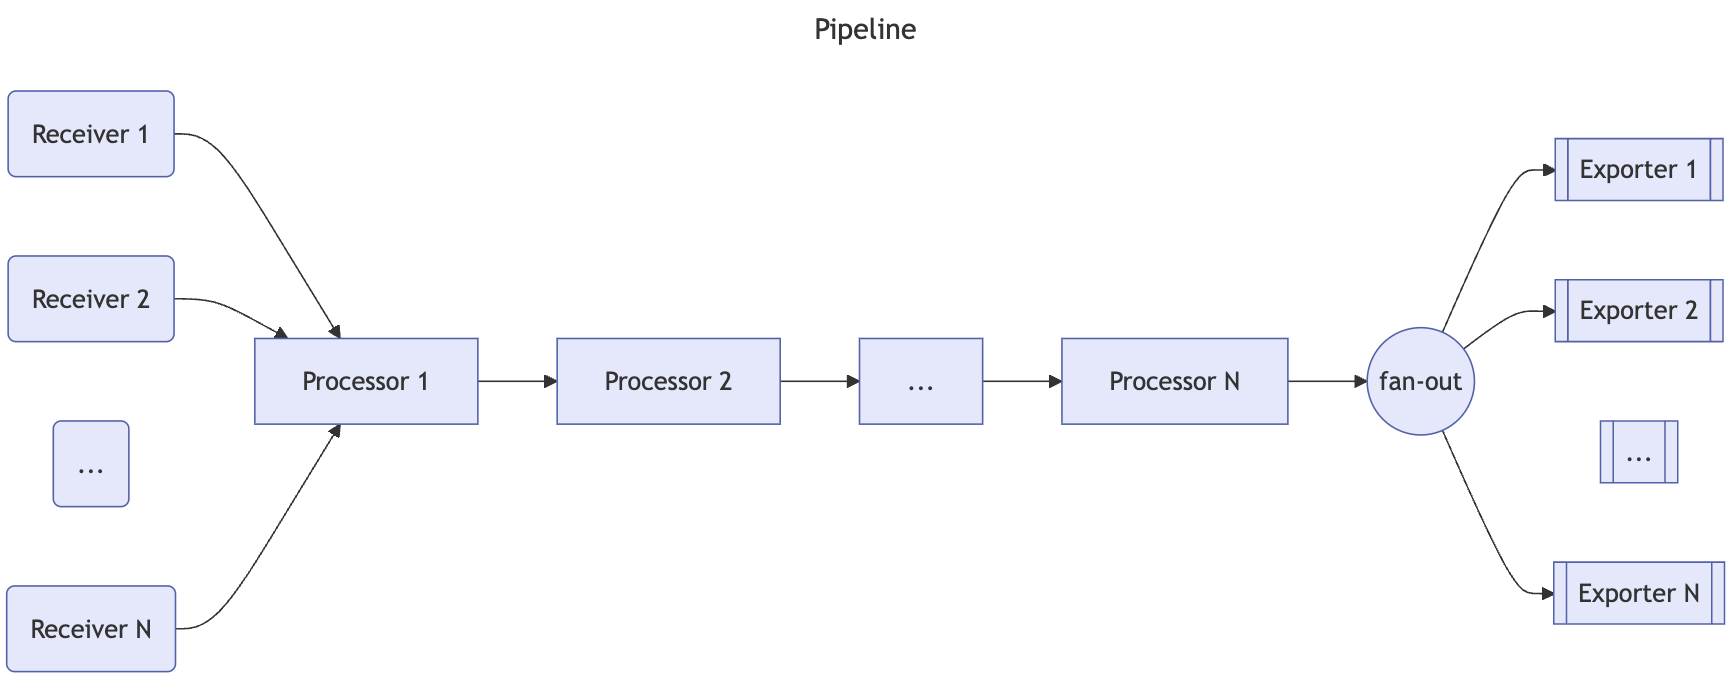
the opentelemetry collector
receivers - 95
activedirectorydsreceiver
aerospikereceiver
apachereceiver
apachesparkreceiver
awscloudwatchmetricsreceiver
awsfirehosereceiver
awsxrayreceiver
azuremonitorreceiver
carbonreceiver
datadogreceiver
dockerstatsreceiver
elasticsearchreceiver
filelogreceiver
filestatsreceiver
fluentforwardreceiver
githubreceiver
googlecloudmonitoringreceiver
googlecloudpubsubreceiver
googlecloudspannerreceiver
mysqlreceiver
nginxreceiver
osqueryreceiver
otelarrowreceiver
otlpjsonfilereceiver
podmanreceiver
postgresqlreceiver
prometheusreceiver
prometheusremotewritereceiver
pulsarreceiverrabbitmqreceiver
receivercreator
redisreceiver
snmpreceiver
statsdreceiver
syslogreceiver
tcplogreceiver
webhookeventreceiver
zipkinreceiver
zookeeperreceiver
haproxyreceiver
hostmetricsreceiver
httpcheckreceiver
iisreceiver
influxdbreceiver
jaegerreceiver
jmxreceiver
journaldreceiver
k8sclusterreceiver
k8seventsreceiver
k8sobjectsreceiver
kafkametricsreceiver
kafkareceiver
kubeletstatsreceiver
lokireceiver
memcachedreceiver
mongodbatlasreceiver
mongodbreceiver
mysqlreceiver
the opentelemetry collector
processors - 26
attributesprocessor
coralogixprocessor
cumulativetodeltaprocessor
deltatocumulativeprocessor
deltatorateprocessor
filterprocessor
geoipprocessor
groupbyattrsprocessor
groupbytraceprocessor
intervalprocessor
k8sattributesprocessor
logdedupprocessor
logstransformprocessor
metricsgenerationprocessor
metricstransformprocessor
probabilisticsamplerprocessor
redactionprocessor
remotetapprocessor
resourcedetectionprocessor
resourceprocessor
routingprocessor
schemaprocessor
spanprocessor
sumologicprocessor
tailsamplingprocessor
transformprocessor
batchprocessor
memorylimiterprocessor
the opentelemetry collector
exporters - 45
alertmanagerexporter
alibabacloudlogserviceexporter
awscloudwatchlogsexporter
awsemfexporter
awskinesisexporter
awss3exporter
awsxrayexporter
azuredataexplorerexporter
azuremonitorexporter
carbonexporter
cassandraexporter
clickhouseexporter
coralogixexporter
datadogexporter
datasetexporter
dorisexporter
elasticsearchexporter
fileexporter
googlecloudexporter
sentryexporter
signalfxexporter
splunkhecexporter
sumologicexporter
syslogexporter
tencentcloudlogserviceexporter
zipkinexporter
googlecloudpubsubexporter googlemanagedprometheusexporter honeycombmarkerexporter influxdbexporter kafkaexporter kineticaexporter loadbalancingexporter logicmonitorexporter logzioexporter lokiexporter mezmoexporter opencensusexporter opensearchexporter otelarrowexporter prometheusexporter prometheusremotewriteexporter pulsarexporter rabbitmqexporter sapmexporter
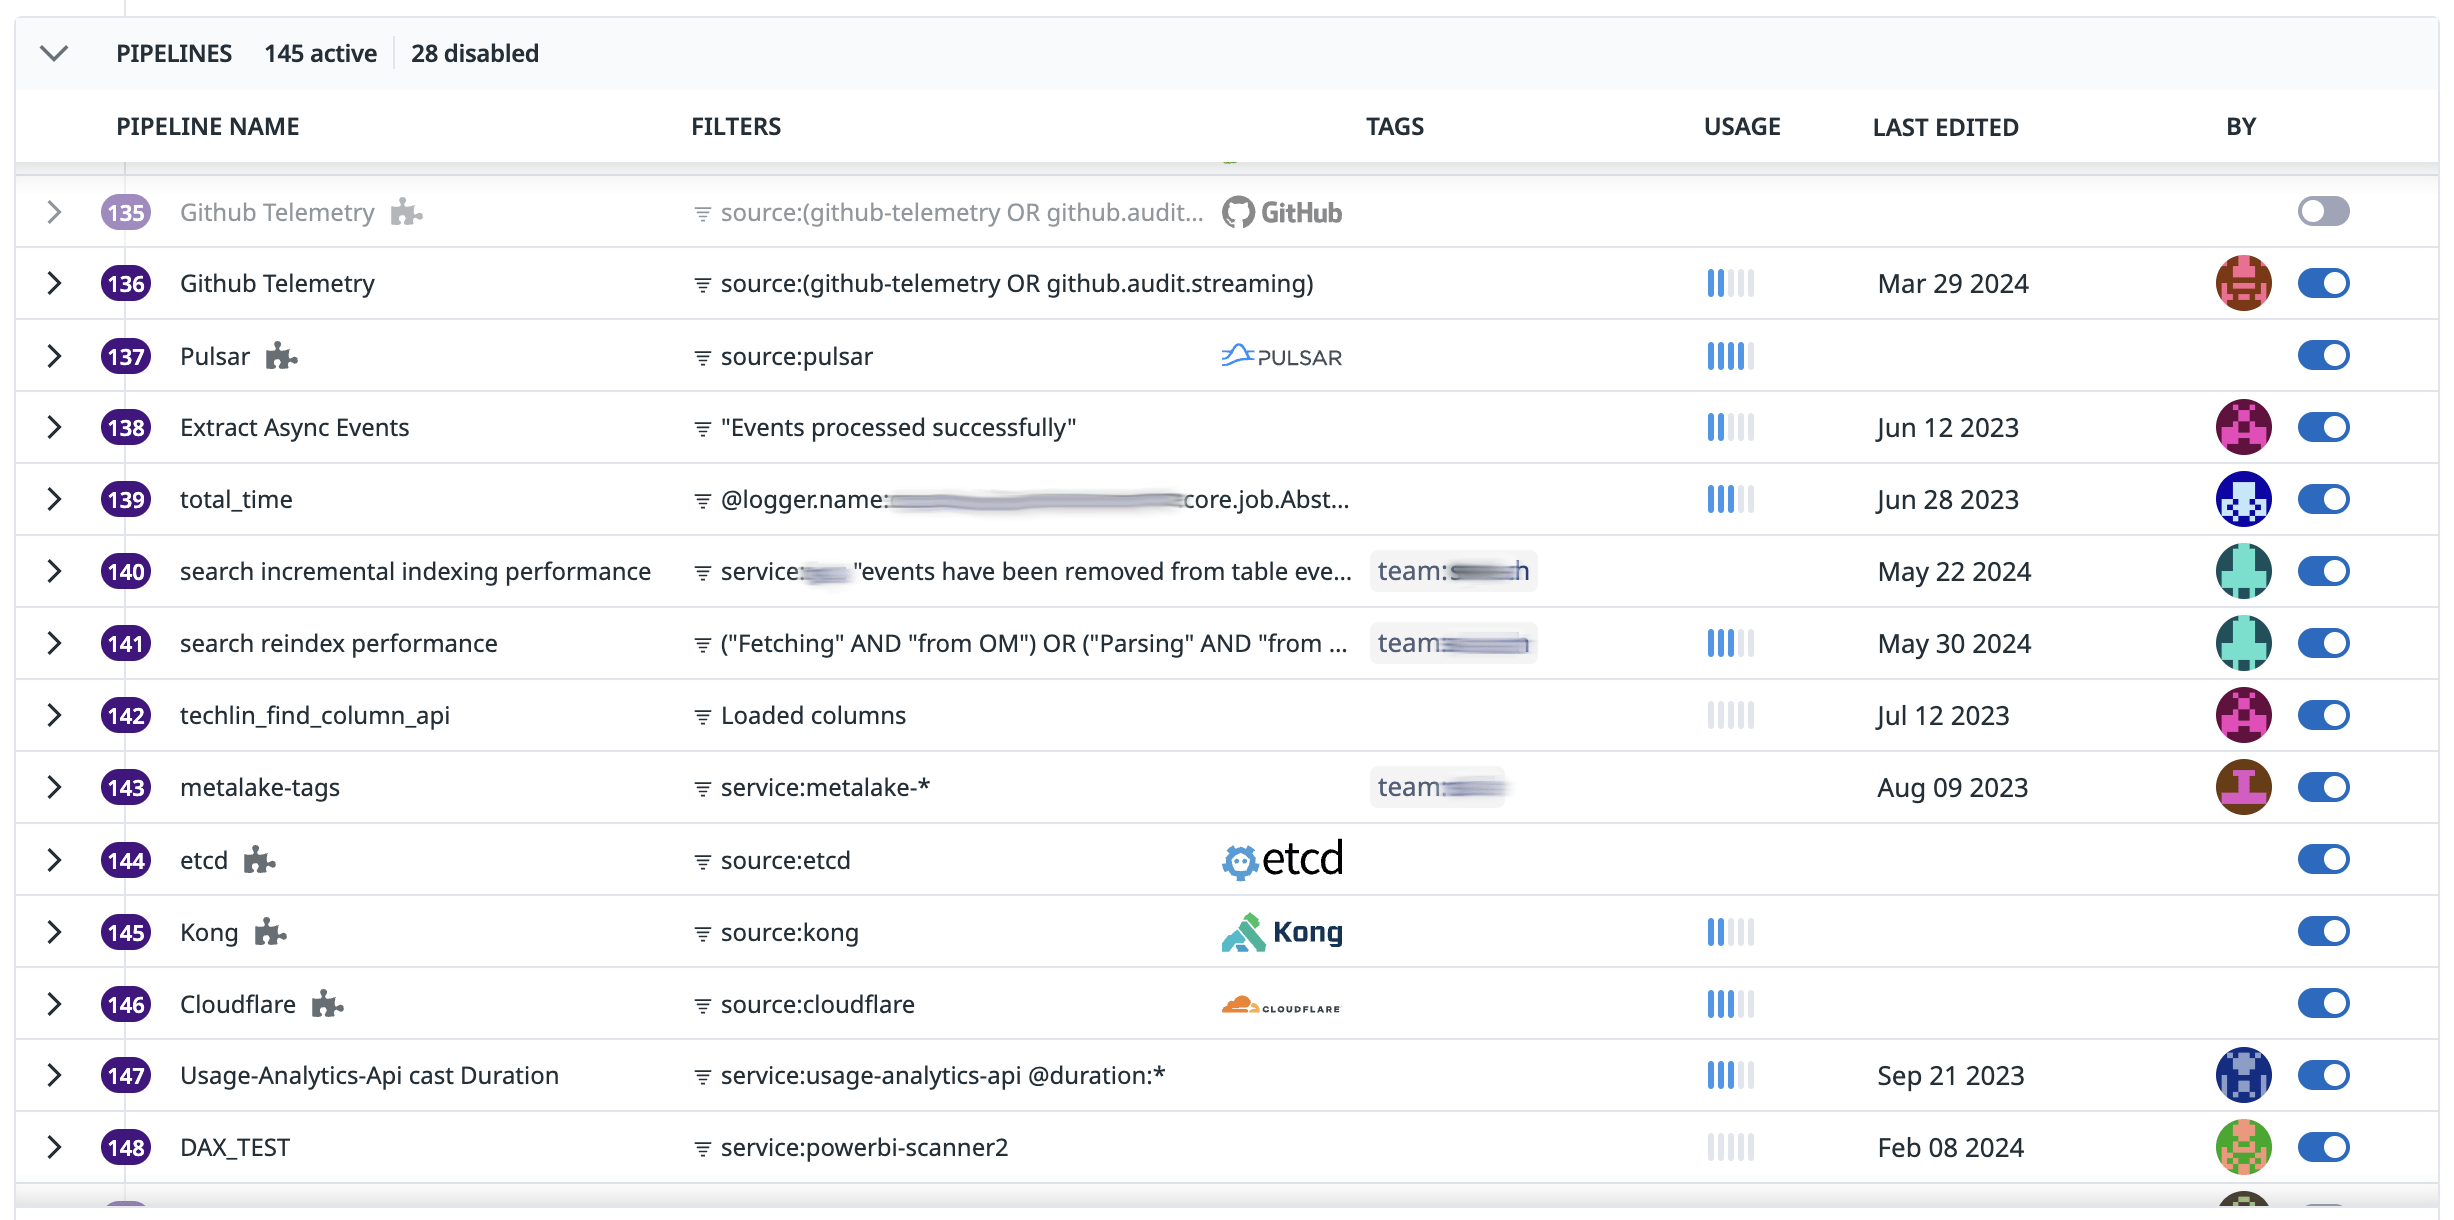
Pipelines

OpenTelemetry
Pipelines
more processing
Manipulate data:
- Transform
- Enrich
- Filter (drop)
- Sample
Make your own!
From Spaghetti
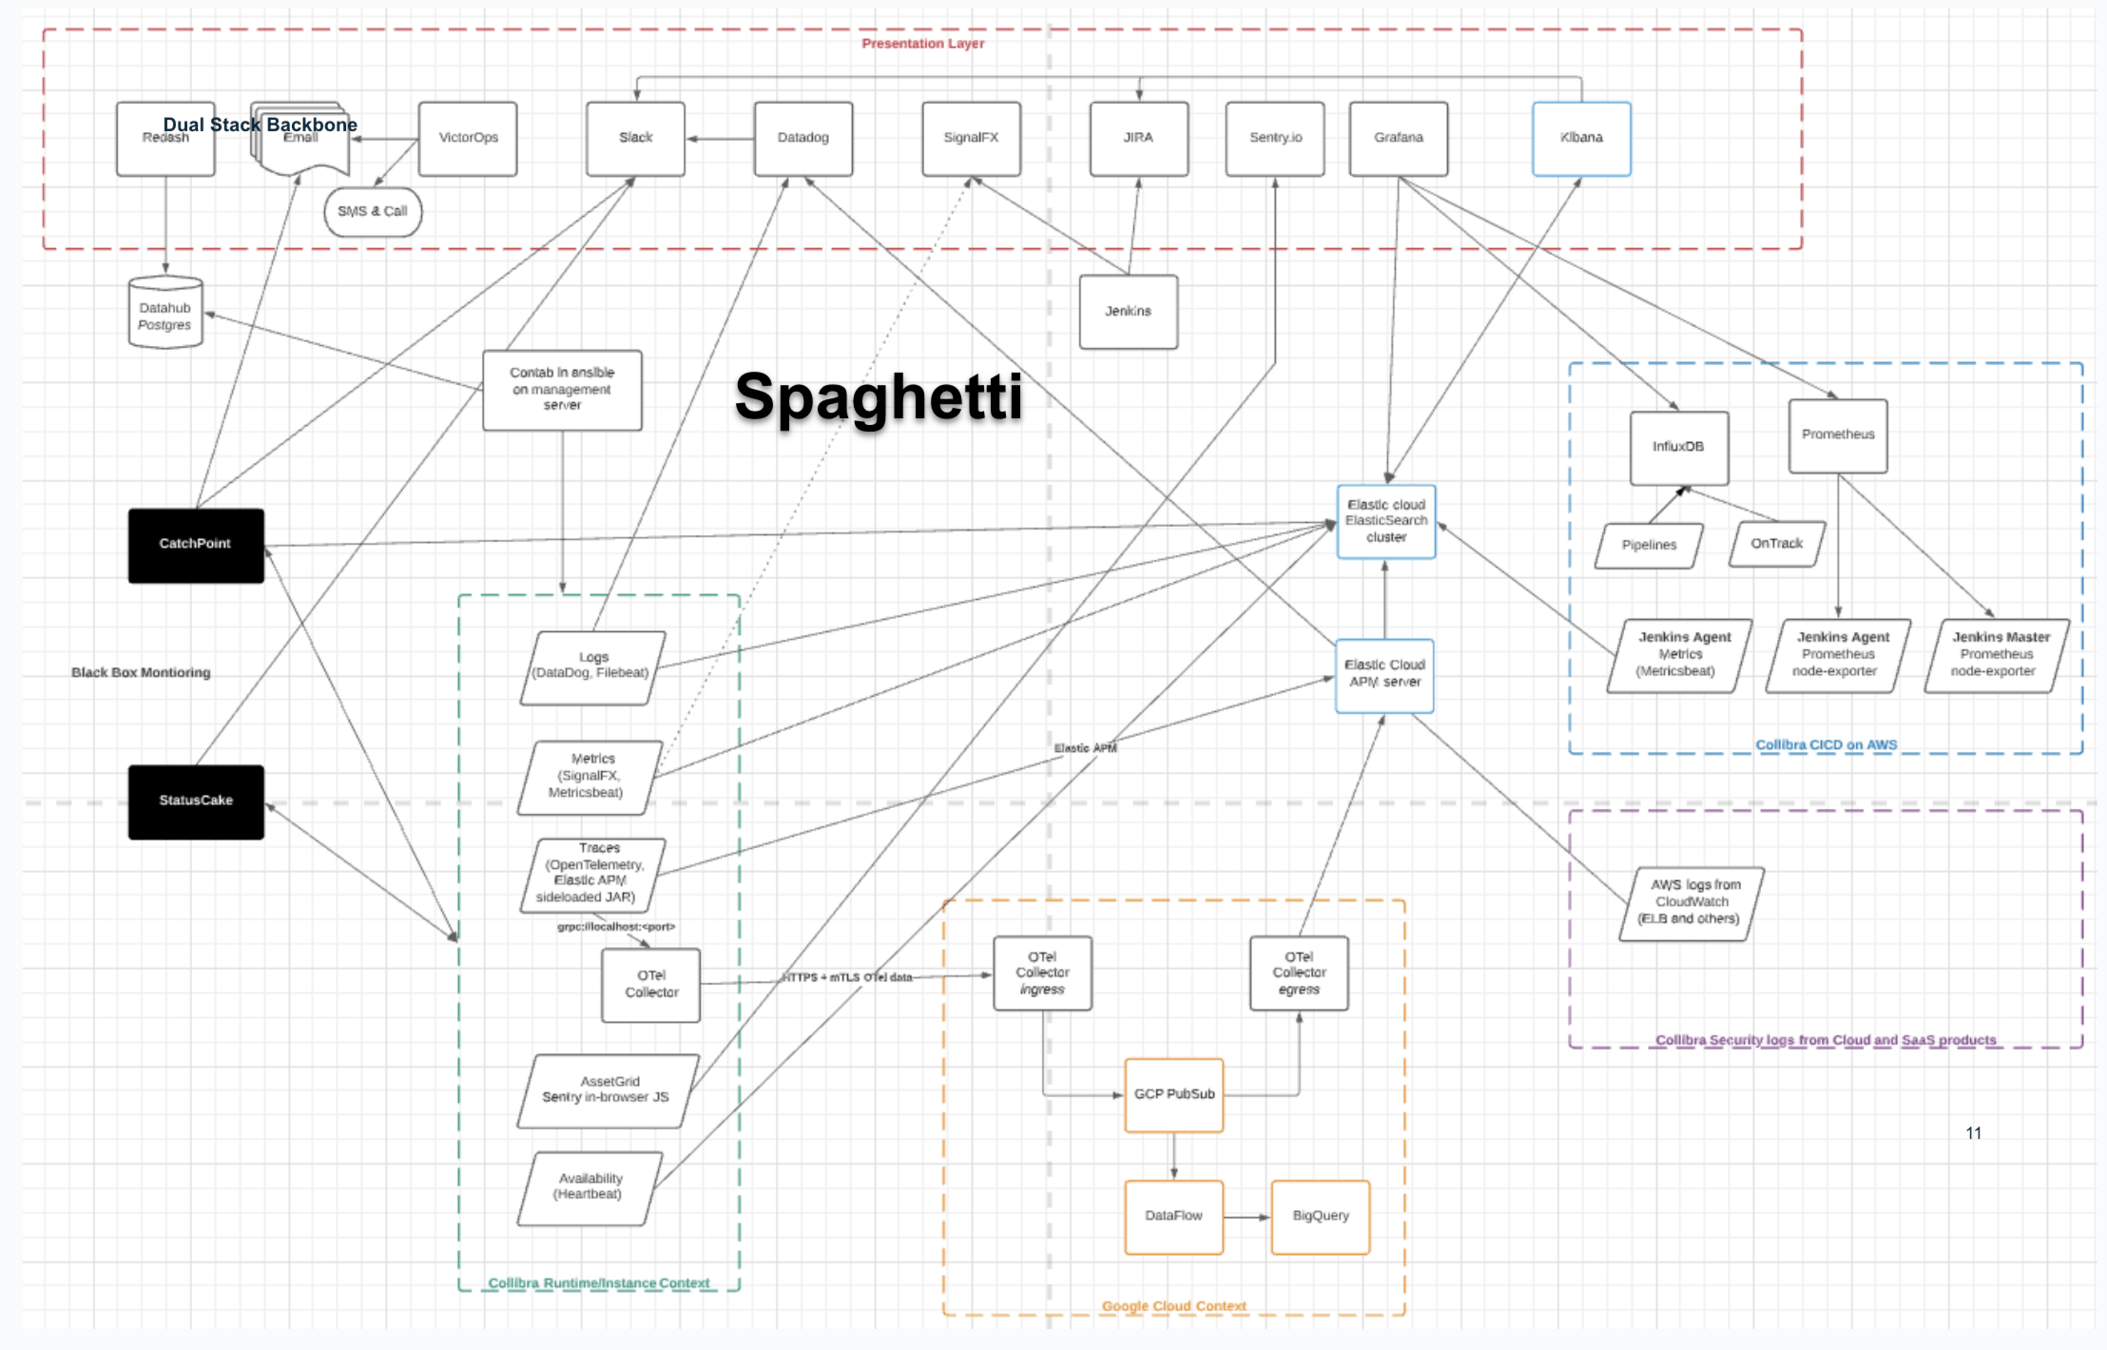
Telemetry Backbone
R
P
E
R
P
E

BACKEND
BACKEND
R
P
E
R
P
E
R
P
E
R
P
E

Business
x~5000
x~50
Telemetry Backbone
R
P
E
R
P
E
BACKEND
BACKEND
R
P
E
R
P
E
R
P
E
R
P
E
R
P
E
R
P
E
R
P
E
Business
x~5000
x~50
Telemetry Backbone
R
P
E
R
P
E
BACKEND
BACKEND
R
P
E
R
P
E
R
P
E
R
P
E
R
P
E
R
P
E
R
P
E

Business
x~5000
x~50
Telemetry Backbone
R
P
E
R
P
E
BACKEND
BACKEND
R
P
E
R
P
E
R
P
E
R
P
E
R
P
E
R
P
E
R
P
E
Business


x~5000
x~50
Telemetry Backbone
R
P
E
R
P
E
BACKEND
BACKEND
R
P
E
R
P
E
R
P
E
R
P
E
R
P
E
Business
x~5000
x~50
Telemetry Backbone
R
P
E
R
P
E
BACKEND
BACKEND
R
P
E
R
P
E
R
P
E
R
P
E
Business
x~5000
x~50
OTel Closing thought
OpenTelemetry
Closing Thought
The future is now
OpenTelemetry is the future of instrumentation and collection
The future of transport and pipelining
It doesn't focus on querying, storing, dash-boarding:
it leaves that to vendors or other projects
Practicum
A walk through
Setting Up

Options
Options for recording signals in Java
Proprietary SDK's
Spring's favorite - Micrometer
Native OpenTelemetry
Options With OpenTelemetry
OpenTelemetry Java is pretty mature
OpenTelemetry Java Agent
Manual Java Setup
Spring Boot OpenTelemetry Starter
Collector
An invaluable tool to set up locally
- Listen on OTLP stream
- Debug Locally
- Send to your favorite backend
- Do some processing
Collector
The Sections
receivers:
processors:
exporters:
service:
  telemetry:
    metrics:
      address: "0.0.0.0:10000"
    logs:
      level: info
      encoding: json
Collector
Make your collector Observable
receivers:
processors:
exporters:
service:
  telemetry:
    metrics:
      address: "0.0.0.0:10000"
    logs:
      level: info
      encoding: json
Collector
Open Telemetry Receivers
receivers:
  otlp:
    protocols:
      grpc:
      http:
processors:
exporters:
service:
  telemetry:
    metrics:
      address: "0.0.0.0:10000"
    logs:
      level: info
      encoding: json
Collector
Open Telemetry Receivers
receivers:
  otlp:
    protocols:
      grpc:
      http:
processors:
exporters:
  googlecloud:
    project: treactor
    log:
      default_log_name: opentelemetry.io/collector-exported-log
  googlemanagedprometheus:
    project: treactor
    metric:
      resource_filters:
        - prefix: cloud
        - prefix: host
      extra_metrics_config:
        enable_target_info: false
        enable_scope_info: false
service:
Collector
Open Telemetry Receivers
receivers:
  otlp:
    protocols:
      grpc:
      http:
processors:
exporters:
  googlecloud:
    project: treactor
    log:
      default_log_name: opentelemetry.io/collector-exported-log
  googlemanagedprometheus:
    project: treactor
    metric:
      resource_filters:
        - prefix: cloud
        - prefix: host
      extra_metrics_config:
        enable_target_info: false
        enable_scope_info: false
  debug:
    verbosity: detailed
service:
Collector
Open Telemetry Receivers
receivers:
  otlp:
processors:
exporters:
  googlecloud:
  googlemanagedprometheus:
  debug:
service:
  pipelines:
    metrics:
      receivers: [ otlp ]
      exporters: [ googlemanagedprometheus, debug ]
    logs:
      receivers: [ otlp ]
      exporters: [ googlecloud, debug ]
    traces:
      receivers: [ otlp ]
      exporters: [ googlecloud, debug ]
Collector
Open Telemetry Receivers
receivers:
  otlp:
processors:
  batch:
    # recommended value from docs: https://cloud.google.com/stackdriver/docs/managed-prometheus/setup-otel
    send_batch_size: 200
    send_batch_max_size: 200
    timeout: 5s
exporters:
  googlecloud:
  googlemanagedprometheus:
  debug:
service:
  pipelines:
    metrics:
      receivers: [ otlp ]
      exporters: [ googlemanagedprometheus, debug ]
    logs:
      receivers: [ otlp ]
      exporters: [ googlecloud, debug ]
    traces:
      receivers: [ otlp ]
      exporters: [ googlecloud, debug ]
Collector
Open Telemetry Receivers
receivers:
  otlp:
processors:
  batch:
  transform/reserved_attributes:
    - context: resource
      statements:
        - delete_key(attributes, "process.command_args")
        - delete_key(attributes, "process.executable.path")
        - delete_key(attributes, "process.runtime.description")
exporters:
  googlecloud:
  googlemanagedprometheus:
  debug:
service:
  pipelines:
    metrics:
      receivers: [ otlp ]
      exporters: [ googlemanagedprometheus, debug ]
    logs:
      receivers: [ otlp ]
      exporters: [ googlecloud, debug ]
    traces:
      receivers: [ otlp ]
      exporters: [ googlecloud, debug ]
Collector
Open Telemetry Receivers
receivers:
  otlp:
processors:
  batch:
  transform/reserved_attributes:
exporters:
  googlecloud:
  googlemanagedprometheus:
  debug:
service:
  pipelines:
    metrics:
      receivers: [ otlp ]
      processors: [ batch, transform/reserved_attributes ]
      exporters: [ googlemanagedprometheus, debug ]
    logs:
      receivers: [ otlp ]
      processors: [ batch, transform/reserved_attributes ]
      exporters: [ googlecloud, debug ]
    traces:
      receivers: [ otlp ]
      processors: [ batch, transform/reserved_attributes ]
      exporters: [ googlecloud, debug ]
Preparation

Java - Spring Boot
Gradle Config
dependencies {
    implementation "io.opentelemetry:opentelemetry-api:$otelapi"
    implementation "io.opentelemetry:opentelemetry-sdk:$otelsdk"
    implementation "io.opentelemetry:opentelemetry-exporter-otlp:$otelsdk"
    agent "io.opentelemetry.javaagent:opentelemetry-javaagent:$otelagent"
    implementation("io.opentelemetry.instrumentation:opentelemetry-instrumentation-annotations:$otelagent")

    implementation group: 'org.apache.logging.log4j', name: 'log4j-api', version: '2.24.1'
    implementation group: 'org.apache.logging.log4j', name: 'log4j-core', version: '2.24.1'
    implementation group: 'org.apache.logging.log4j', name: 'log4j-slf4j-impl', version: '2.24.1'
    implementation group: 'org.apache.logging.log4j', name: 'log4j-jul', version: '2.24.1'
    implementation group: 'org.apache.logging.log4j', name: 'log4j-web', version: '2.24.1'

	implementation('org.springframework.boot:spring-boot-starter-web')
    implementation('org.springframework.boot:spring-boot-starter-thymeleaf')
}
OpenTelemetry Agent
Hook it into Gradle
dependencies {
    implementation "io.opentelemetry:opentelemetry-api:$otelapi"
    implementation "io.opentelemetry:opentelemetry-sdk:$otelsdk"
    implementation "io.opentelemetry:opentelemetry-exporter-otlp:$otelsdk"
    agent "io.opentelemetry.javaagent:opentelemetry-javaagent:$otelagent"
    implementation("io.opentelemetry.instrumentation:opentelemetry-instrumentation-annotations:$otelagent")
}


task copyAgentJar(type: Copy) {
    from configurations.agent
    into "src/main/jib/app"
    rename { fileName -> "opentelemetry-javaagent.jar" }
}
OpenTelemetry Agent
Hook it into Gradle
dependencies {
    agent "io.opentelemetry.javaagent:opentelemetry-javaagent:$otelagent"
    implementation("io.opentelemetry.instrumentation:opentelemetry-instrumentation-annotations:$otelagent")
}


task copyAgentJar(type: Copy) {}

jib {
    to {
        image = 'gcr.io/treactor/treactor-java'
        credHelper = 'osxkeychain'
        tags = ['0.1.5']
    }
    container {
        jvmFlags = ['-javaagent:/app/opentelemetry-javaagent.jar',
                    '-Xms512m',
                    '-Xdebug']
        mainClass = 'io.treactor.springboot.Application'
        ports = ['3330']
        format = 'OCI'
    }
}
tasks.jib.dependsOn(copyAgentJar)
Hooking in the Otel Agent
Start the agent
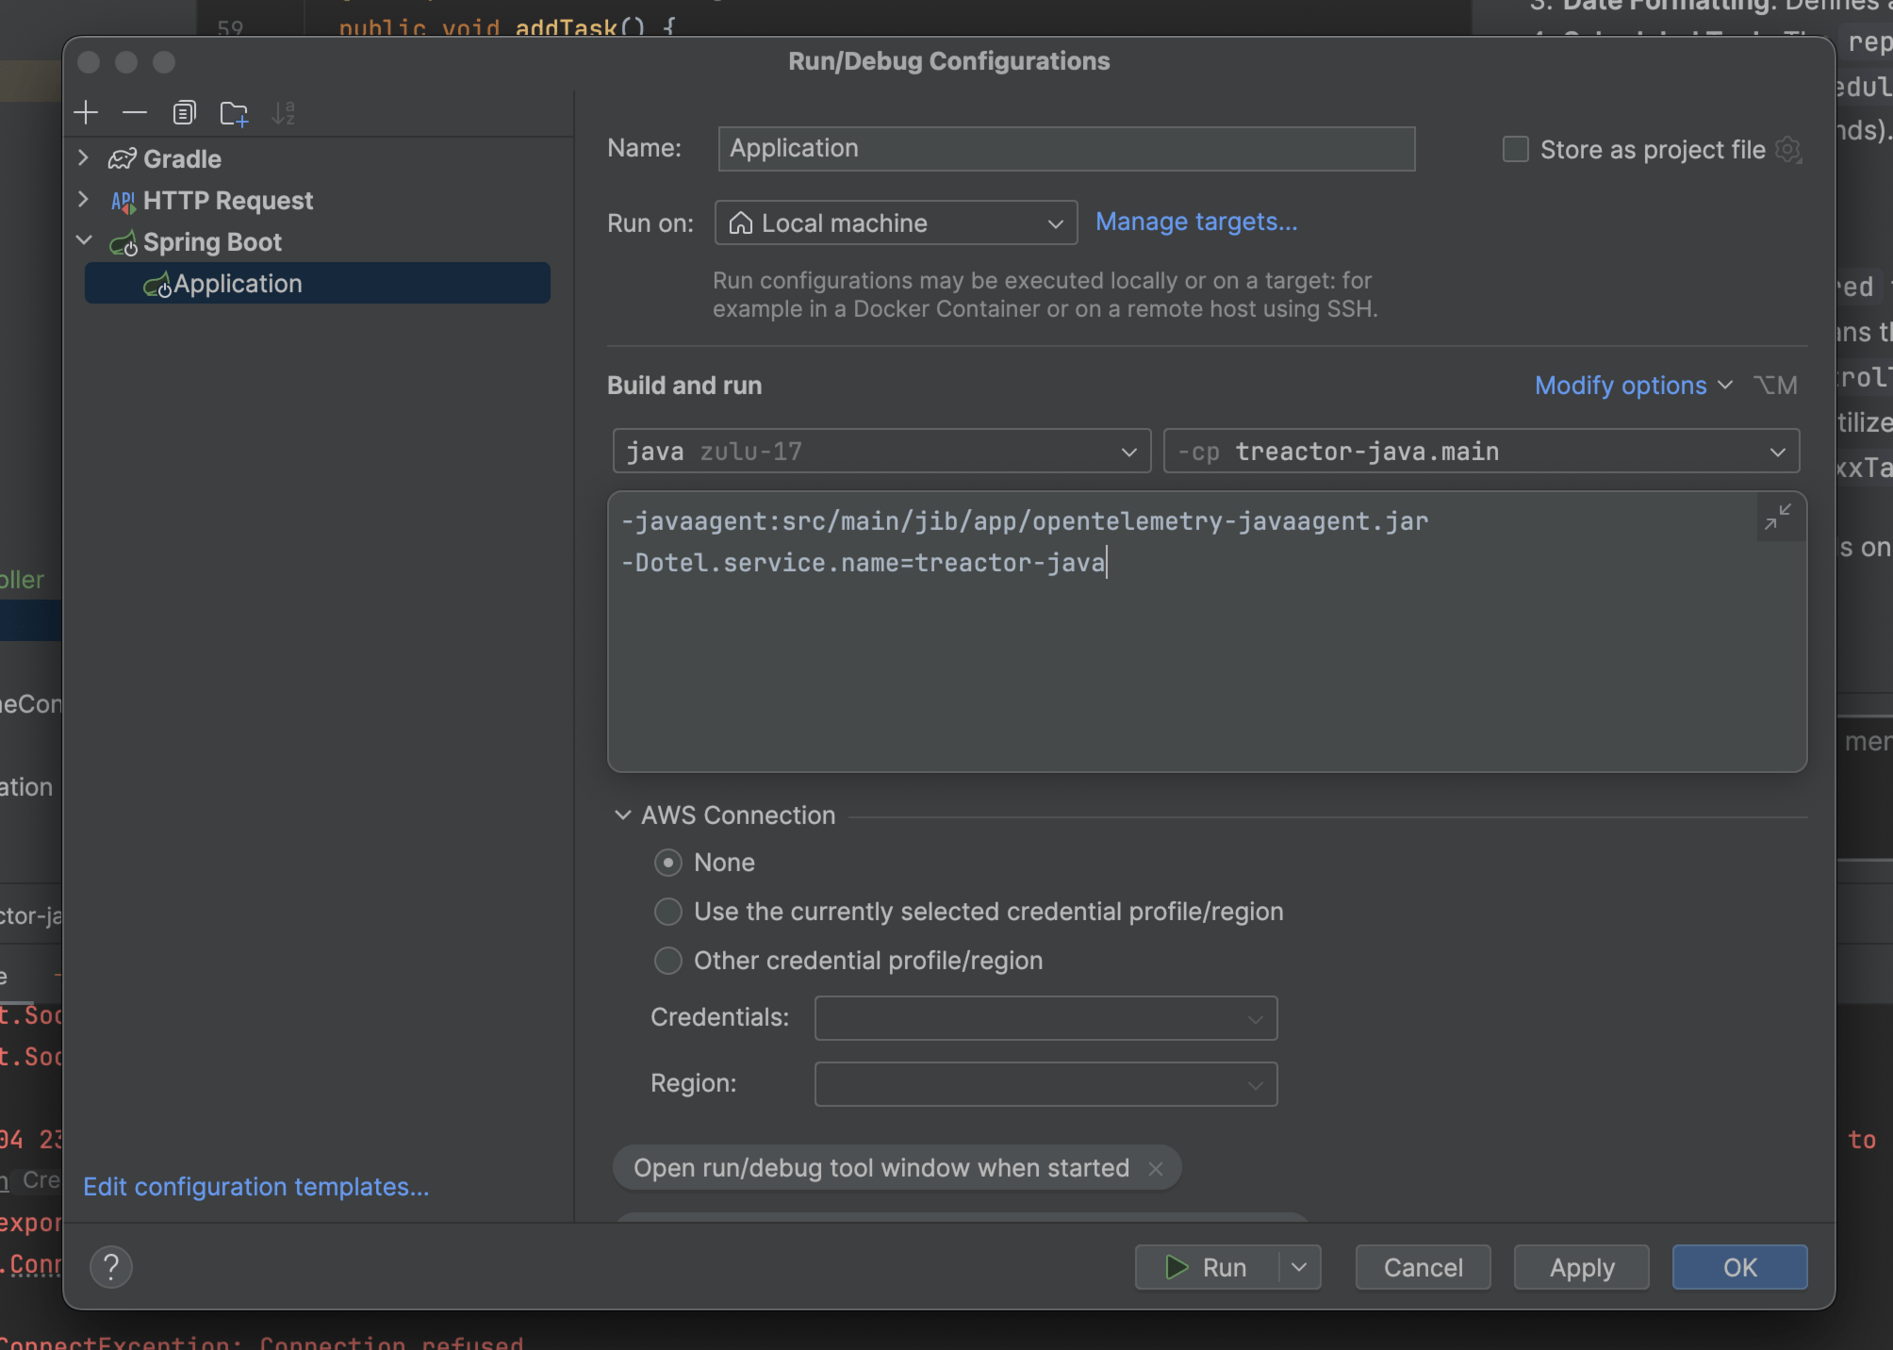
Java - Spring Boot
Hook in OTel
@Component
public class DevoxxTask {

  public DevoxxTask() {
    TracerProvider tracerProvider = GlobalOpenTelemetry.getTracerProvider();
    tracer = tracerProvider.get("treactor.devoxx", "0.1");
    MeterProvider meterProvider = GlobalOpenTelemetry.getMeterProvider();
    Meter meter = meterProvider.get(INSTRUMENTATION_SCOPE_NAME);
    histogram = meter.histogramBuilder("devoxx.tasks.duration").build();
  }

  private static final Logger log = LoggerFactory.getLogger(DevoxxTask.class);

}
Recording
Java - Spring Boot
Hook in OTel
@Component
public class DevoxxTask {

  @Component
  public class DevoxxTask {

    @WithSpan("addTask")
    public void addTask() {
      queue.add(new Task(Span.current()));
    }
  }
}
Java - Spring Boot
Hook in OTel
@Component
public class DevoxxTask {

  @Scheduled(fixedRate = 20000)
  @WithSpan("handleTasks")
  public void handleTasks() throws InterruptedException {
    Span.current().setAttribute("foo", "bar");
    while (true) {
      Task task = queue.poll();
      if (task == null) break;
      Span span = tracer.spanBuilder("process")
              .startSpan()
              .addLink(task.parent);
      try {
        int sleep = random.nextInt(250);
        Thread.sleep(sleep);
        LOGGER.info("The time is now {}", dateFormat.format(new Date()));
      } finally {
        span.end();
      }
    }
  }
}
Conclusion
Conclusion
what we learned
-
Consider dashboards and alerts when creating application metrics
-
Be flexible in what you produce, conservative in what you record
-
Consider the best tool for the job
-
Do OpenTelemetry
Parking lot
Proprietary SDK


Push & Pull
Place holder
Science of Signals
By Alex Van Boxel


