ChartJs
Introduction
Chart.js is a free Open Source JavaScript library for making HTML-based charts with the Canvas element.
It is one of the simplest visualization libraries for JavaScript
Browsers supported
- Chrome
- Edge
- Firefox
- Safari
Types of charts
- Scatter Plot
- Line Chart
- Bar Chart
- Pie Chart
- Donut Chart
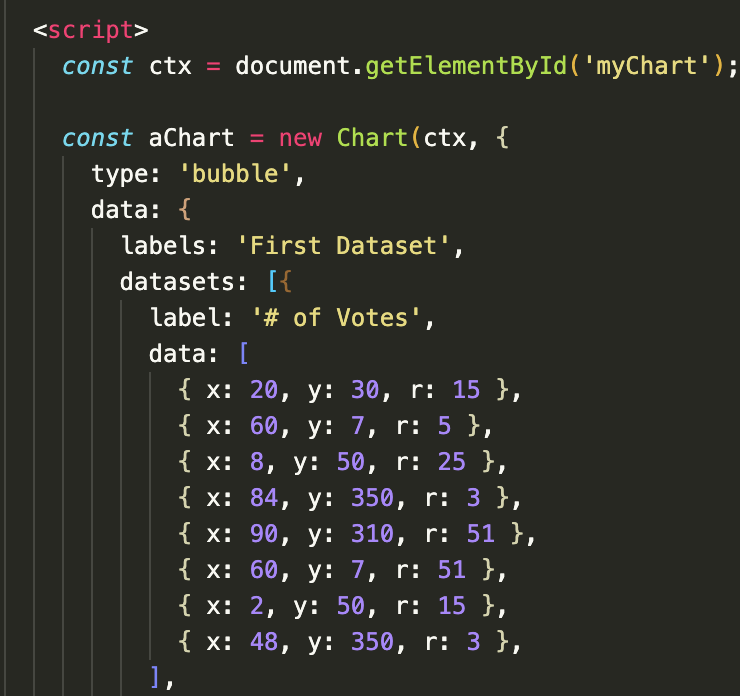
- Bubble Chart
- Area Chart
- Radar Chart
- Mixed Chart
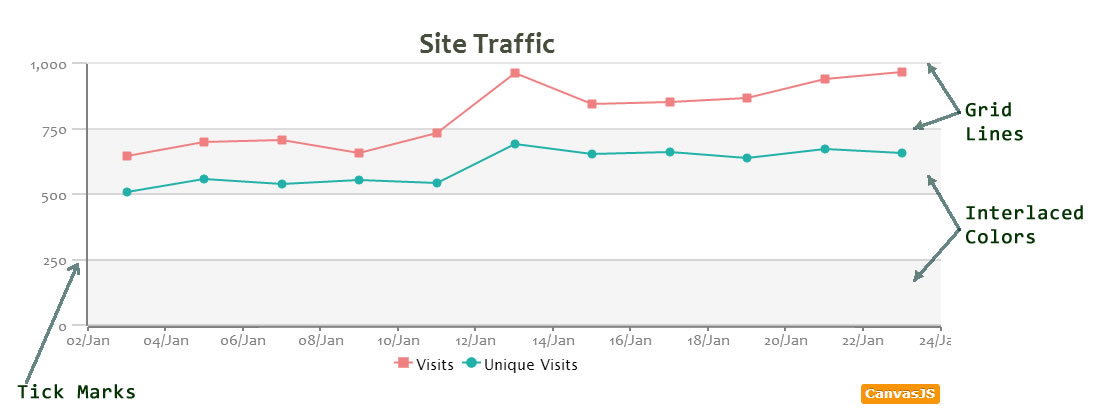
Tick Marks, Grid Lines and Interlaced Colors
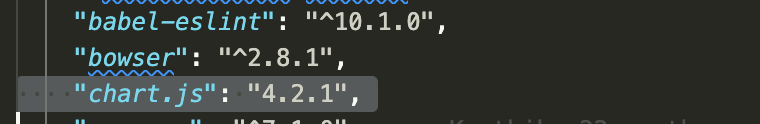
Include it in package.json
- run yarn
How to use it in Ember?
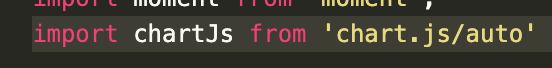
Include it in your template or component
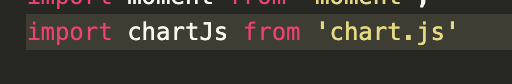
Dev env
Prod env
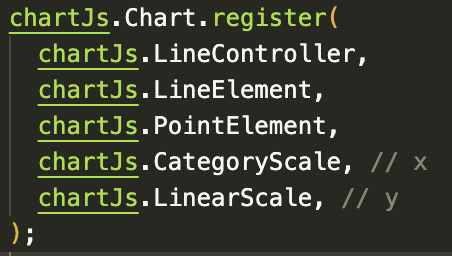


Init
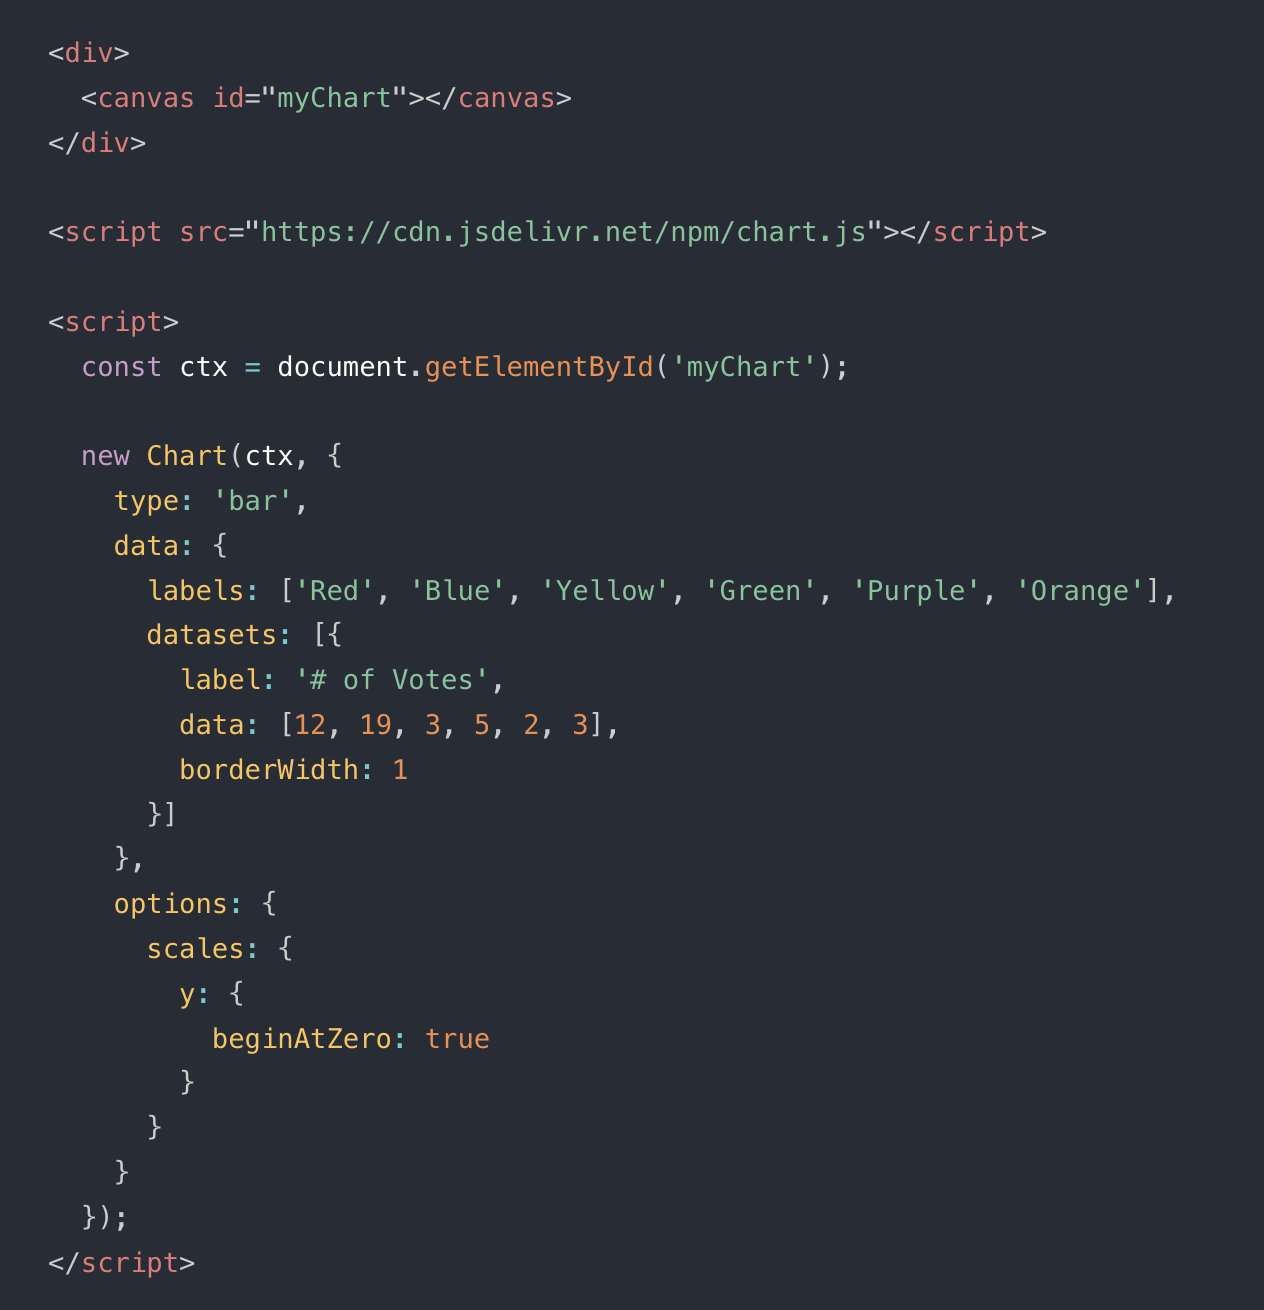
Bar Chart
Unique ID
Context DOM Element
Initialize
HTML examples
Re-Agent code
More stuff to talk
- performance
- Native plugins
- Data Decimation
- Legend
- Title
- Tooltip
- Custom plugins
- dataset-properties (scriptable yes/no)
- Scriptable options
- and many more
More examples
Extras
ChartJs
By Alvaro Uribe


