Визуализация данных в Data Science
Андрей Лукьяненко
CV R&D Lead, MTS AI

Содержание
- Что такое визуализация данных и зачем это нужно
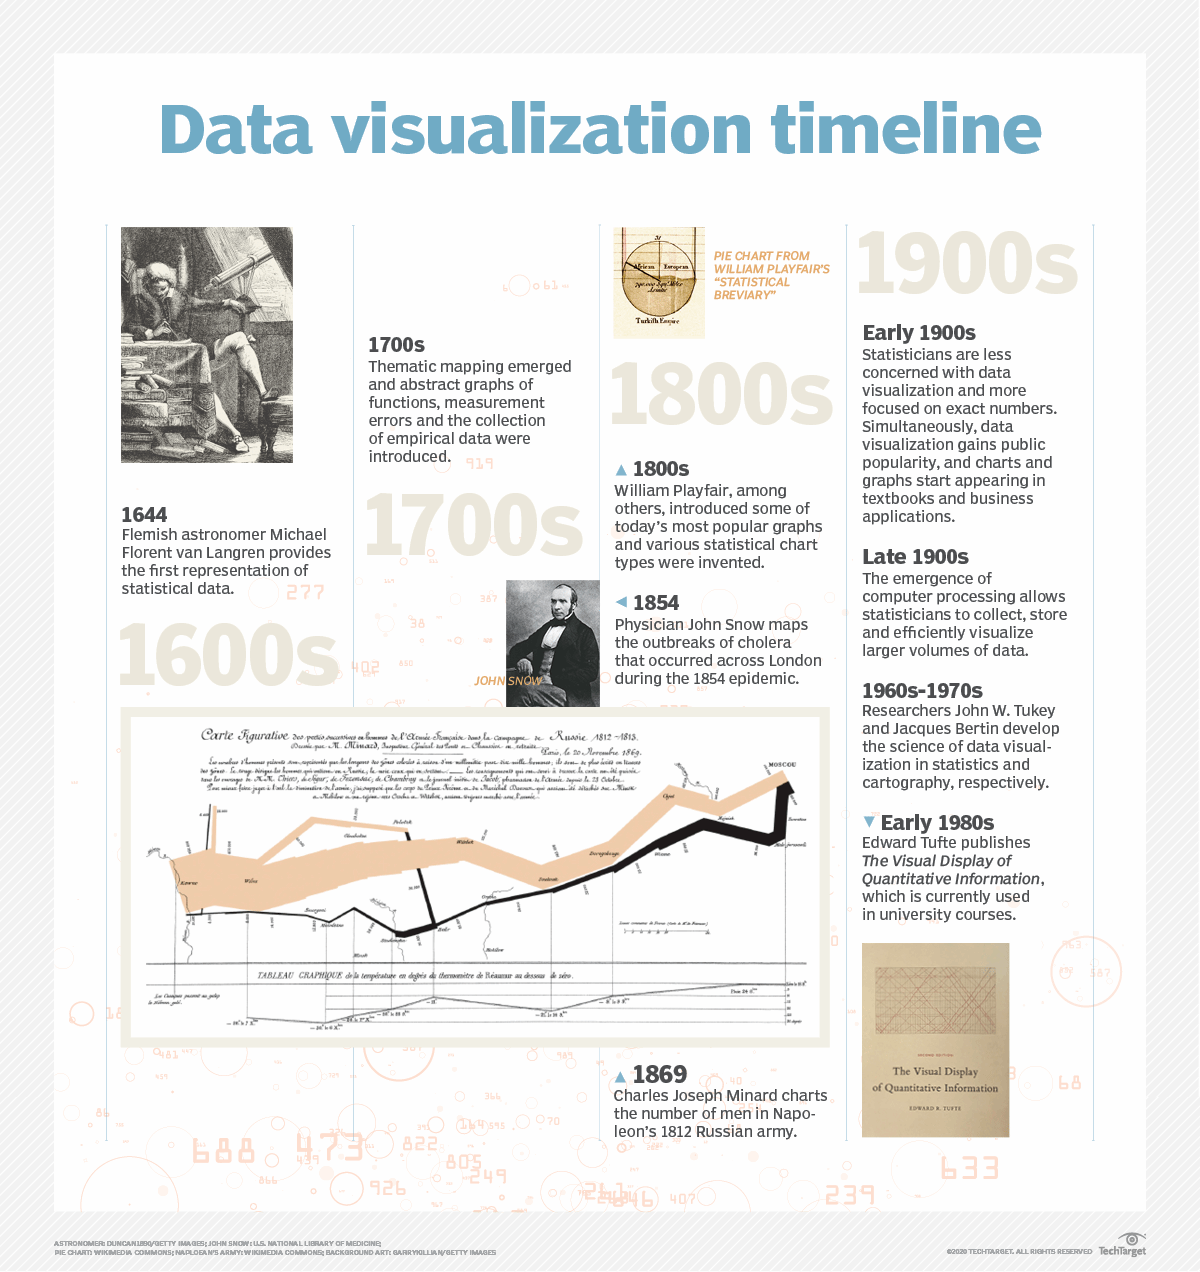
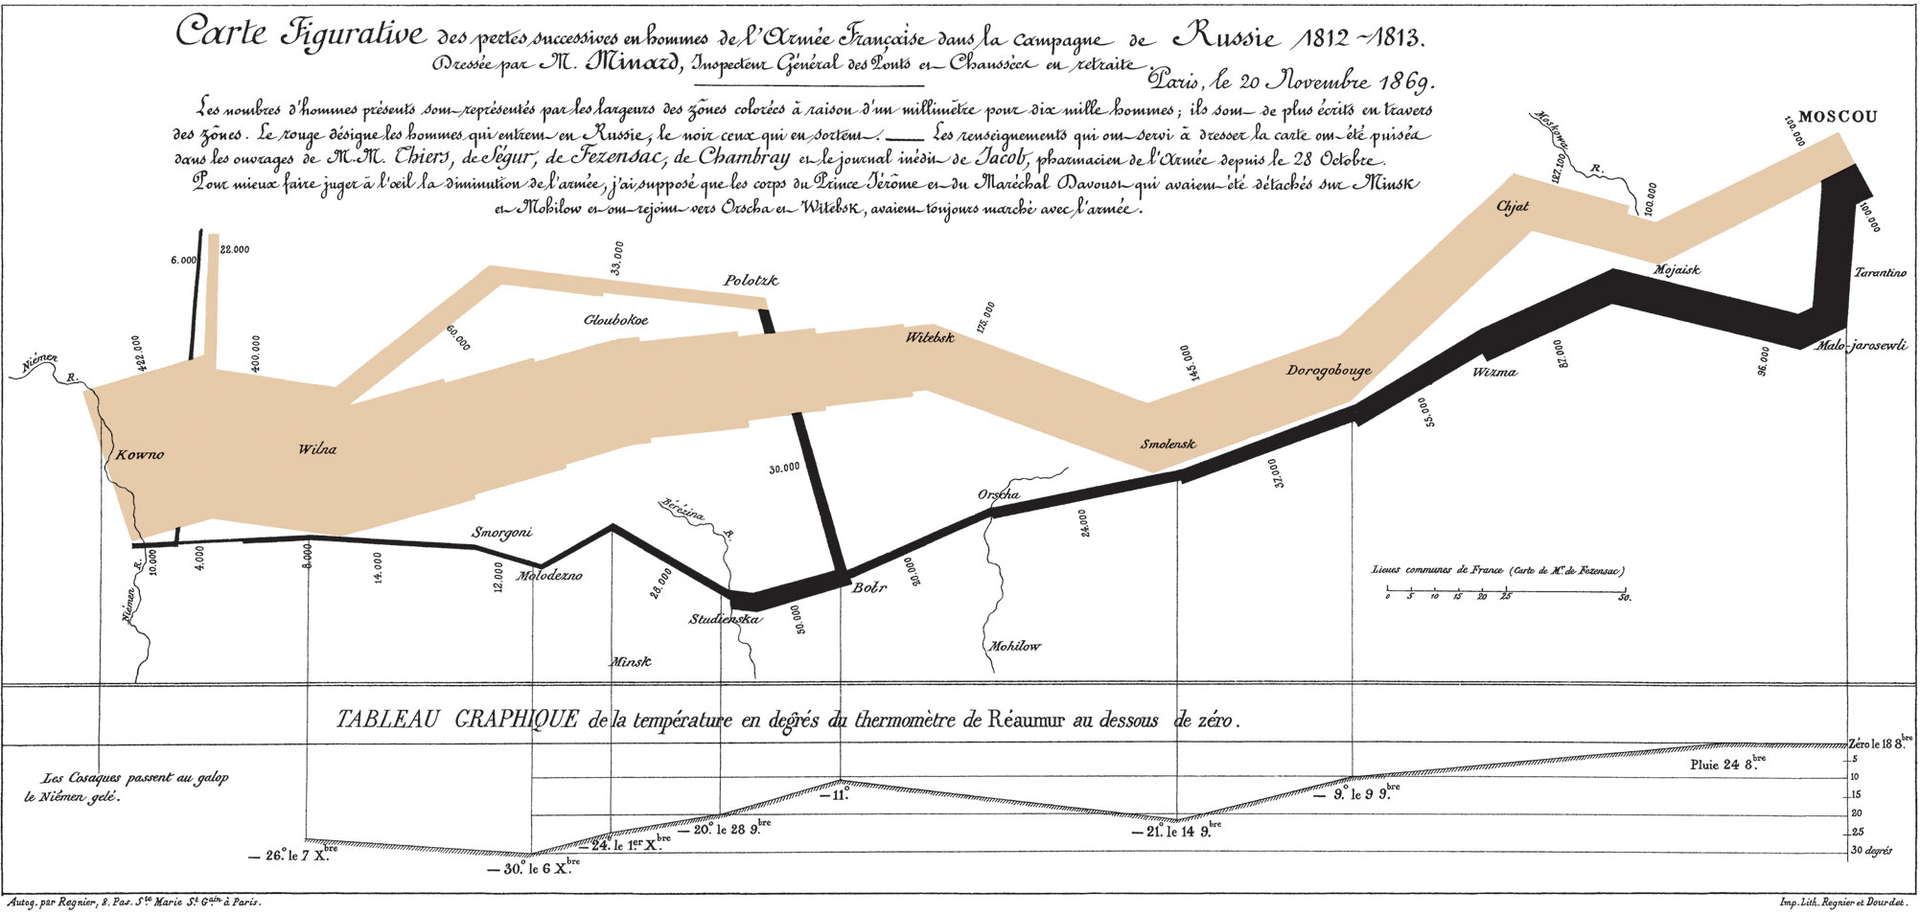
- Немного истории
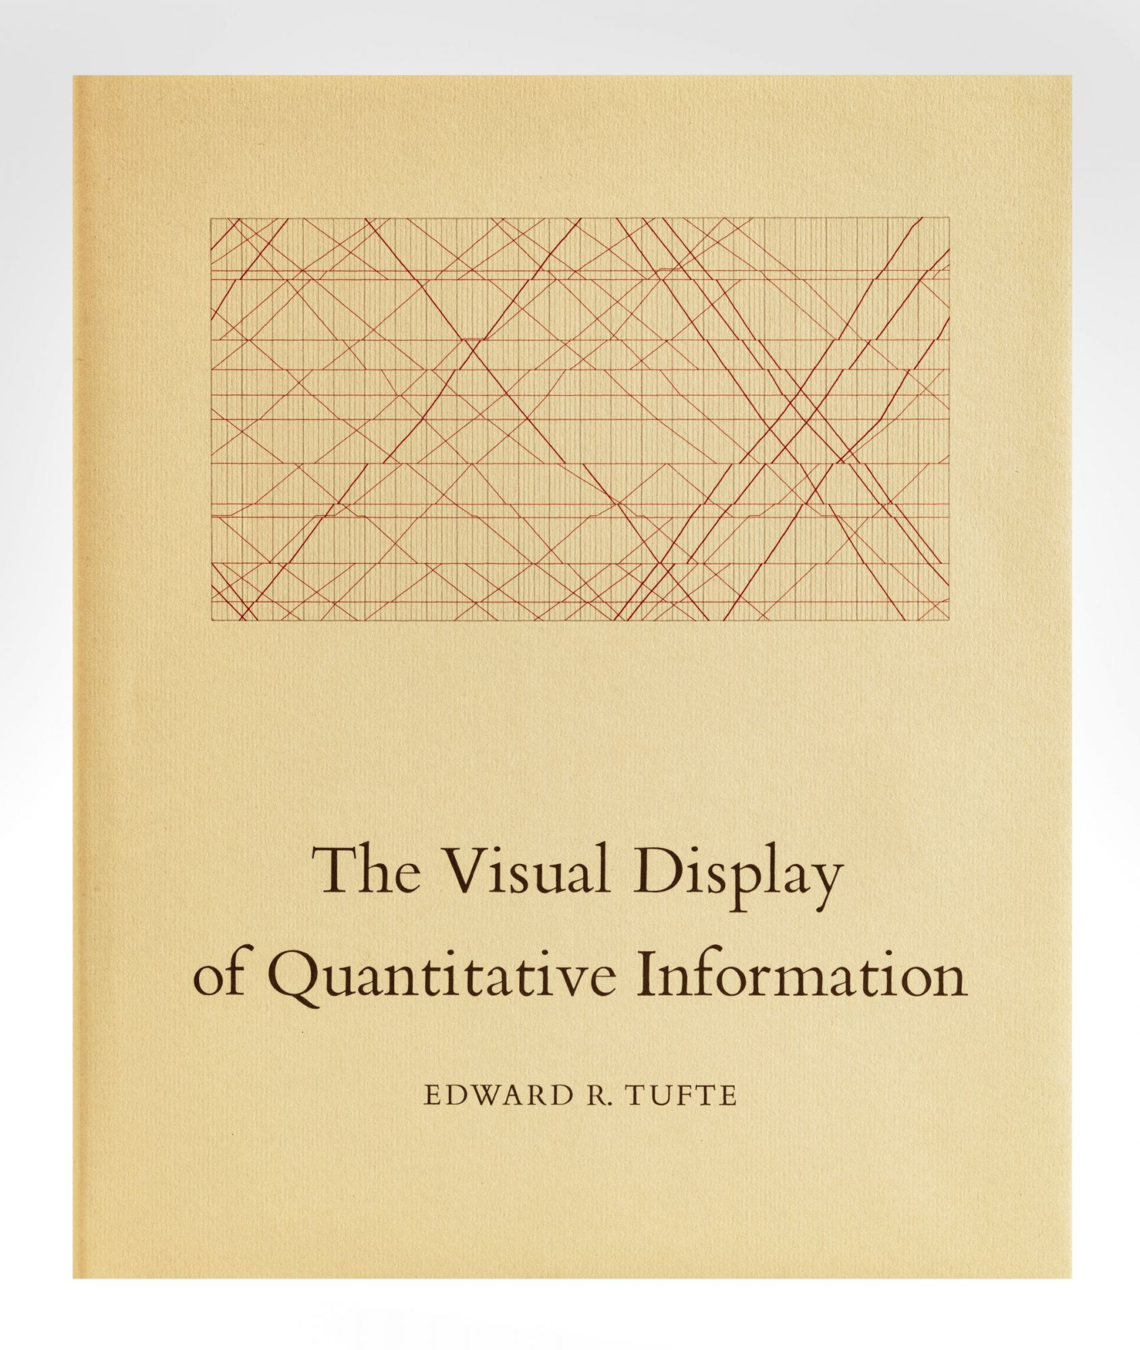
- Tufte
- Софт для создания графиков
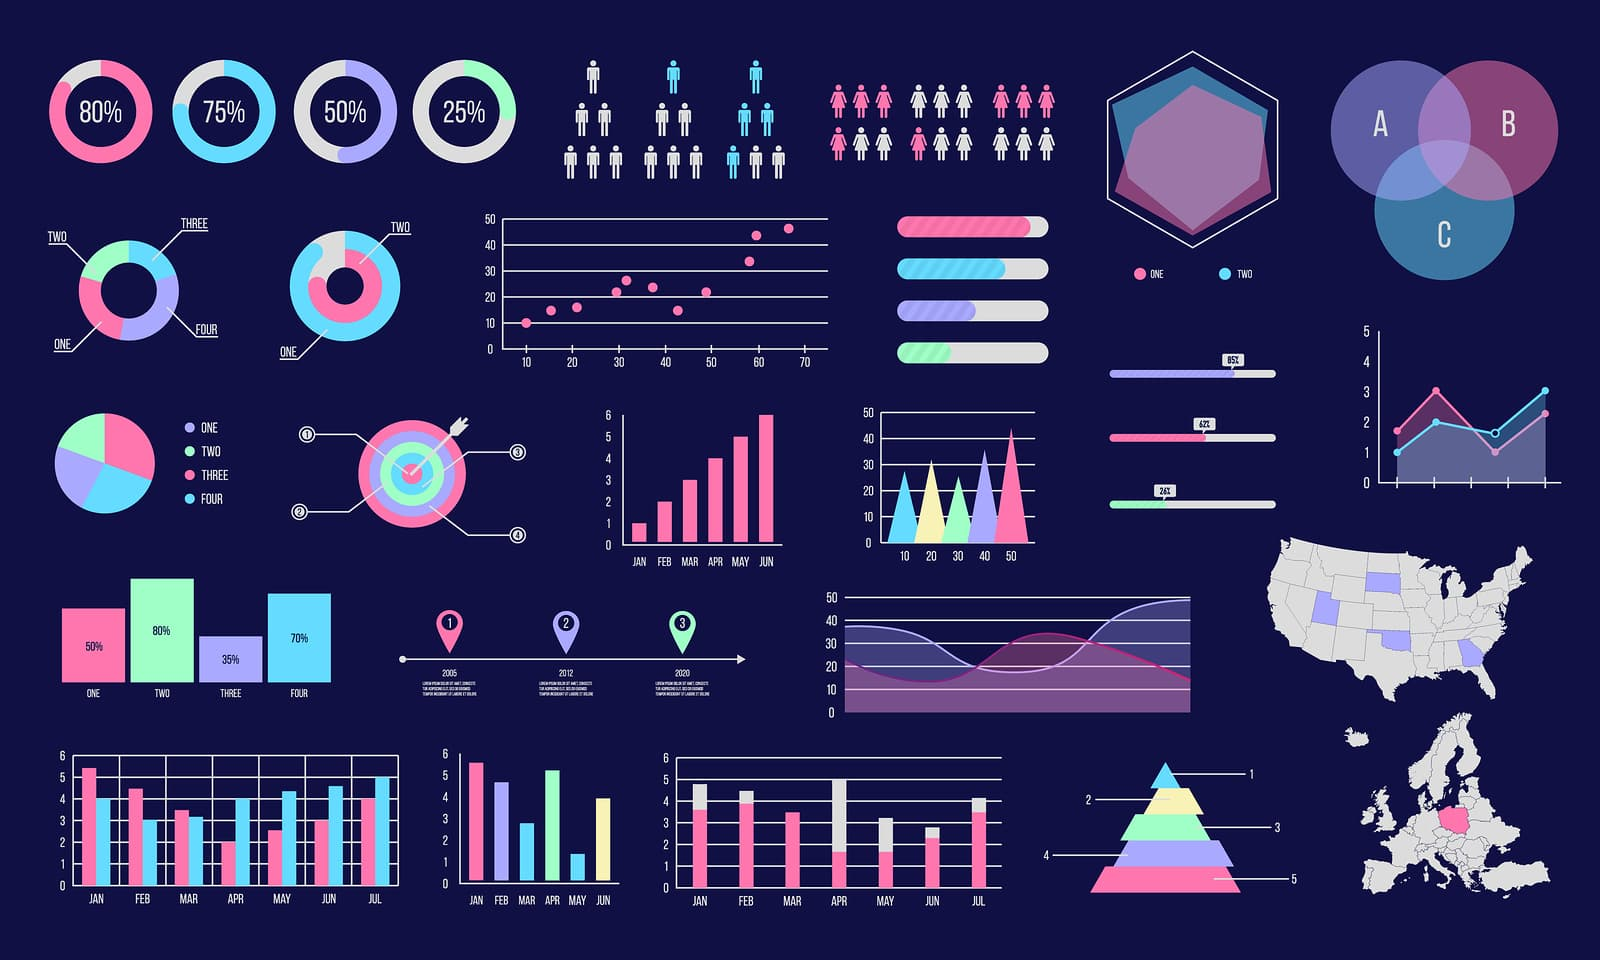
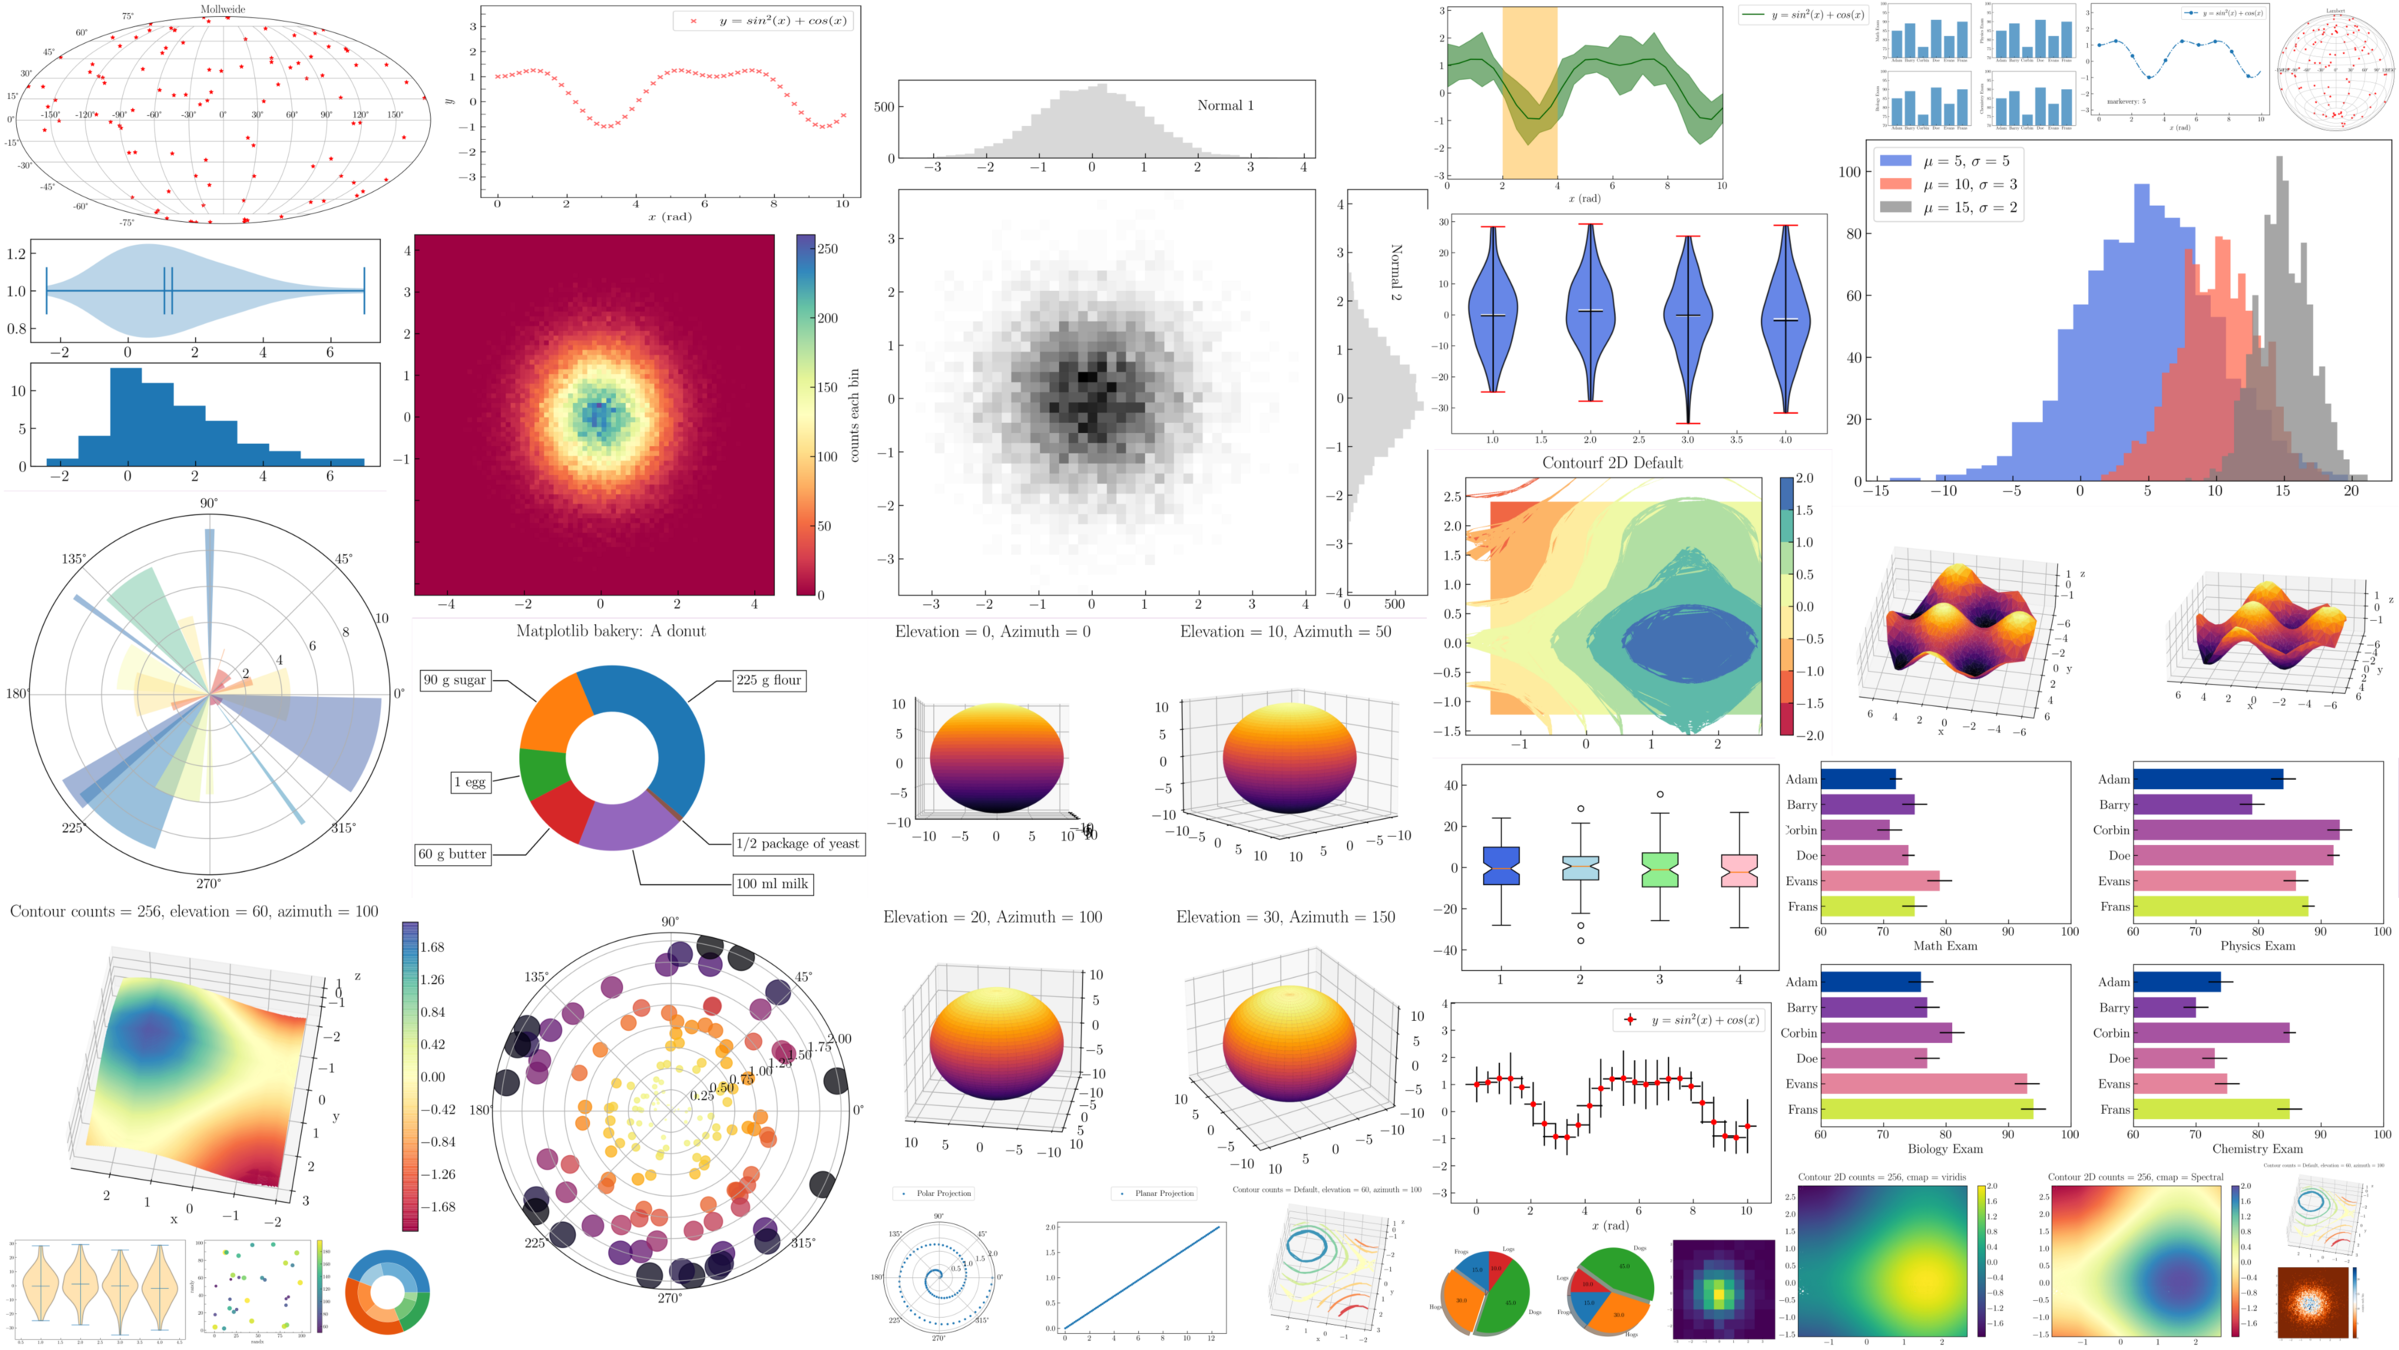
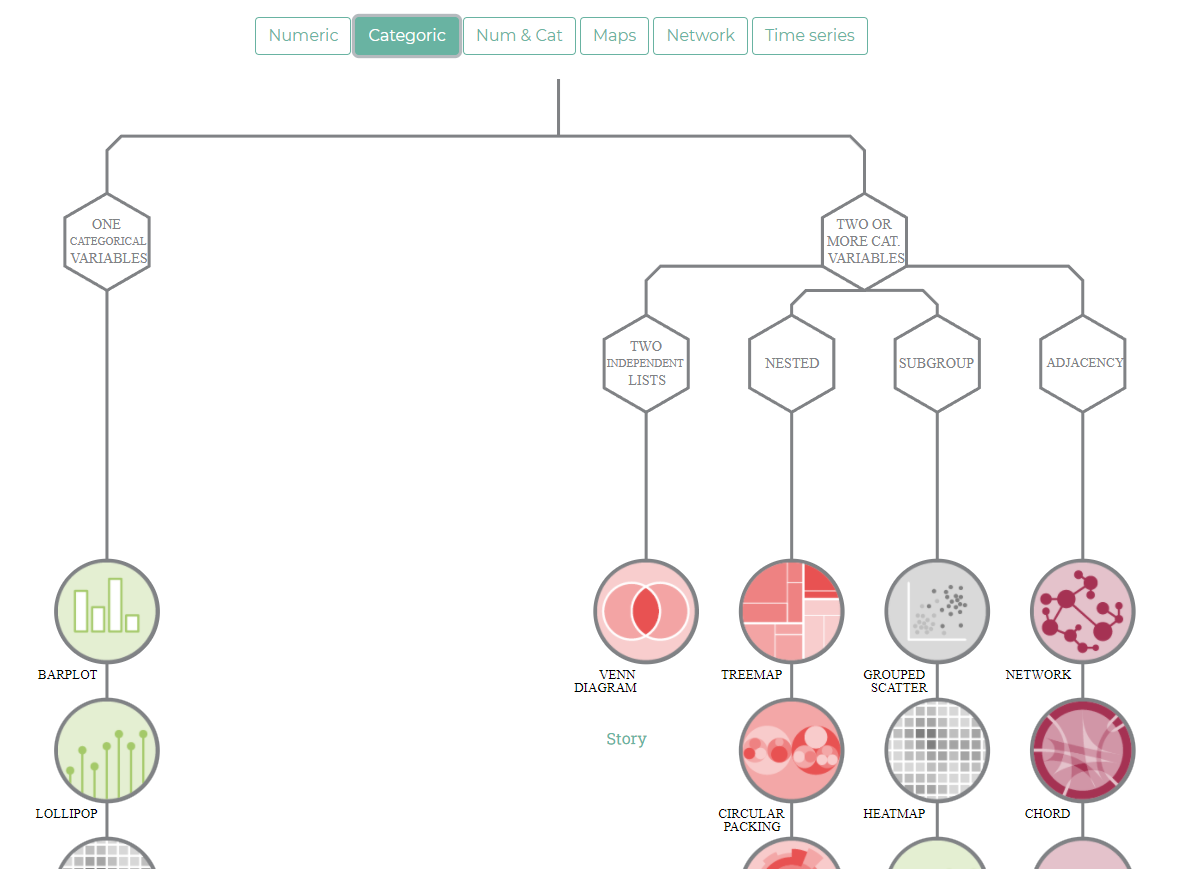
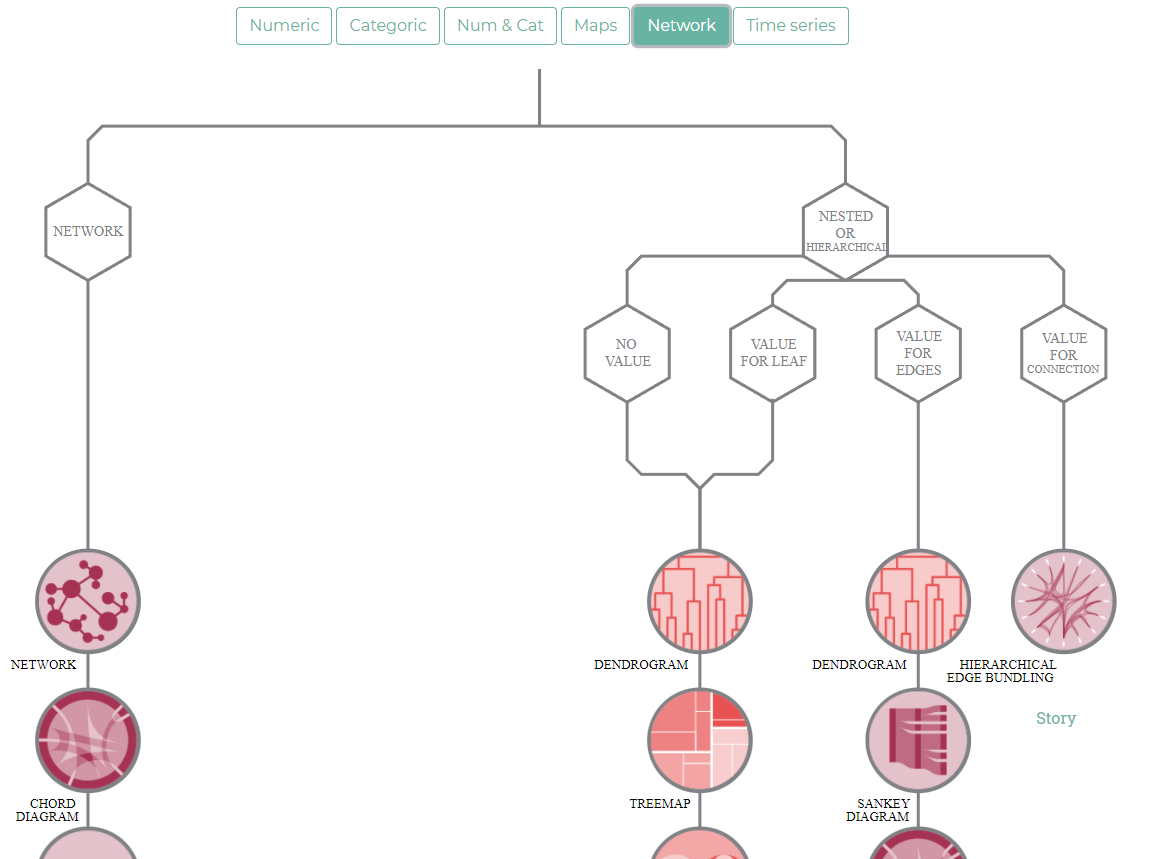
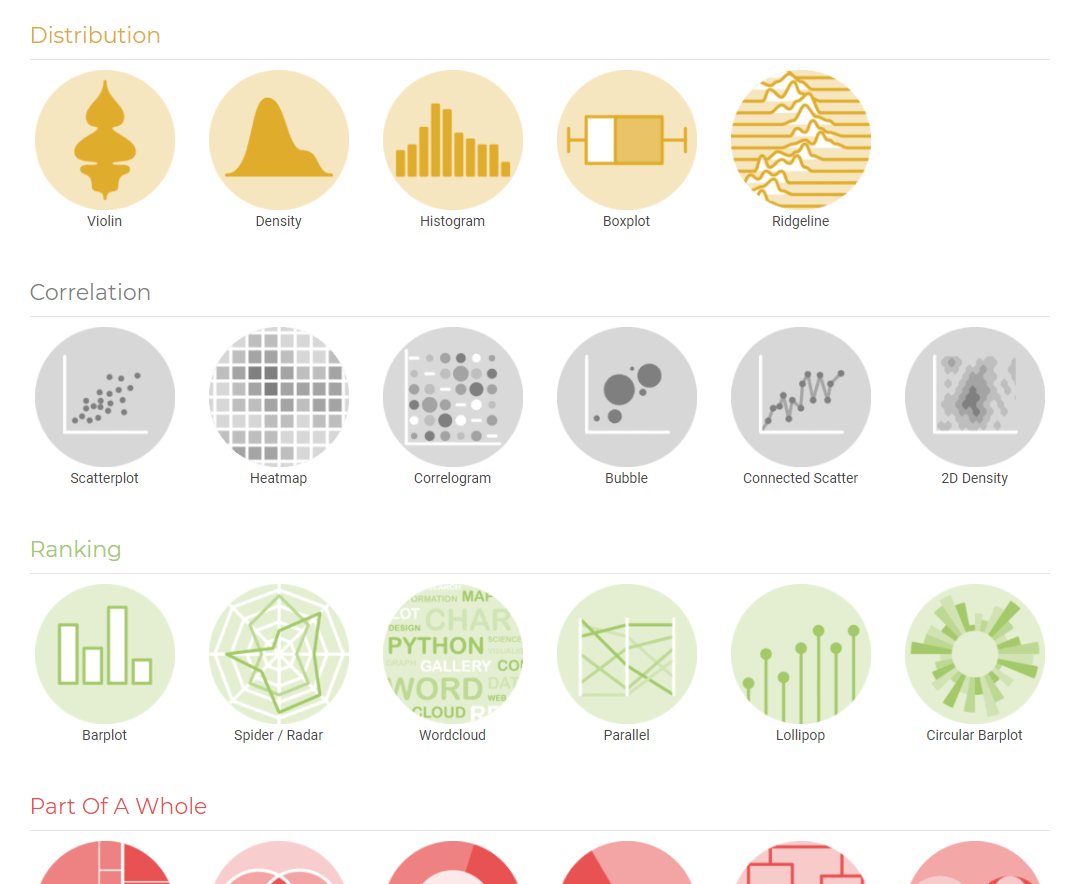
- Типы графиков
- Навыки для создания профессиональных визуализаций
- Как делать хорошо и не делать плохо
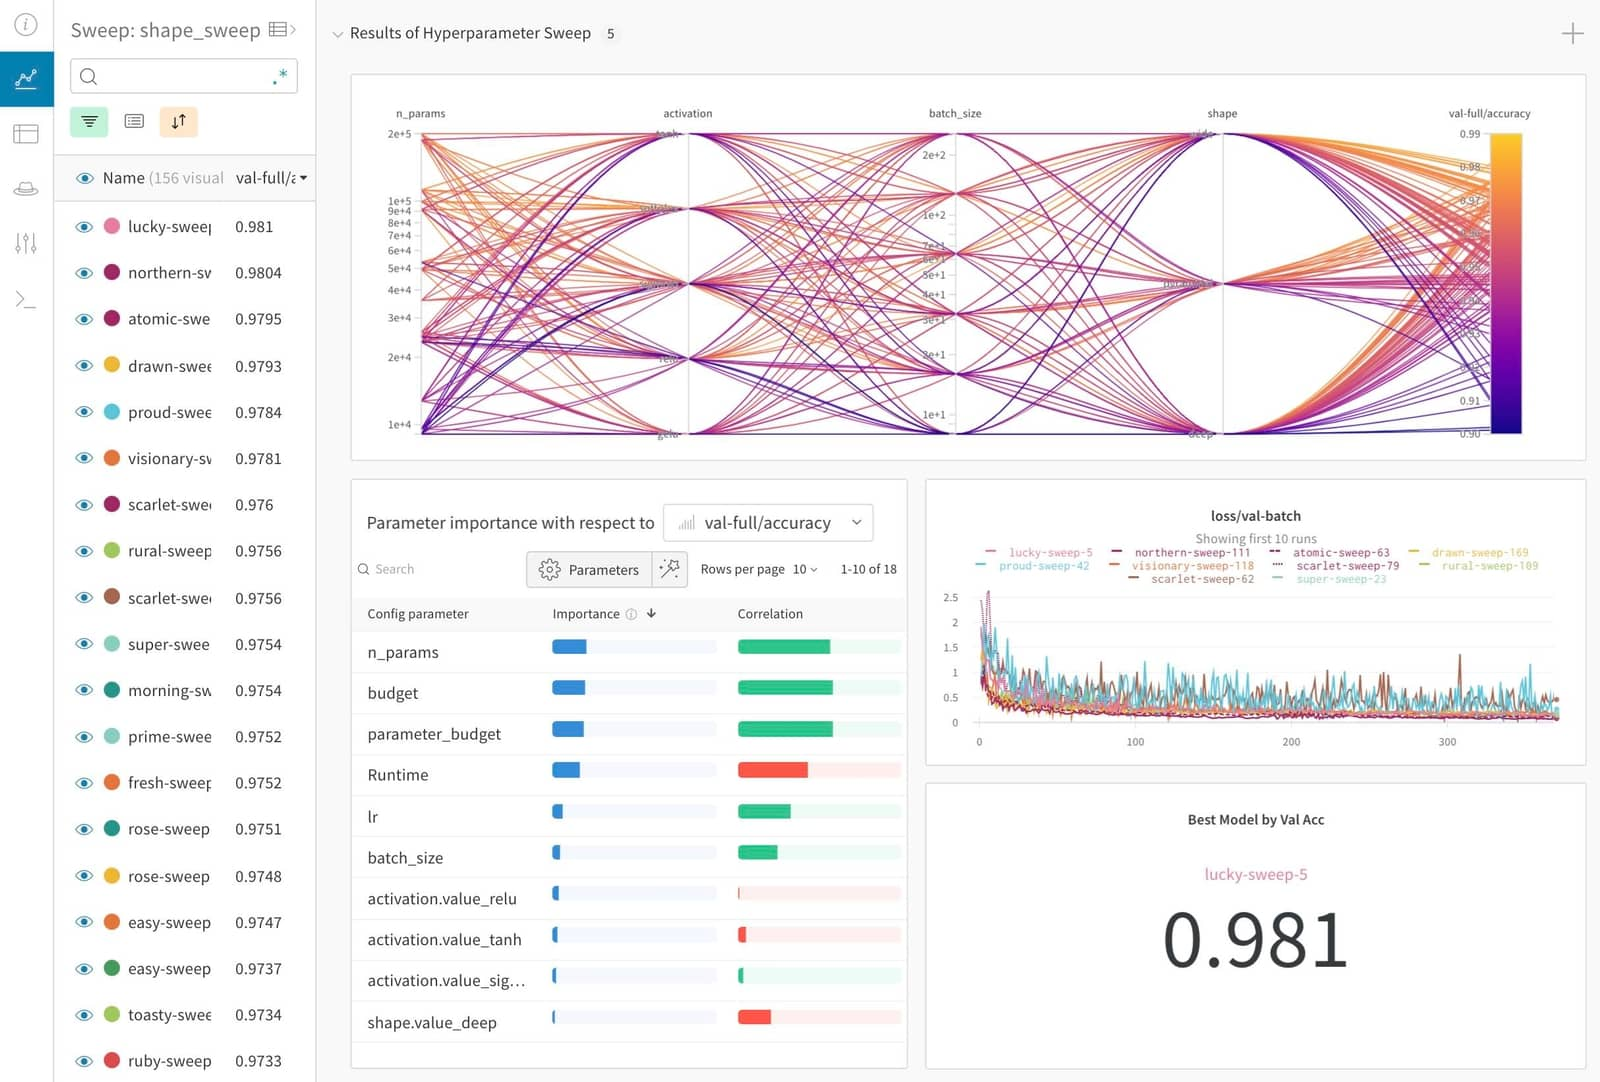
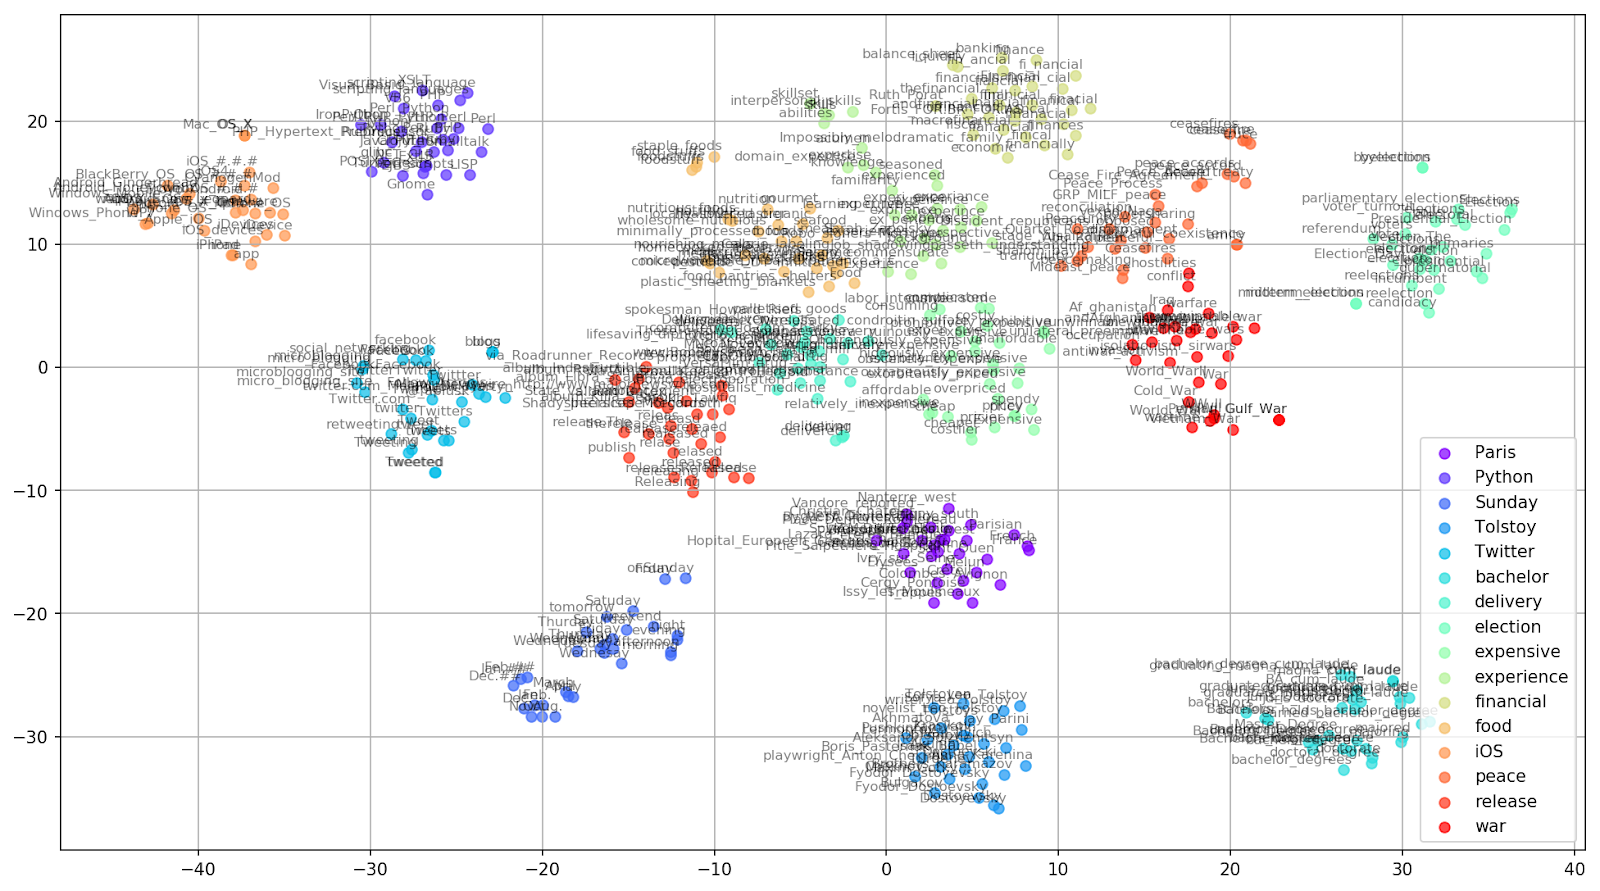
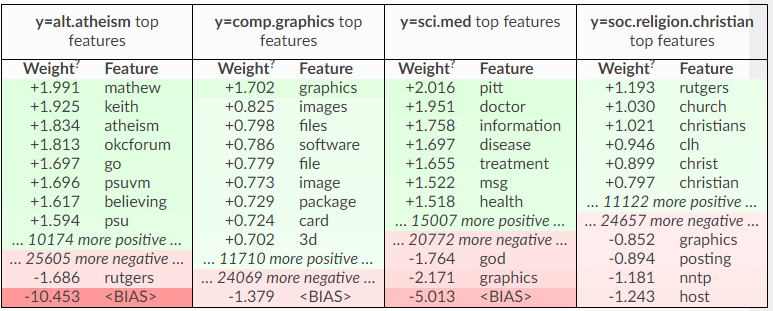
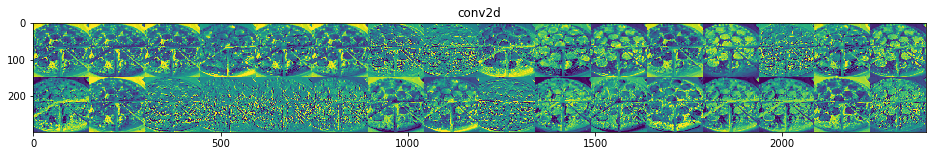
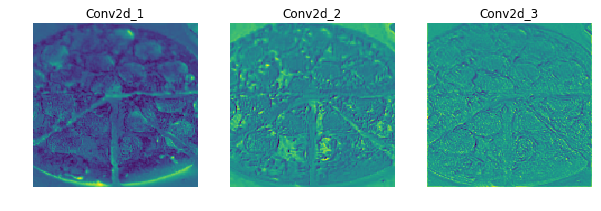
- Визуализации для задач машинного обучения
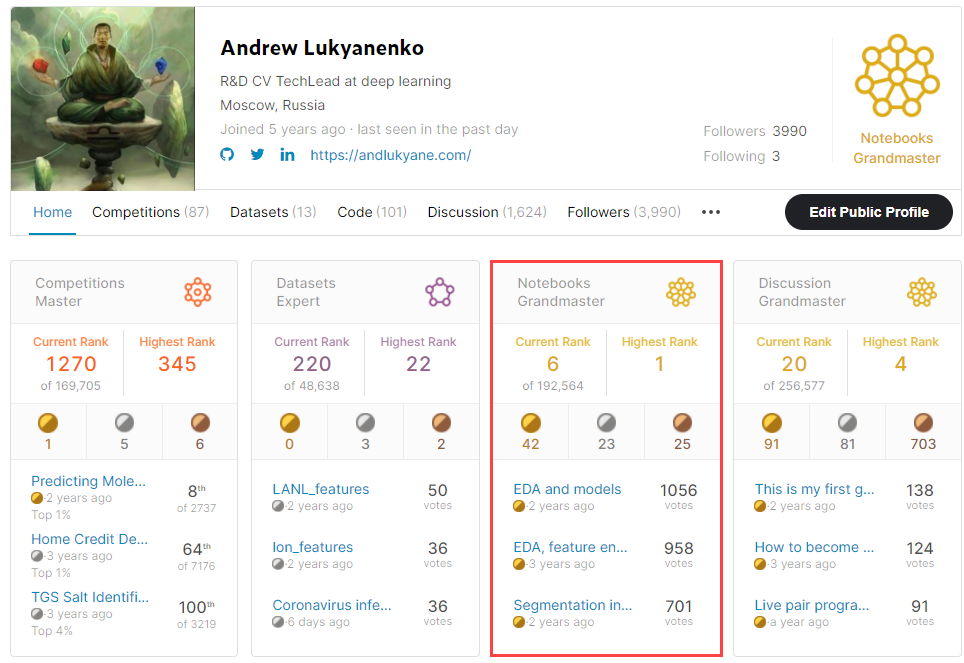
Почему важны визуализации
Почему важны визуализации

Tufte
- Максимизация "data ink-ratio"
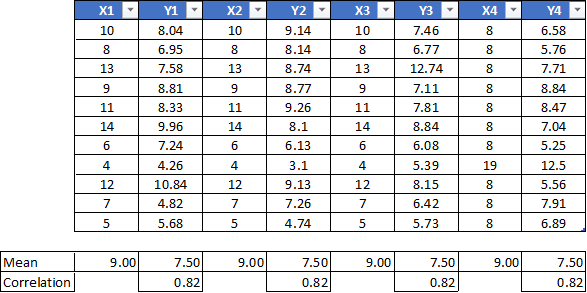
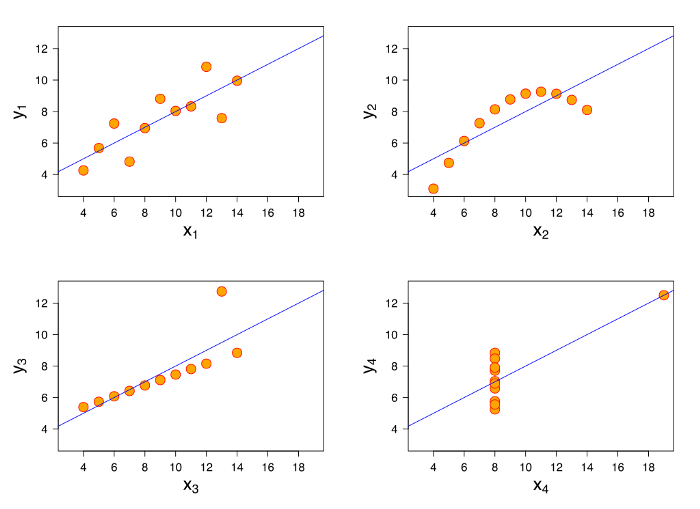
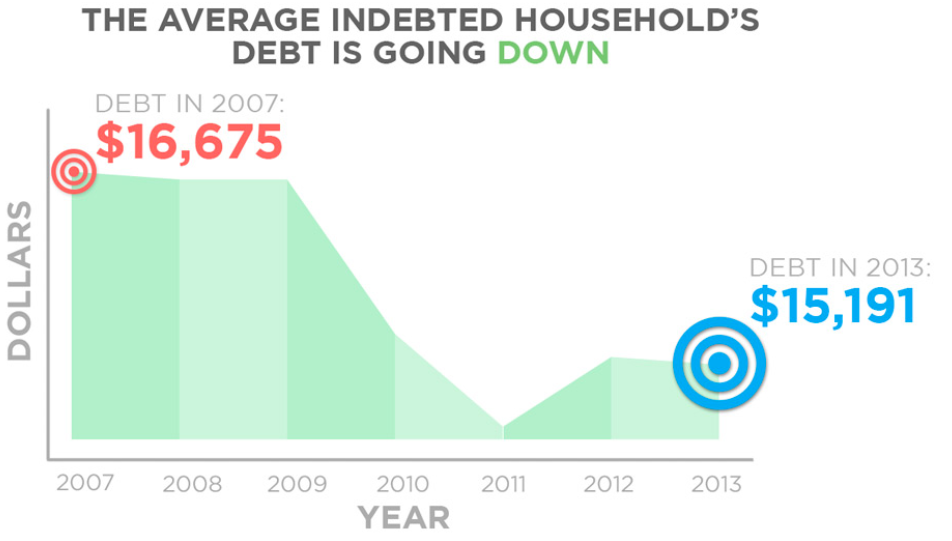
- Минимизация вранья
- Минимизация бесполезного
- Использование правильного масштаба и названий
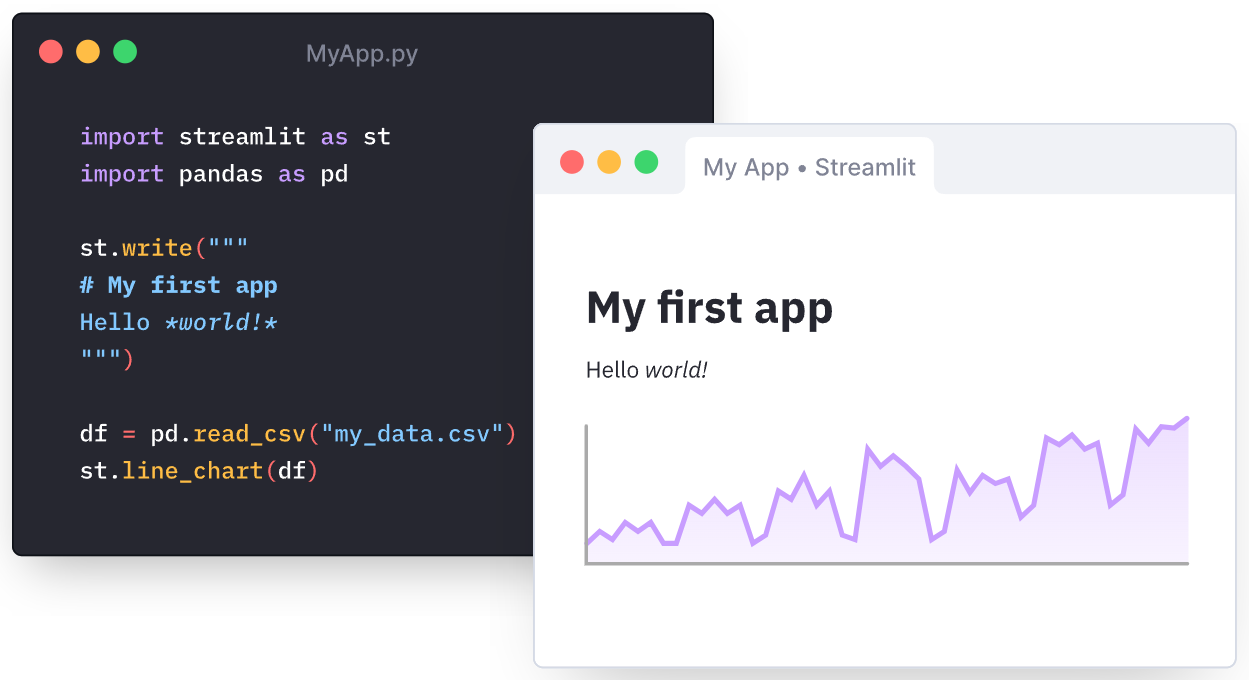
Python. Matplotlib
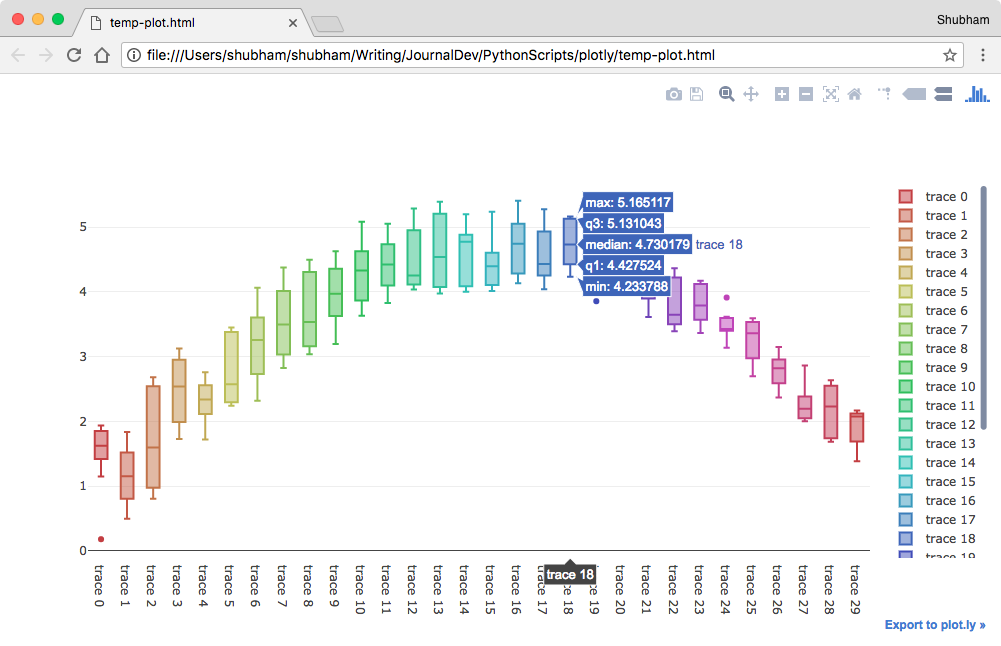
Python. Plotly
Python. Altair
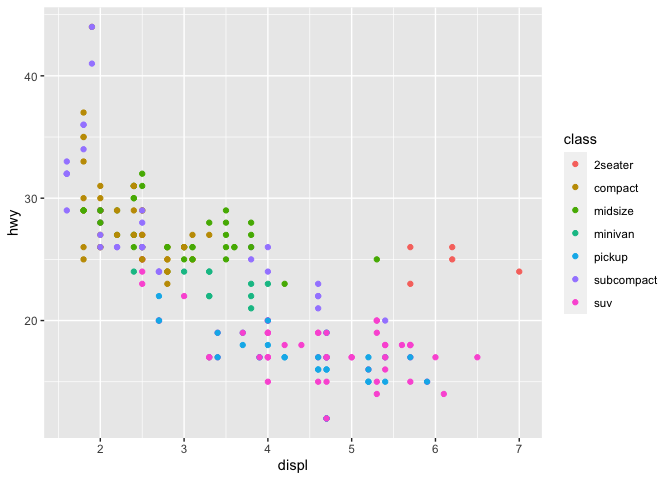
R
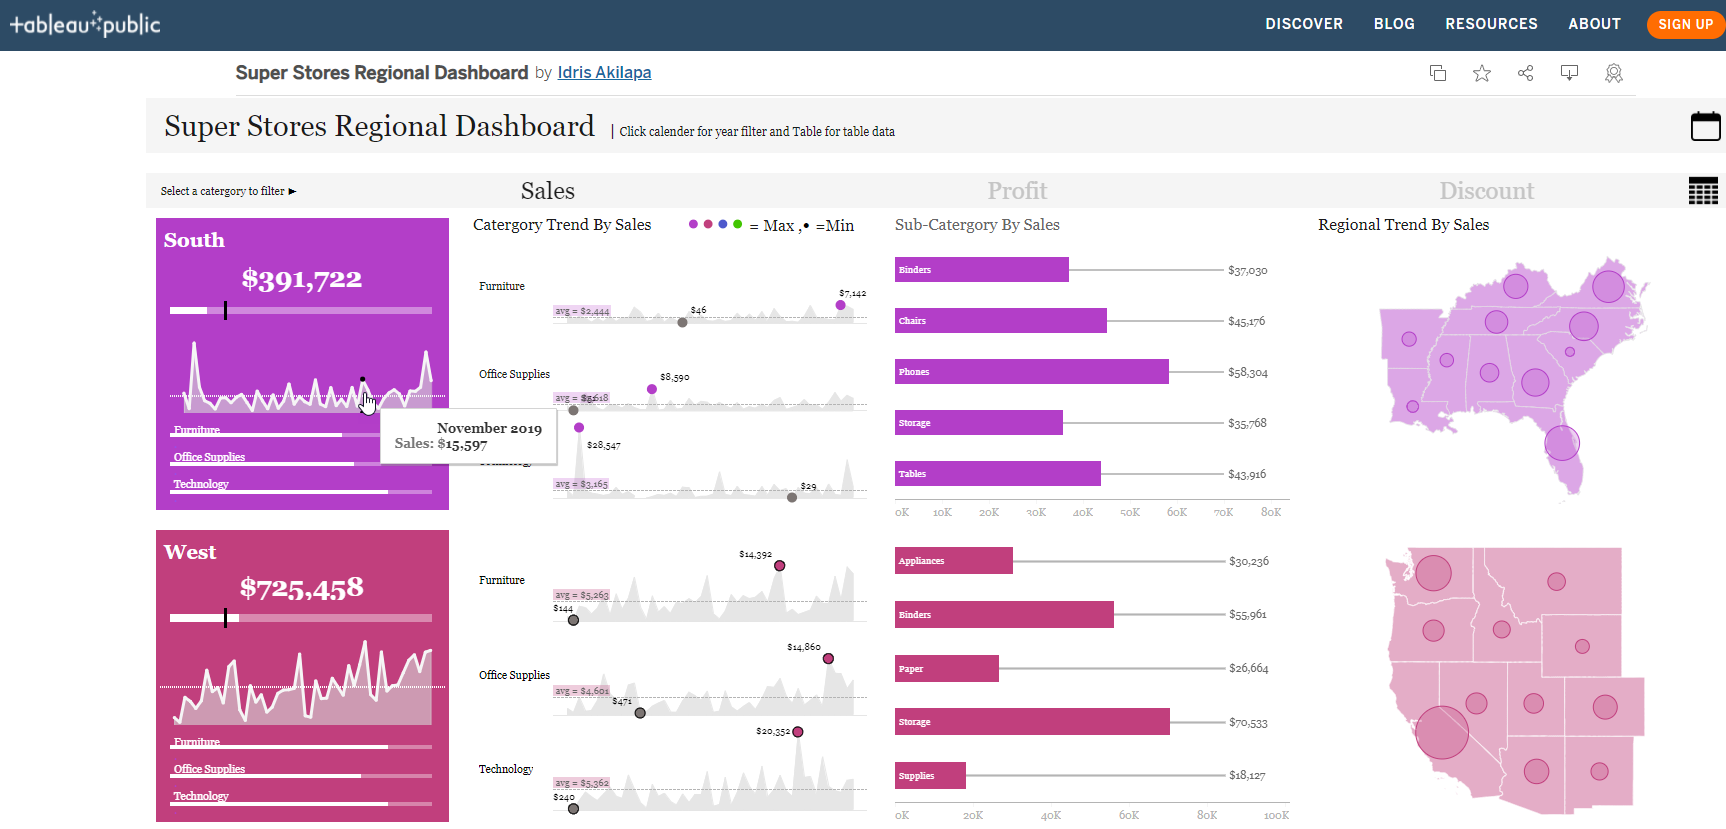
Tableau
D3.js
Навыки
- Визуализация данных
- Графический дизайн, дизайн интерфейсов и UX
- Сторителлинг
- Color: Hue, Value/Lightness, Saturation/Chroma, RGB vs CMYK
- Доступность
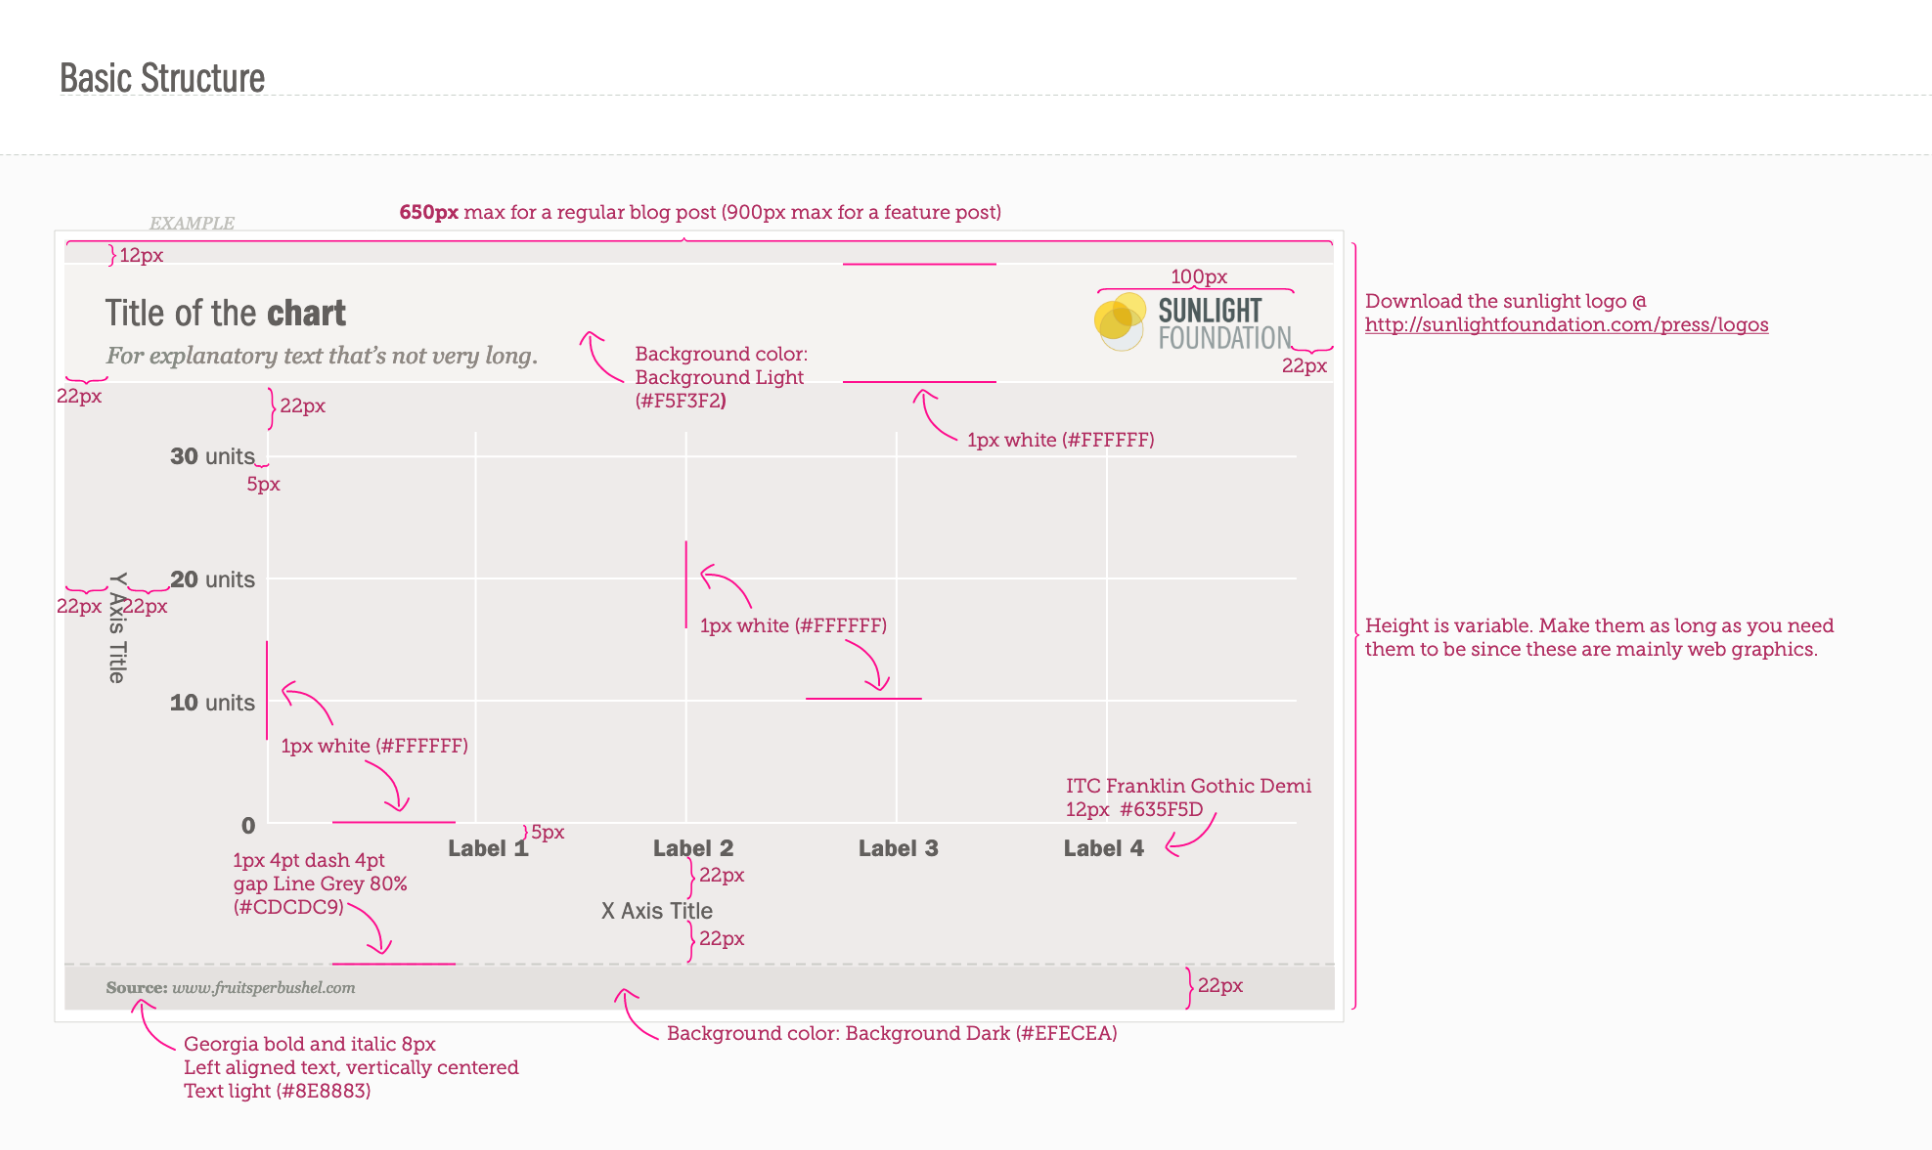
- Style guide
Style guide
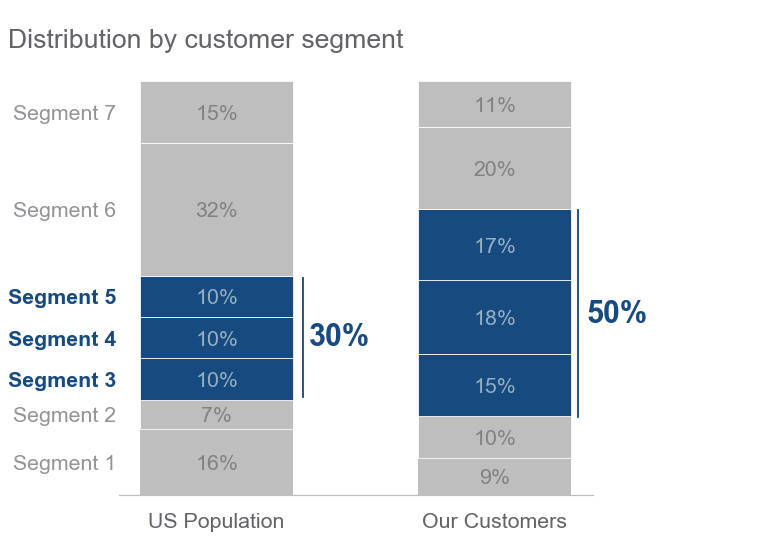
Улучшения
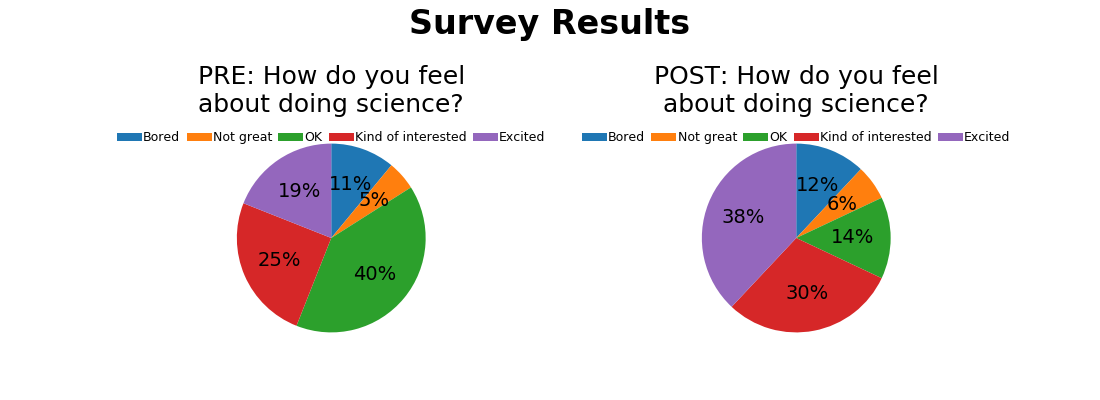
Улучшения
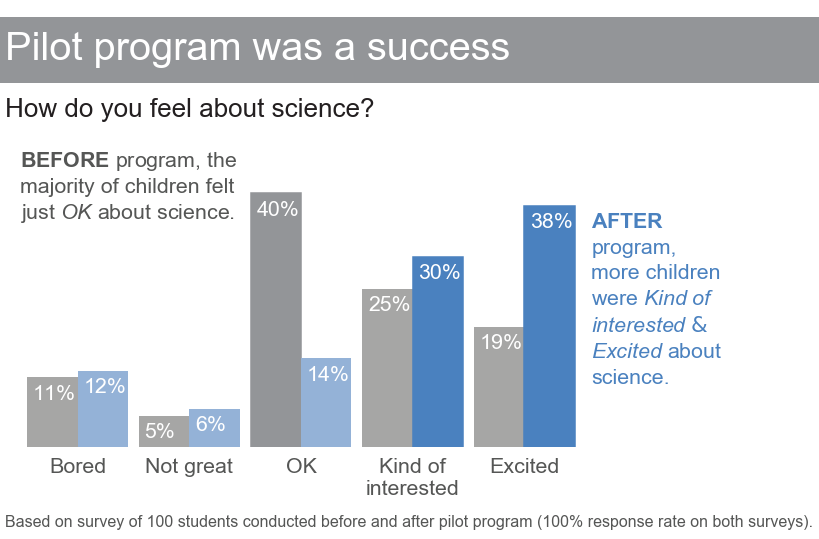
Улучшения
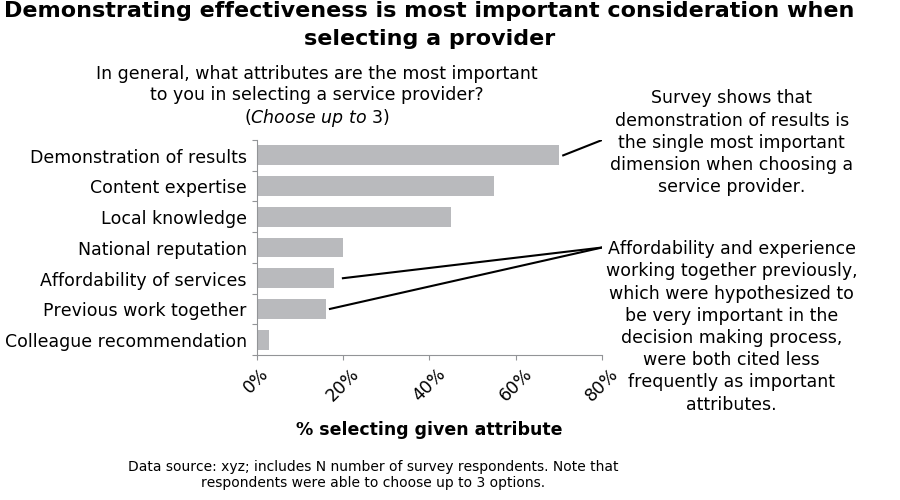
Улучшения
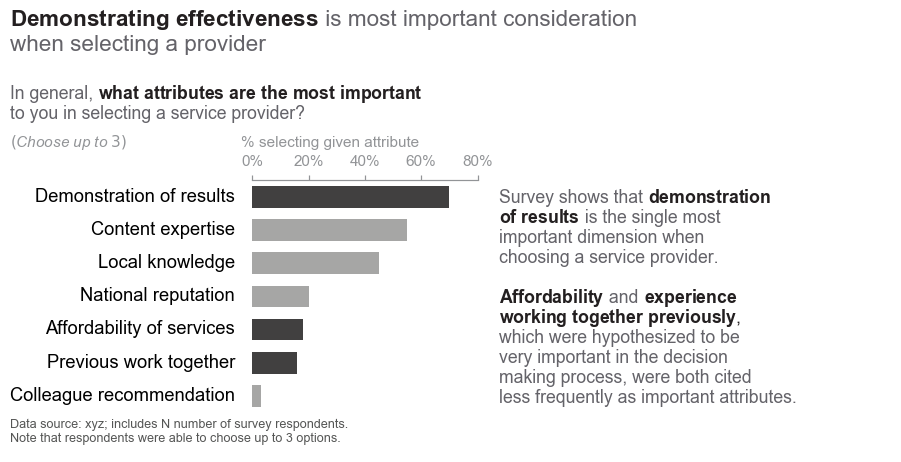
Улучшения
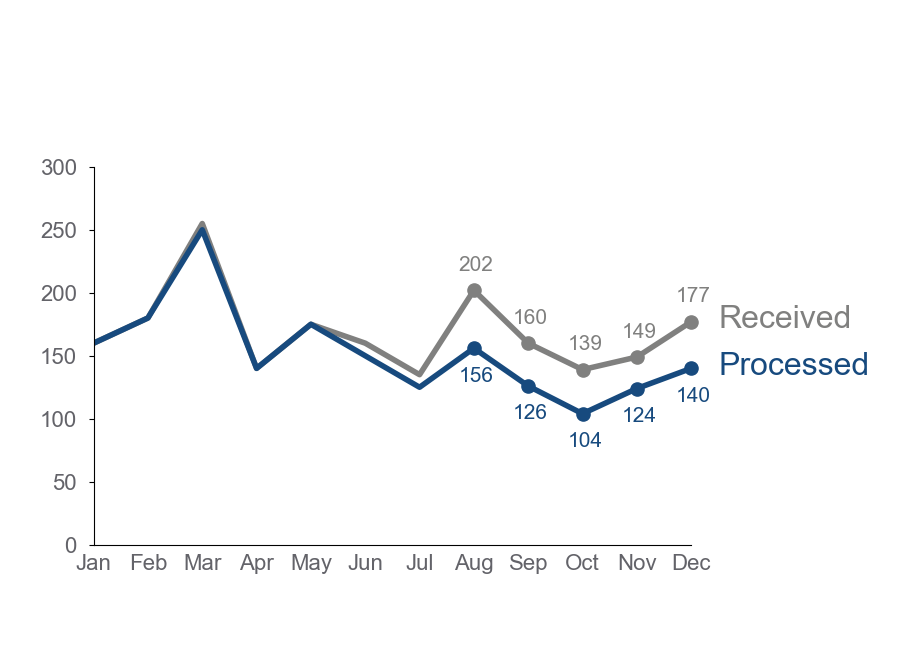
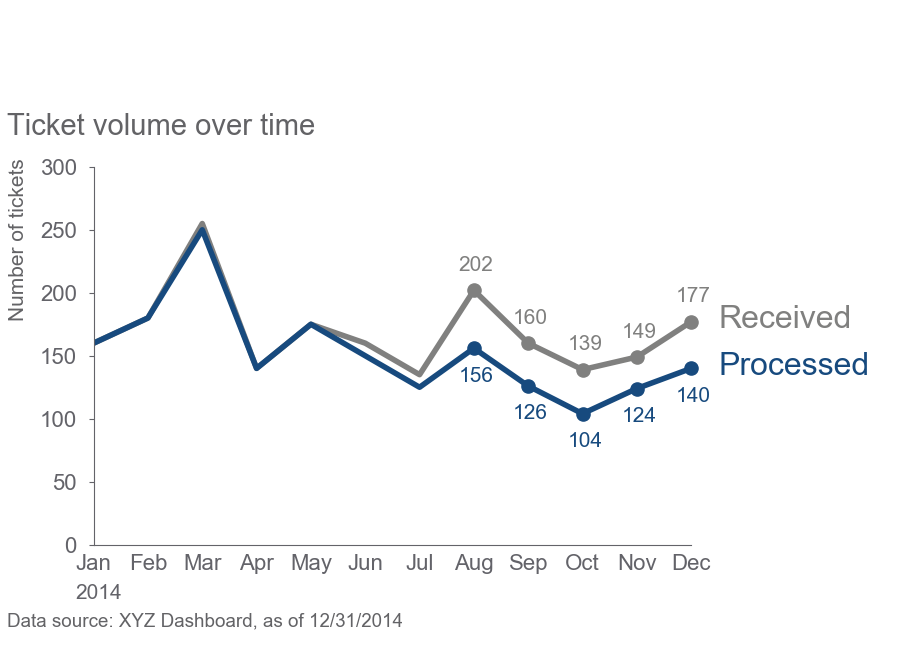
Улучшения
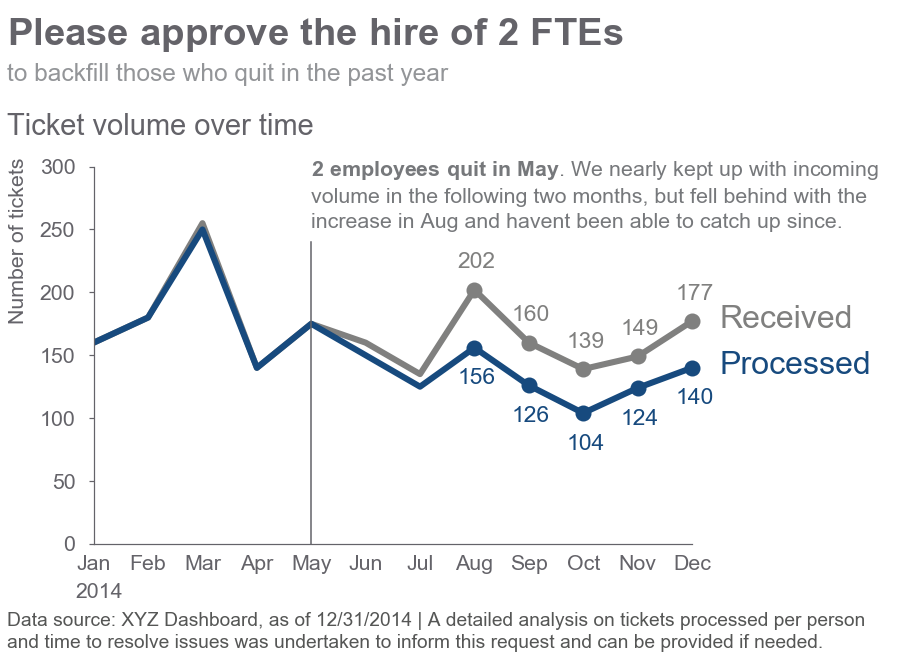
Улучшения
Улучшения
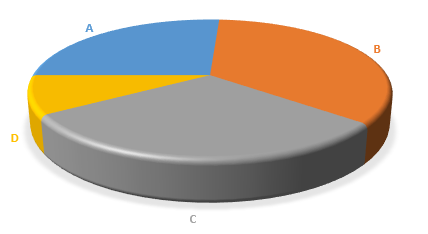
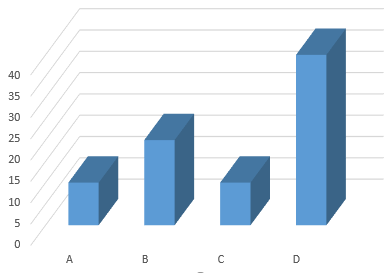
Что делать и не делать
- Exploratory vs explanatory, показать то, что важно
- Pie, 3D

Ссылки
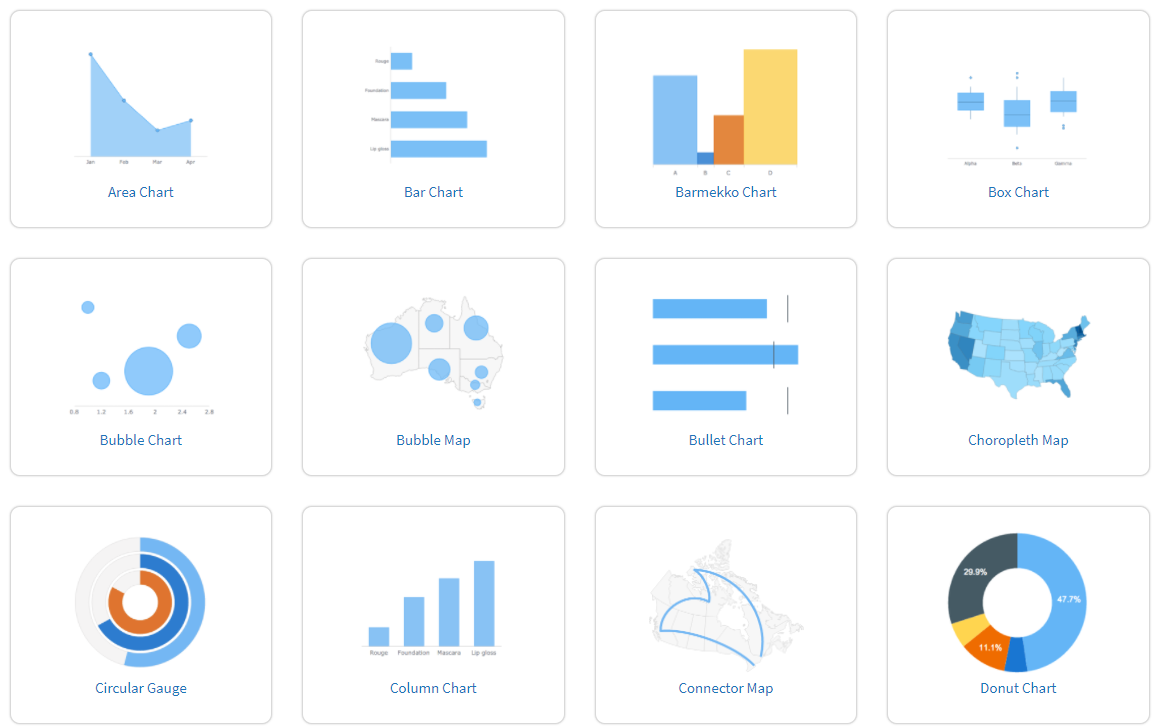
- https://www.anychart.com/chartopedia/usage-type/
- https://gramener.github.io/visual-vocabulary-vega/#
- https://www.python-graph-gallery.com/
- https://raw.githubusercontent.com/Financial-Times/chart-doctor/main/visual-vocabulary/poster.png
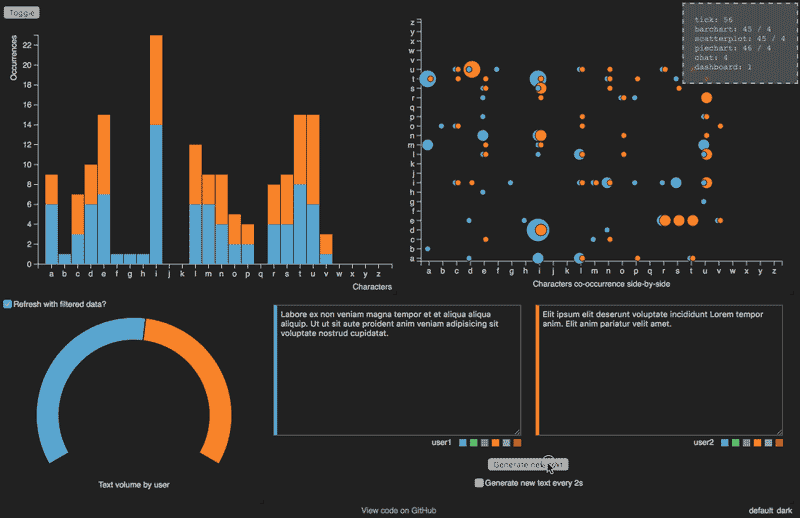
- https://textvis.lnu.se/
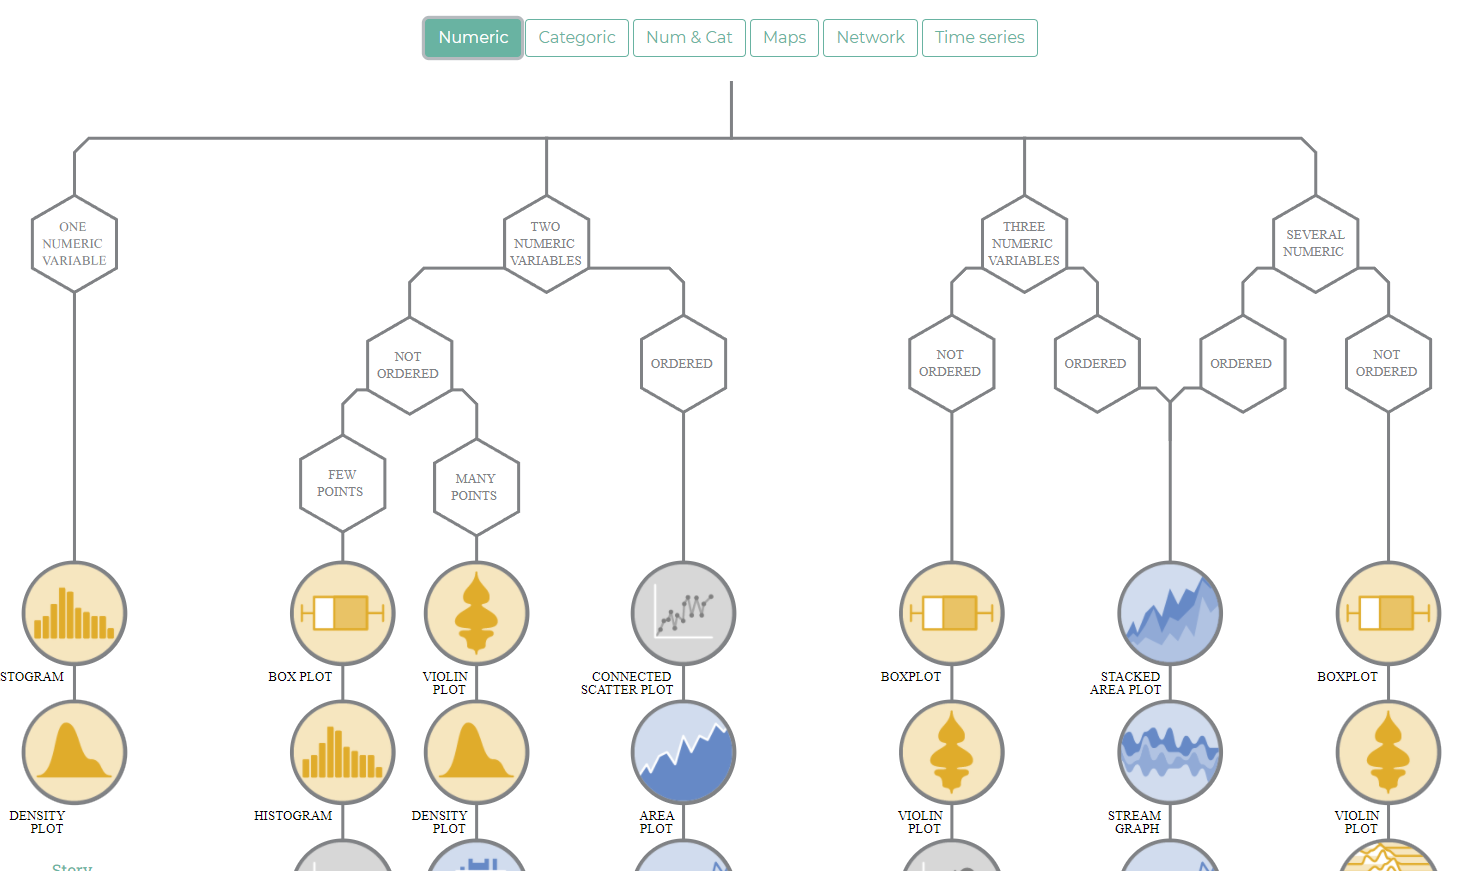
- https://www.data-to-viz.com/
- https://www.datavisualizationsociety.org/
- https://t.me/nastengraph
-
https://towardsdatascience.com/data-visualization-in-data-science-5681cbdde5bf
-
https://github.com/Financial-Times/chart-doctor/tree/main/visual-vocabulary
-
https://revealthedata.com/blog/all/navyki-dlya-vizualizacii-dannyh-i-dataviz-inzhenerov/
-
https://docs.google.com/document/d/1SUZ_DXt_WXPlv1IfqlrwTa00S7b3ghJ_2o_W4yE6_UA/edit#
-
https://blog.datawrapper.de/better-charts/
Ссылки
-
https://www.kaggle.com/spitfire2nd/enthusiast-to-data-professional-what-changes/
-
https://medium.com/nightingale/style-guidelines-92ebe166addc
-
https://www.tableau.com/learn/articles/best-data-visualization-blogs
-
https://boostlabs.com/blog/10-types-of-data-visualization-tools/
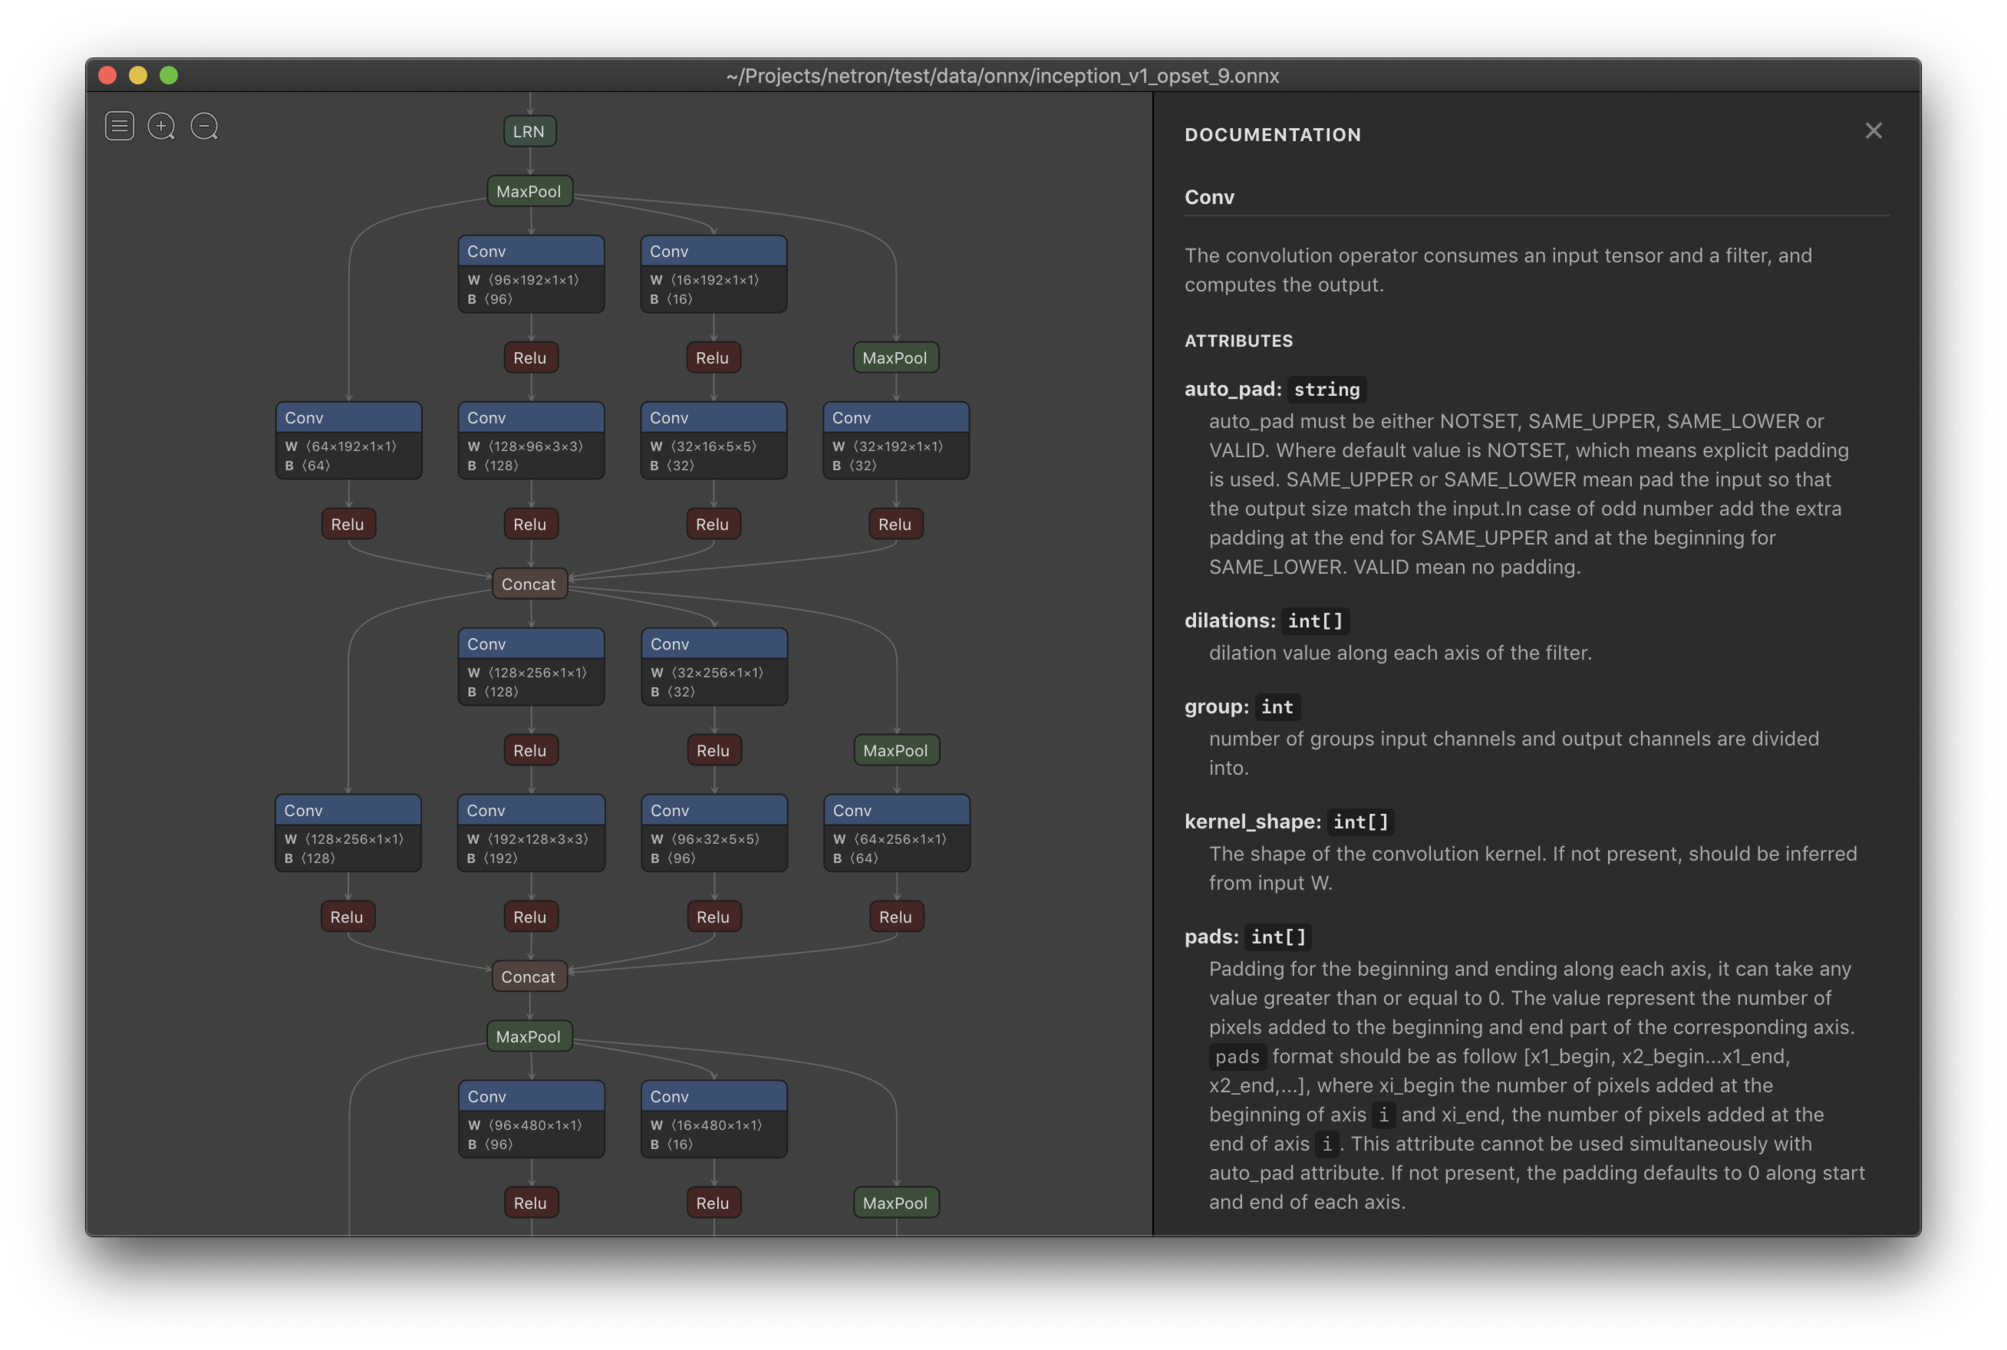
-
https://github.com/lutzroeder/netron
Ссылки
Ссылки
Контакты
-
ods.ai @artgor
Визуализация данных в DS
By Andrey Lukyanenko


