如何用R快速分析資料
天下雜誌記者林佳賢
什麼是資料新聞?
-
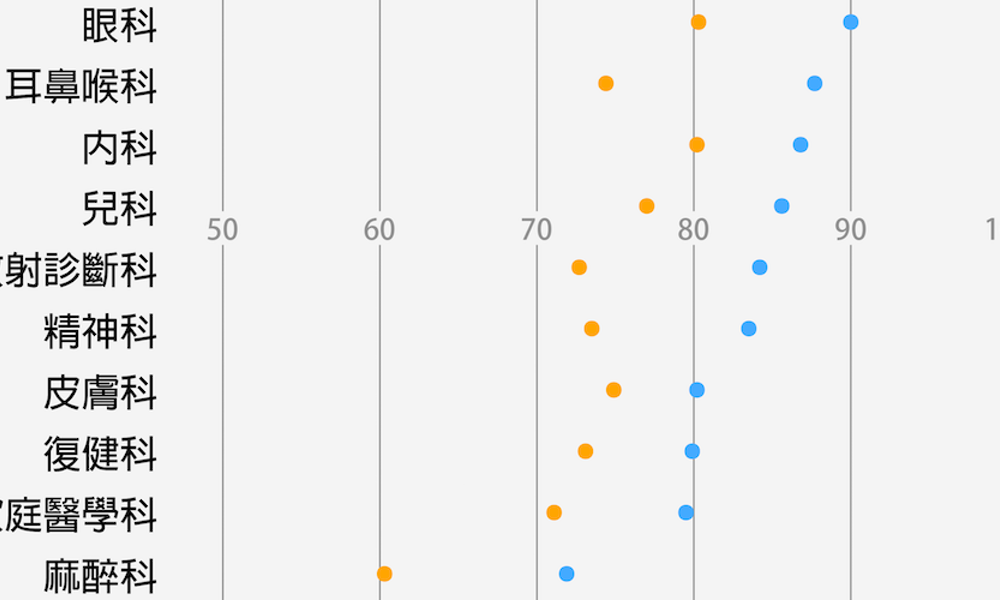
從資料找新聞:哪科醫師工作最「操」?
-
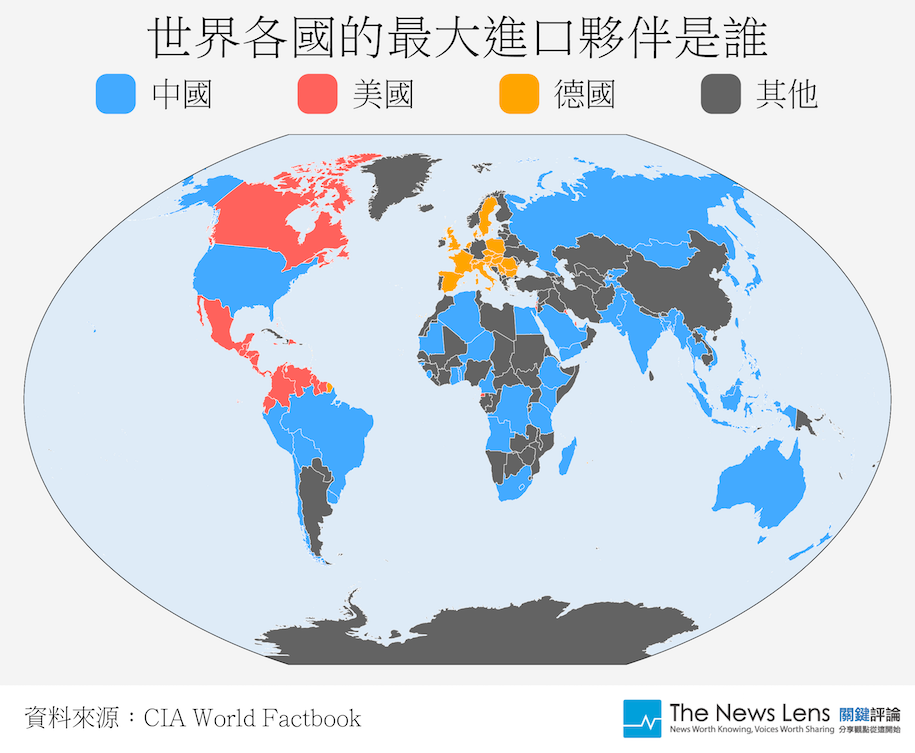
利用資料補充報導:世界貿易現況
-
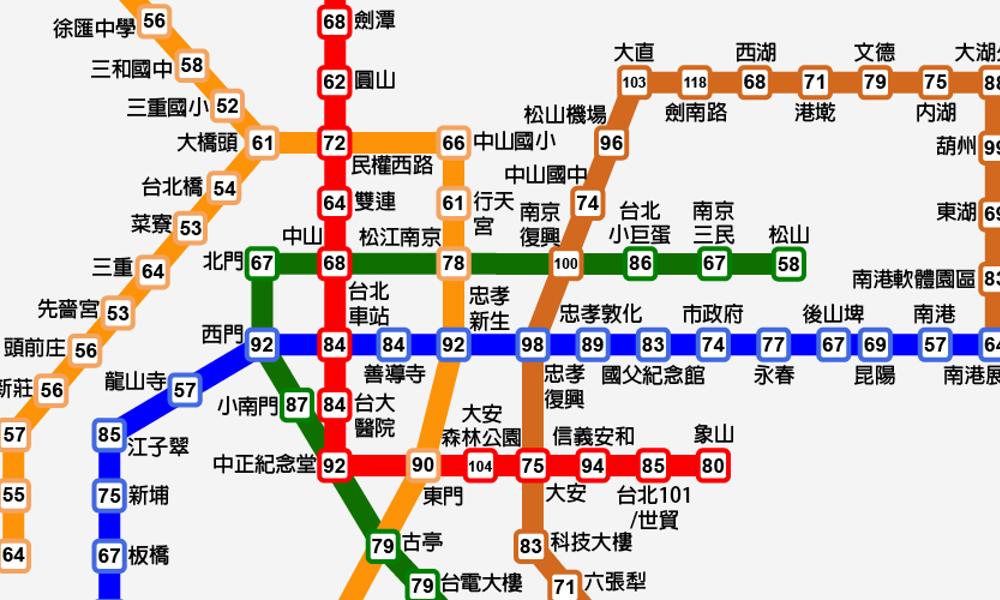
呈現讀者想知道的資料:台北所得差距
哪一科住院醫師工作最「操」?
哪些國家愛用中國和美國貨?
台北捷運所得地圖
知道資料新聞是什麼之後,接下來要了解工具
R語言
-
開源的統計程式語言
-
資料科學家的主要工具之一
-
有大量開發者貢獻的package
-
有RStudio等友善開發工具
R CRAN
RStudio
R如何幫助我完成資料新聞
-
搜集資料
-
清理資料
-
彙整資料
-
繪製圖表
實際操作展示R的功能
我想知道「台北市各行政區的套房租金價位」
先從搜集資料開始
用R從網路搜集資料
從網路搜集資料的行為,通稱「網路爬蟲」。
寫網路爬蟲通常用到的是Python,但R語言也有相應的package,可以完成不輸給Python的爬蟲任務。
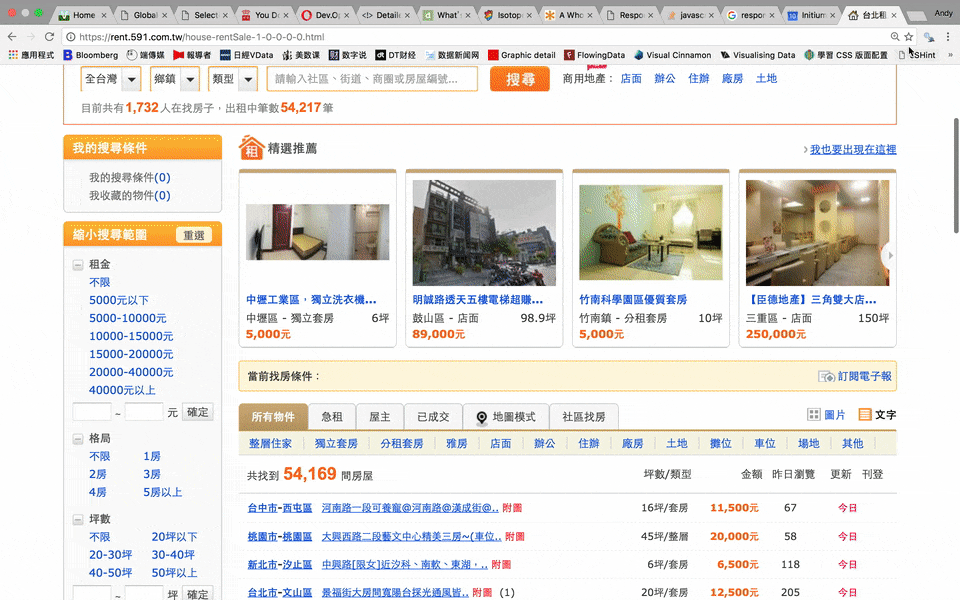
這是我們平常看到的網站
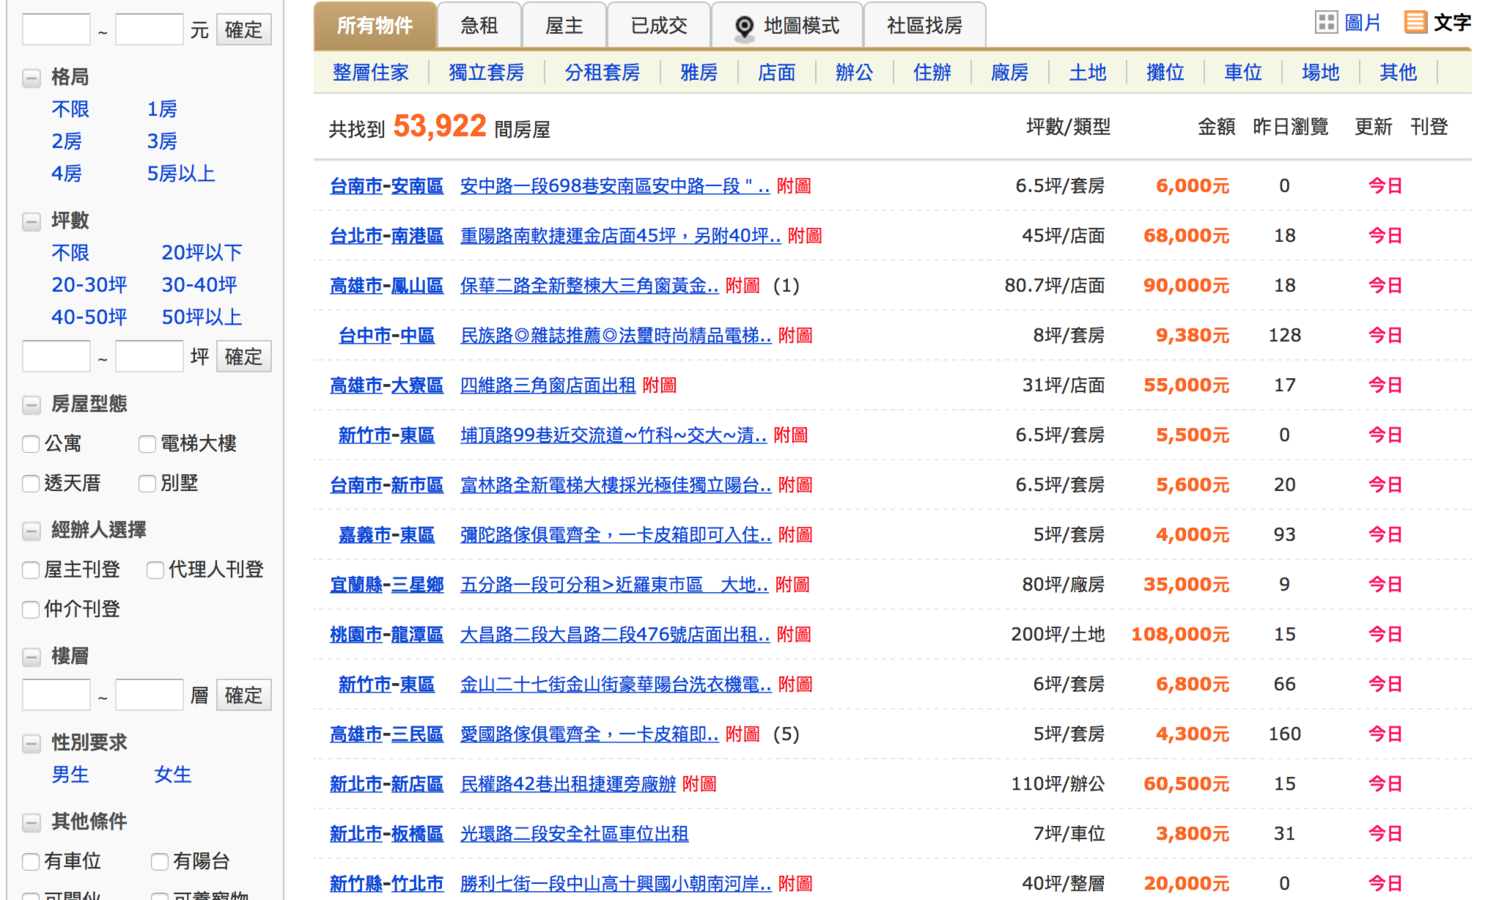
這是我們需要的資料
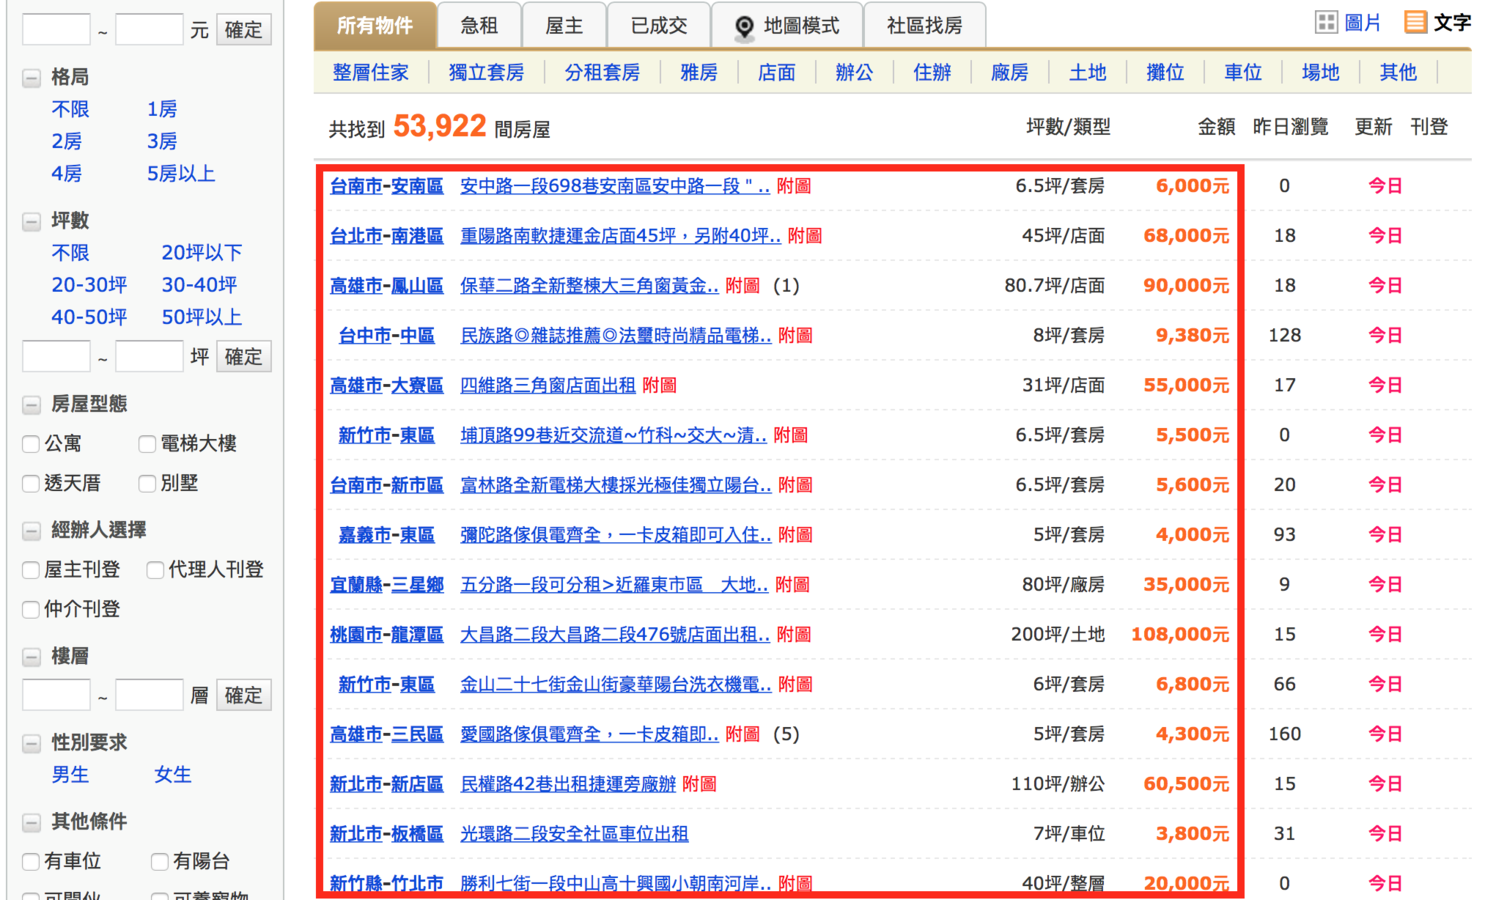
可是我們沒辦法跟電腦說:
「我們想要這一塊資料」
我們需要使用電腦看得懂的語言
網路爬蟲的基本流程
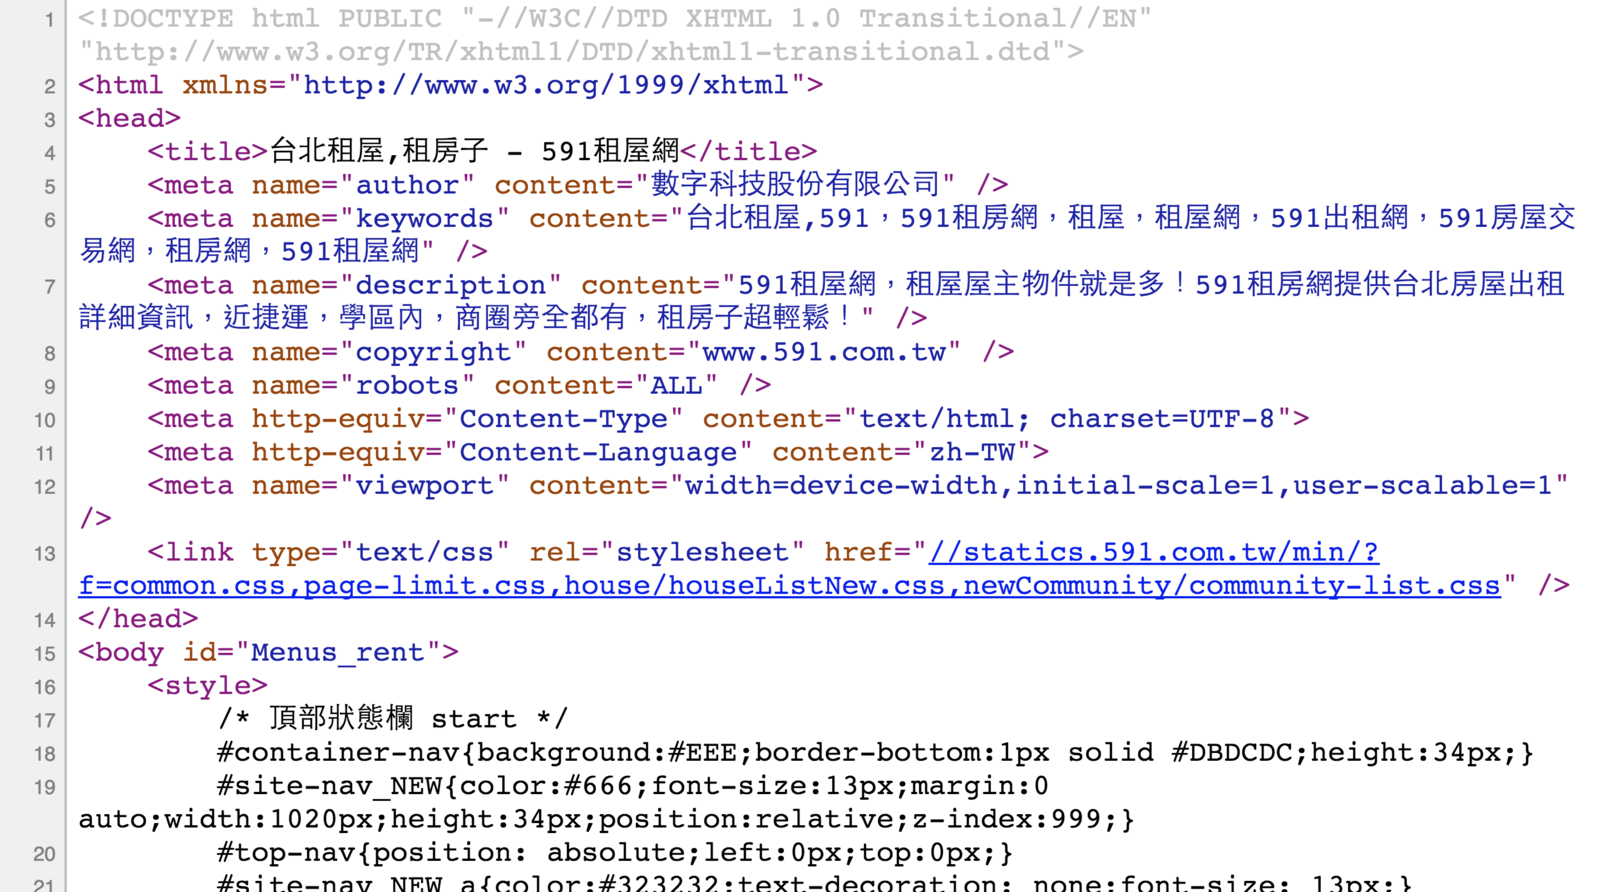
下載網頁原始碼
觀察想要的資料是什麼格式
用程式指令讀取原始碼
用CSS Selector或Xpath找到想要的資料
把抓到的資料彙整成一份檔案
R網路爬蟲會用到的package
- httr:下載原始碼
- jsonlite:處理json格式的資料
- rvest:讀取原始碼並找尋資料
httr
-
類似Python的requests
-
取得網頁原始碼的工具
-
常用的功能:GET、POST、content
# install httr package
install.packages("httr")
# load httr package
library(httr)
# 用GET功能把591租屋網搜尋台北市租屋的結果拿下來
doc <- GET("https://rent.591.com.tw/index.php?module=search&action=rslist&is_new_list=1&type=1&searchtype=1®ion=0&listview=txt&firstRow=40&totalRows=54040")
# 用content功能觀察剛剛拿下來的網頁內容
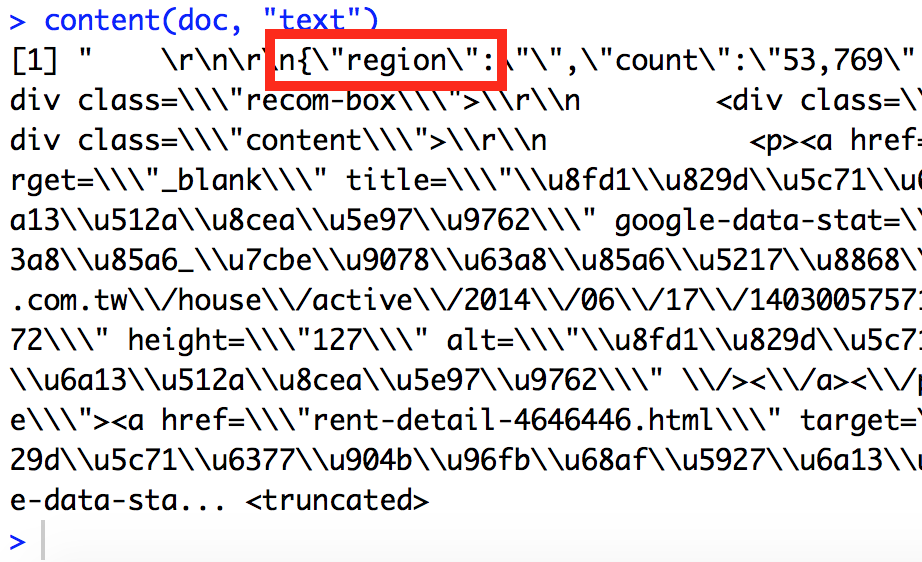
content(doc, "text")content(doc, "text")的內容
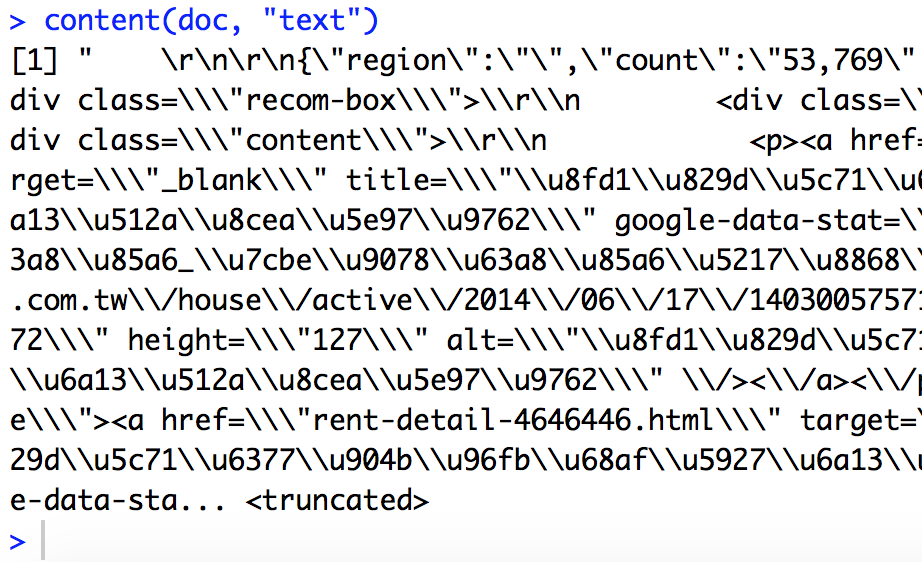
應該是json!
什麼是json
-
一種資料儲存格式
-
xls、csv、txt都是資料儲存格式
-
需要特別的處理方式
jsonlite
-
R用來處理json格式的好幫手
-
jsonlite的fromJSON功能,可以快速整理json格式的網頁內容,轉成R容易處理的格式。
# load httr package
library(httr)
library(jsonlite)
# 用GET功能把591租屋網搜尋台北市租屋的結果拿下來
doc <- GET("https://rent.591.com.tw/index.php?module=search&action=rslist&is_new_list=1&type=1&searchtype=1®ion=1&orderType=desc&listview=txt&firstRow=120&totalRows=12674")
# 用content功能觀察剛剛拿下來的網頁內容
content(doc, "text")
# 把剛剛拿下來的網頁內容,從json格式轉成R容易處理的格式
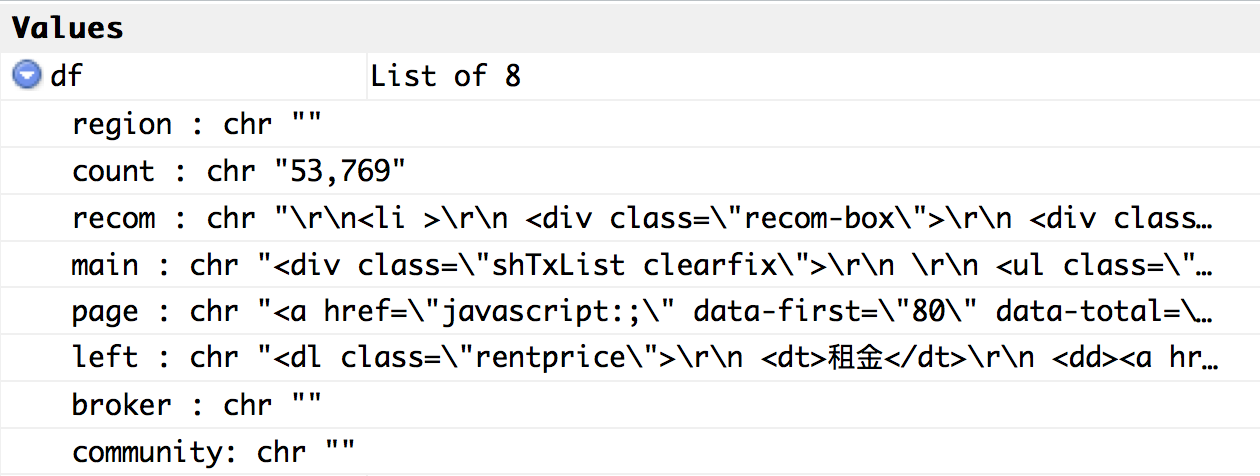
df <- fromJSON(content(doc, "text"))df長什麼樣子
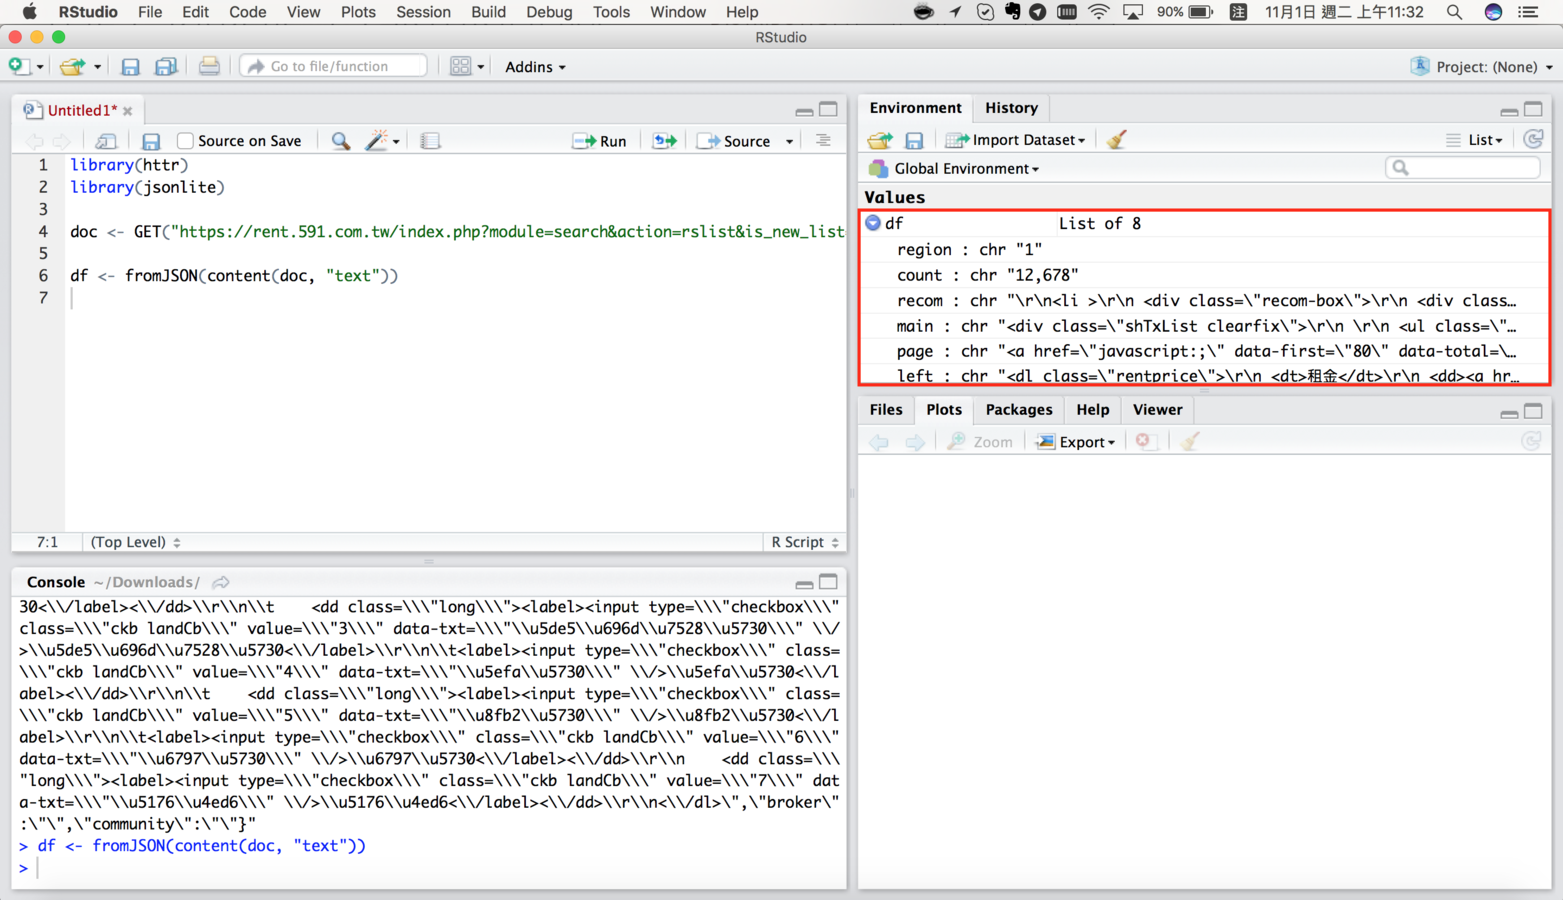
放大看一下df
看一下"main"的部分
# load httr package
library(httr)
library(jsonlite)
...
# 把剛剛拿下來的網頁內容,從json格式轉成R容易處理的格式
df <- fromJSON(content(doc, "text"))
# 我們還要從df這個list中,找到需要的那一部分
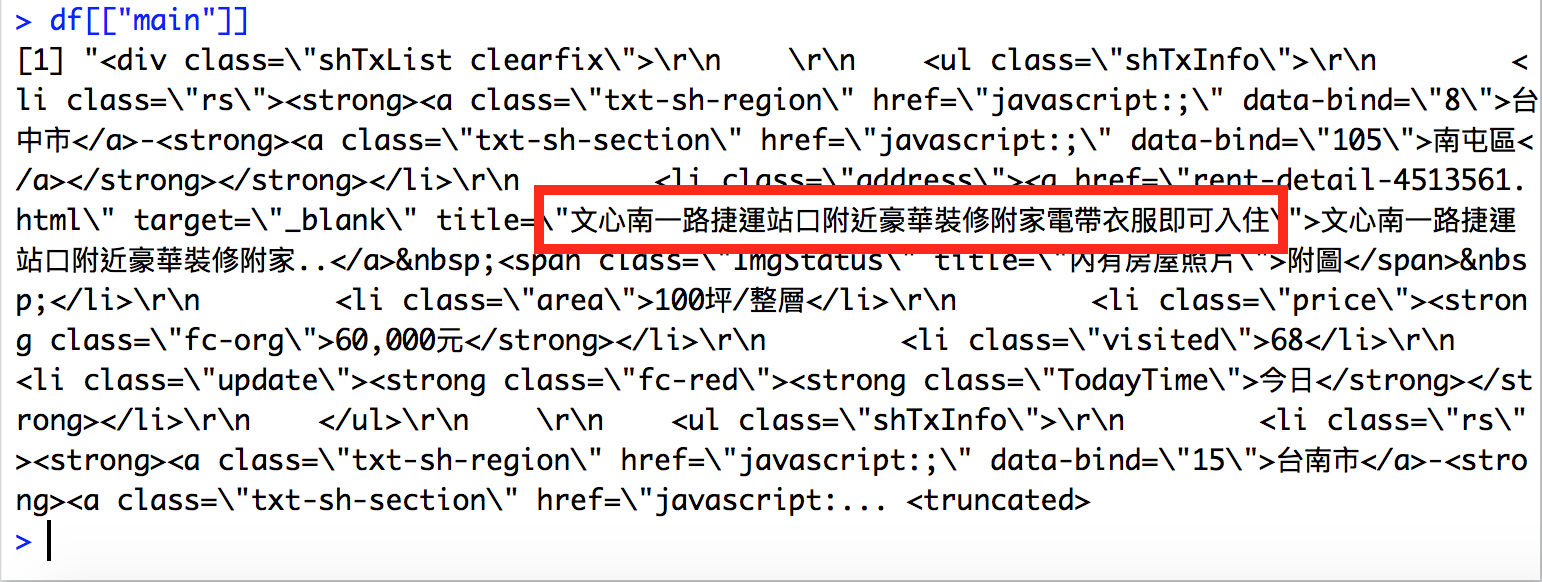
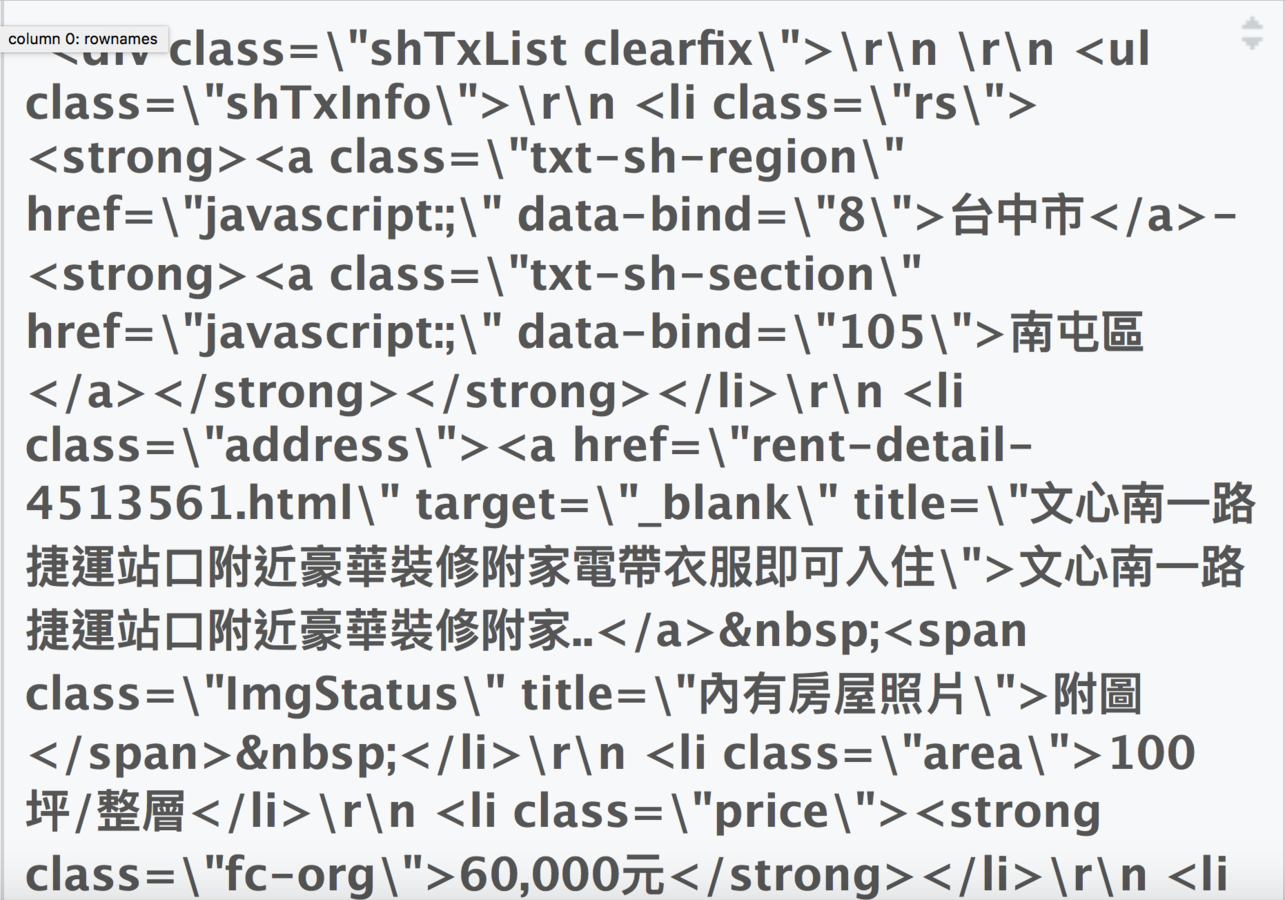
rent_data <- df[["main"]]
rent_data長這樣
鎖定我們要的資料區塊之後,
接下來讀取原始碼跟找尋資料
rvest
-
類似Python的Beautiful soup 4
-
從雜亂的網頁原始碼中找到需要的資訊
-
需要搭配CSS selector或Xpath使用
-
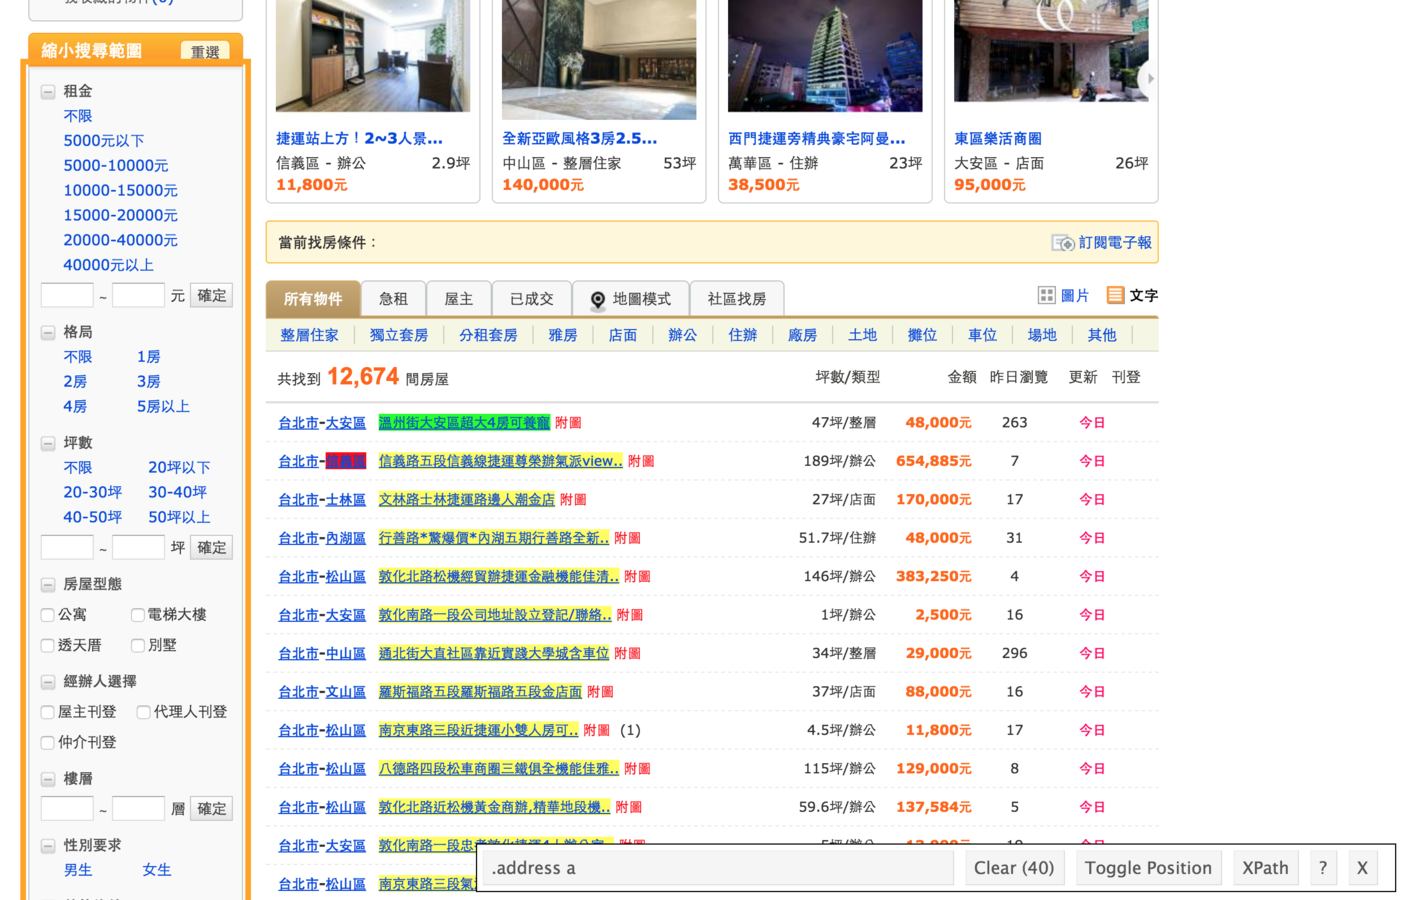
rvest作者推薦使用selector gadget
-
常用的功能:read_html、html_nodes、html_table
css selector和path
-
在雜亂的網頁原始碼裡找尋需要的資訊的方法
-
就像是地址
-
自己本身就是門學問
# load package
library(httr)
library(jsonlite)
library(rvest)
...
# 用rvest的read_html功能,讀取rent_data
rent_html <- read_html(rent_data)
# 用剛剛取得的css selector找尋節點
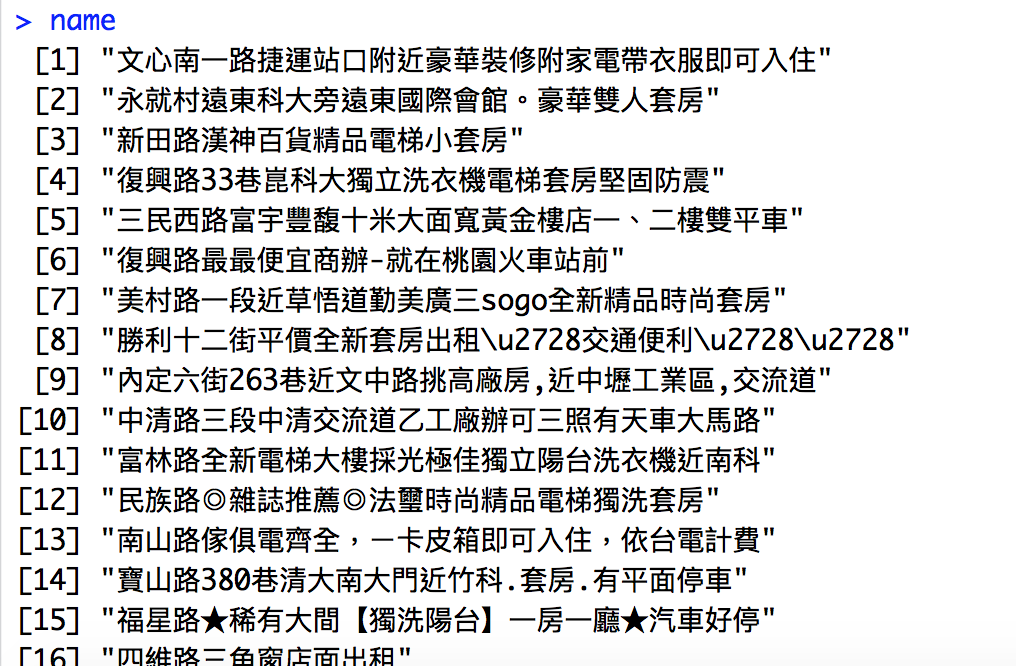
name <- html_nodes(rent_html, ".address a")
# 取出節點中需要的部分「title」
name <- html_attr(name, "title")name長什麼樣子
# load package
library(httr)
library(jsonlite)
library(rvest)
...
# 用一樣的步驟抓取縣市、行政區、租屋面積和租金
county <- html_nodes(rent_html, ".txt-sh-region")
county <- html_text(county)
town <- html_nodes(rent_html, ".txt-sh-section")
town <- html_text(town)
area <- html_nodes(rent_html, ".area")
area <- html_text(area)
price <- html_nodes(rent_html, ".price .fc-org")
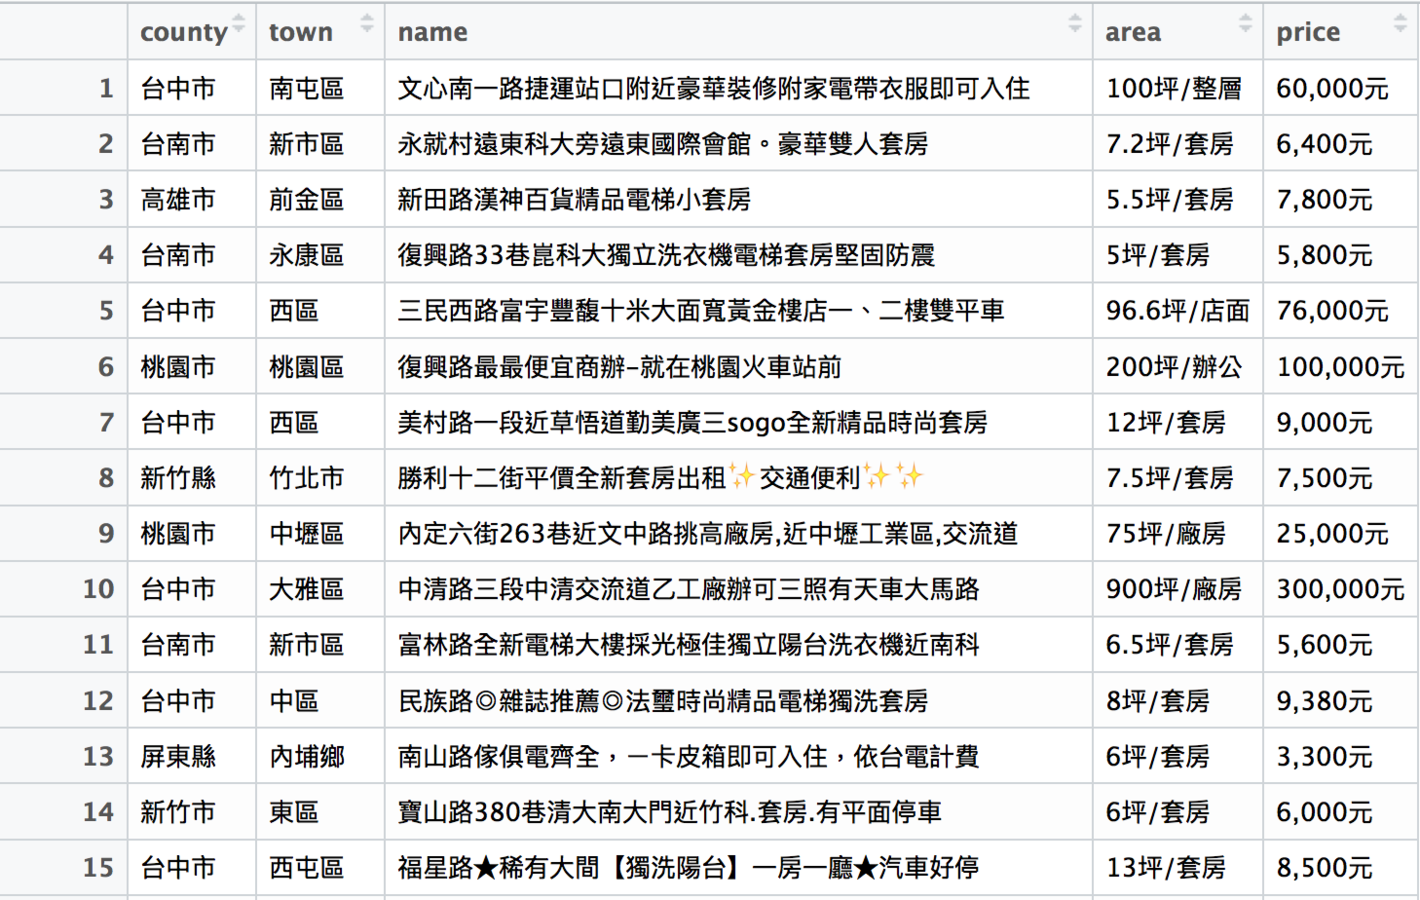
price <- html_text(price)# load package
library(httr)
library(jsonlite)
library(rvest)
...
# 最後把所有的資料存到一個檔案裡
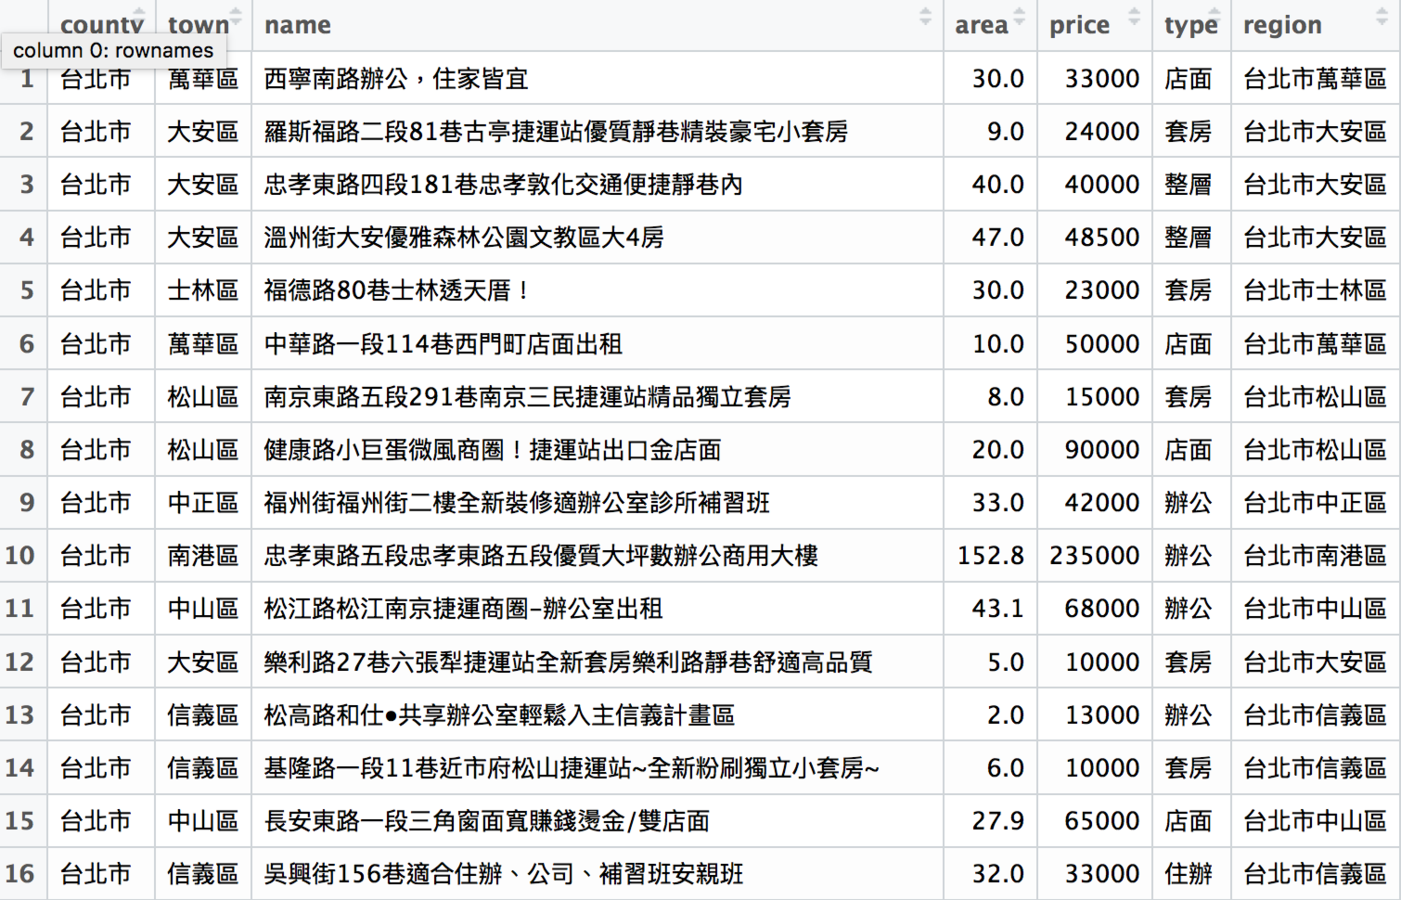
rent_df <- data.frame(
county = county,
town = town,
name = name,
area = area,
price = price
)rent_df長什麼樣子
可是這樣只抓了一頁的資料...
我們觀察一下一開始使用的網址
https://rent.591.com.tw/index.php?module=search&action=rslist&is_new_list=1&type=1&searchtype=1®ion=0&listview=txt&firstRow=0&totalRows=54040
# load package
library(httr)
library(jsonlite)
library(rvest)

...

# 只要改動firstRow的數字,就能爬取其他頁面的資料。
# 也就是只要一個迴圈,就可以把所有租屋資訊抓下來。
doc2 <- GET("https://rent.591.com.tw/index.php?module=search&action=rslist&is_new_list=1&type=1&searchtype=1®ion=0&listview=txt&firstRow=40&totalRows=54040")
接下來是清理資料
爬取下來的資料幾乎不可能是乾淨的資料
-
時間格式通常不是電腦看得懂的格式,尤其在台灣更嚴重(105年 vs 2016)
-
想要的資料可能和其他資料混在一起(兩欄混成一欄)
-
金額欄裡有中文、逗點等電腦無法辨識為數字的雜訊
R用來清理資料的package:stringr
-
補充R原本用來處理文字的功能不足之處
-
能做到文字搜尋、取代、連接、切割等功能。
-
常用的功能:str_c、str_split、str_replace
rent_df原本的樣子
在分析資料前,需要處理的工作
-
把價格欄位清到剩下數字,再轉成數字格式
-
把area欄位中不屬於面積的資訊,獨立成type欄位
-
新成立一個欄位:unit_price(每坪租金)
# load package
library(httr)
library(jsonlite)
library(rvest)
library(stringr)
...
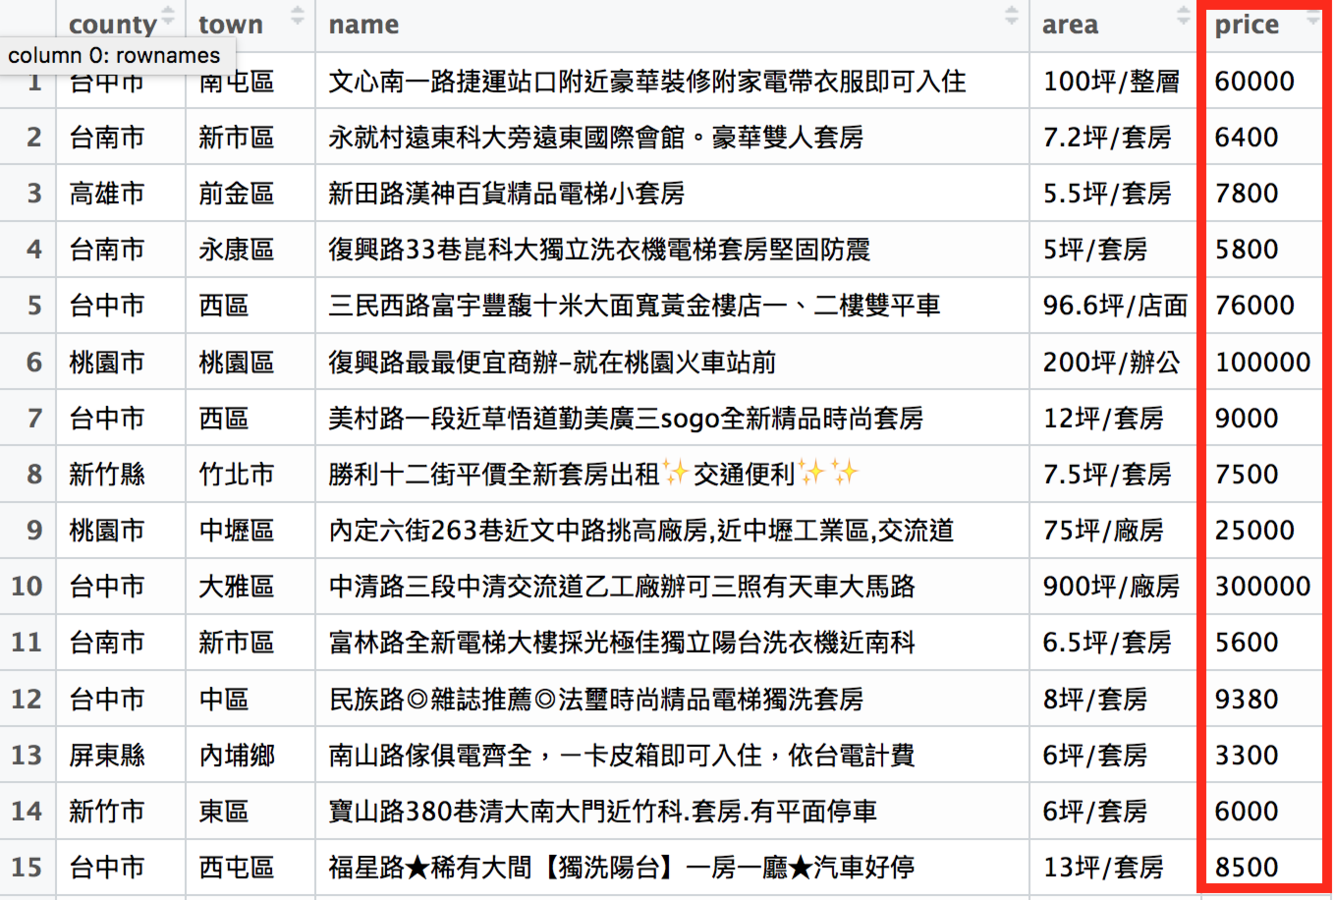
# 清理價格資訊,把逗點跟「元」清掉
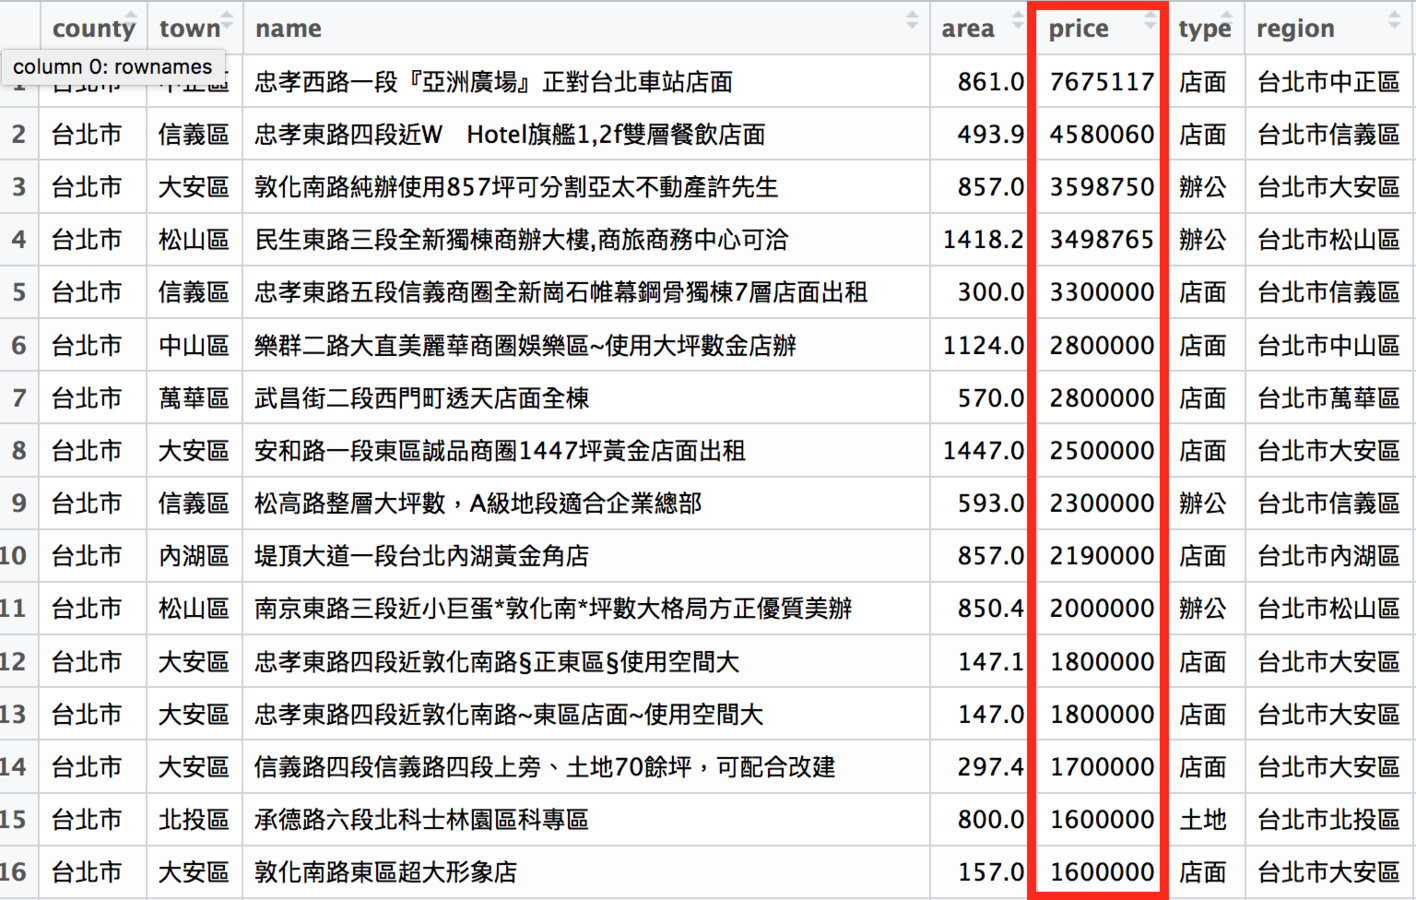
rent_df$price <- str_replace_all(rent_df$price, ",|元", "")
# 再把price欄從「文字」轉成「數字」
rent_df$price <- as.numeric(rent_df$price)清理過的price欄乾淨多了
# load package
library(httr)
library(jsonlite)
library(rvest)
library(stringr)
...
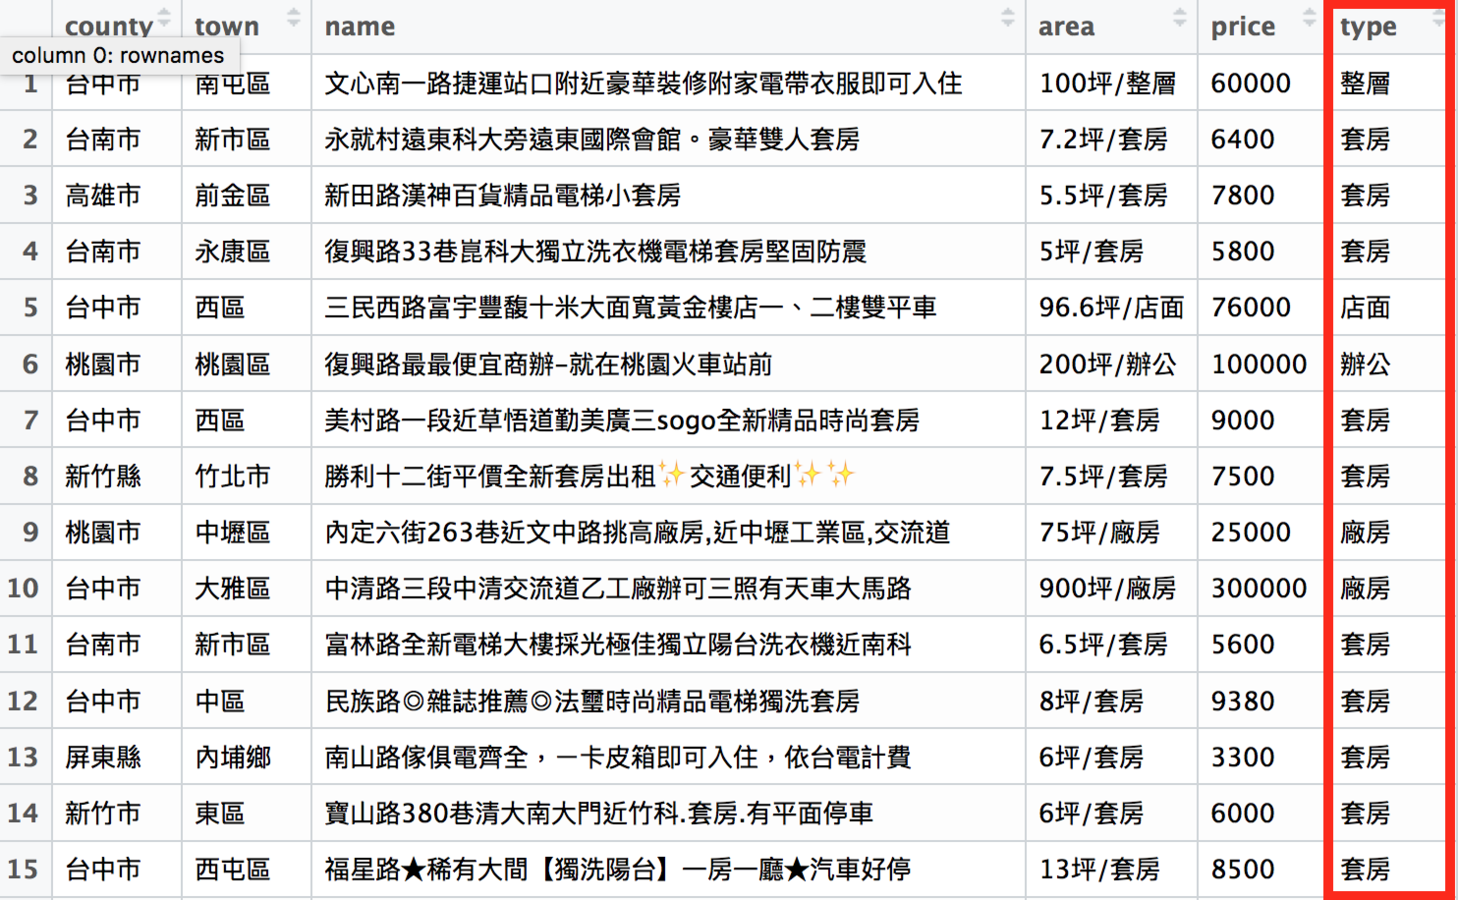
# 新成立type一欄,這一欄的資訊來自area欄
# 我們用「/」切割type欄
# 再取出後面的部分作為type欄的資訊
rent_df$type <-
sapply(str_split(rent_df$area, "/"), "[[", 2)新成立的type欄位
# load package
library(httr)
library(jsonlite)
library(rvest)
library(stringr)
...

# 新的area欄的資訊還ㄕ來自原本的area欄
# 我們用「/」切割type欄
# 取出前面的部分作為type欄的資訊
rent_df$area <- sapply(str_split(rent_df$area, "/"), "[[", 1)

# 接著把「坪」清掉
rent_df$area <- str_replace_all(rent_df$area, "坪", "")

# 再轉成數字格式
rent_df$area <- as.numeric(rent_df$area)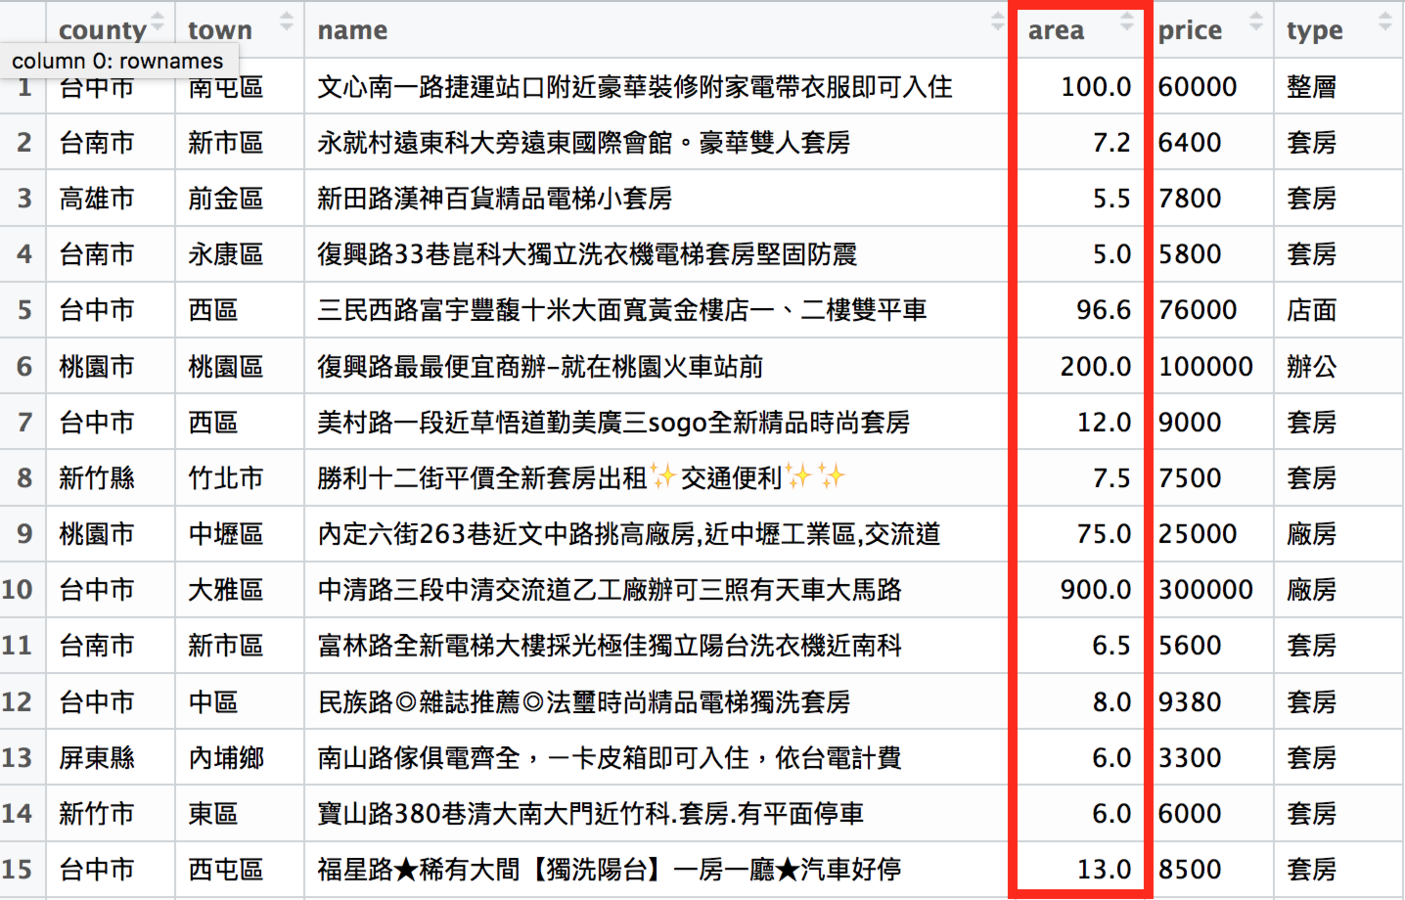
新的area欄乾淨多了
# load package
library(httr)
library(jsonlite)
library(rvest)
library(stringr)
...
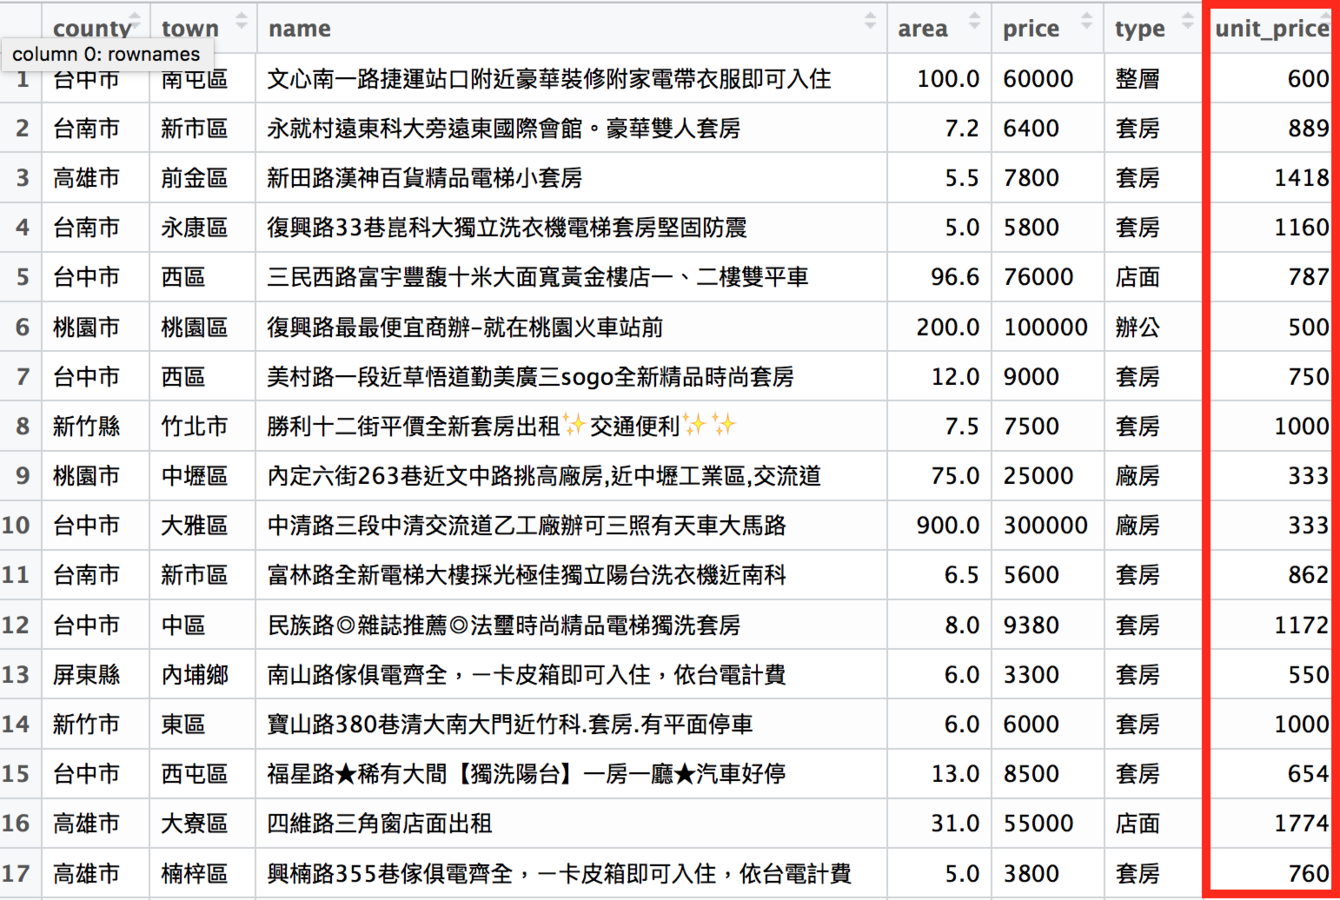
# 新成立unit_price一欄
# 這一欄的資料是price欄除以area欄
rent_df$unit_price <- rent_df$price / rent_df$area
# 再四捨五入到整數位的結果
rent_df$unit_price <- round(rent_df$unit_price)新的每坪租金欄位
最終成果
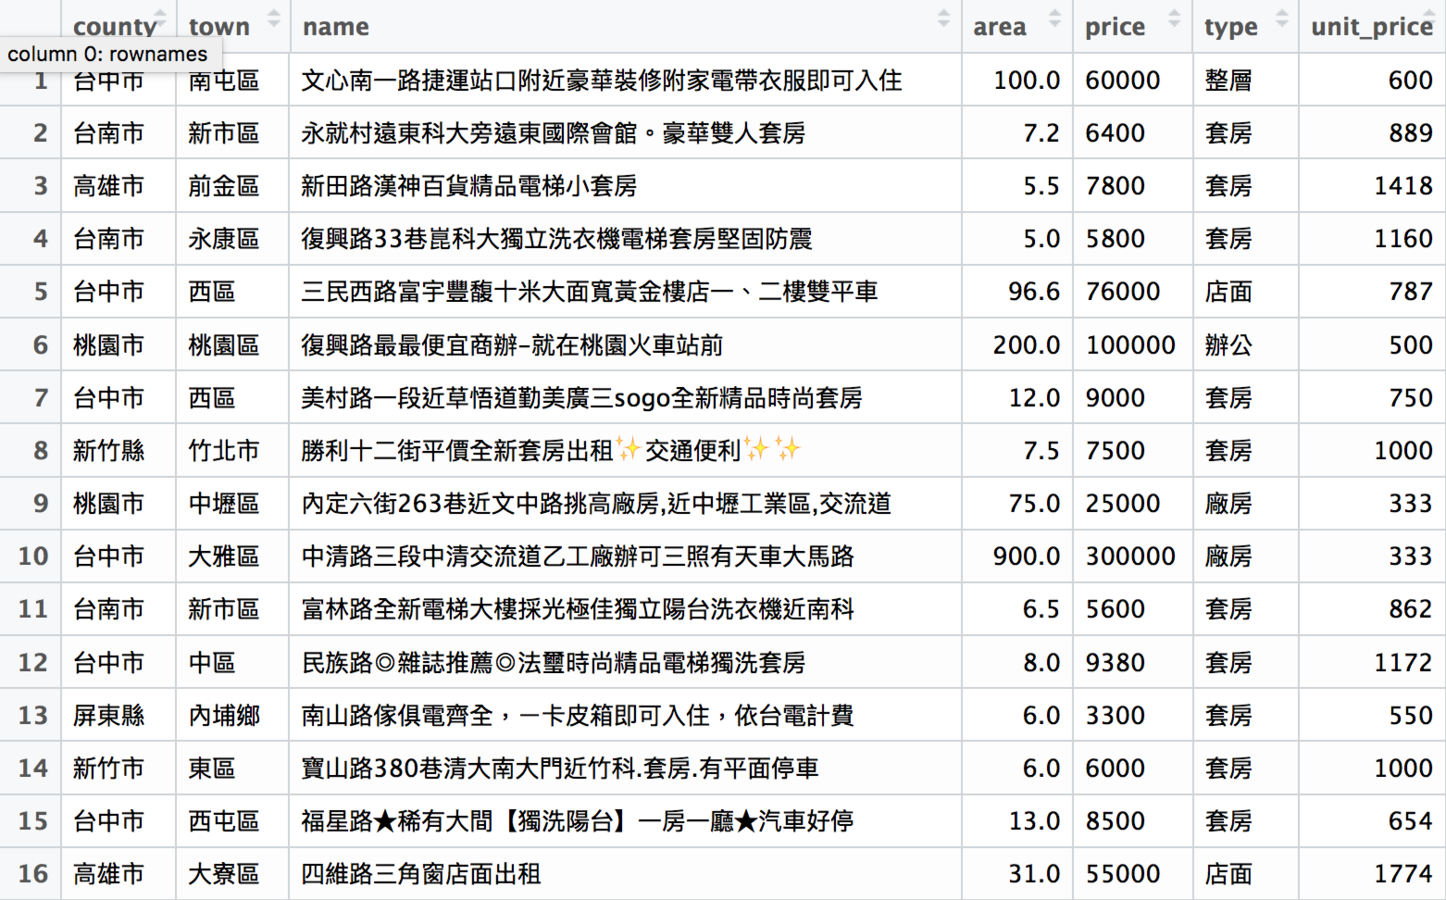
完成資料清理後,
就可以進入資料分析了
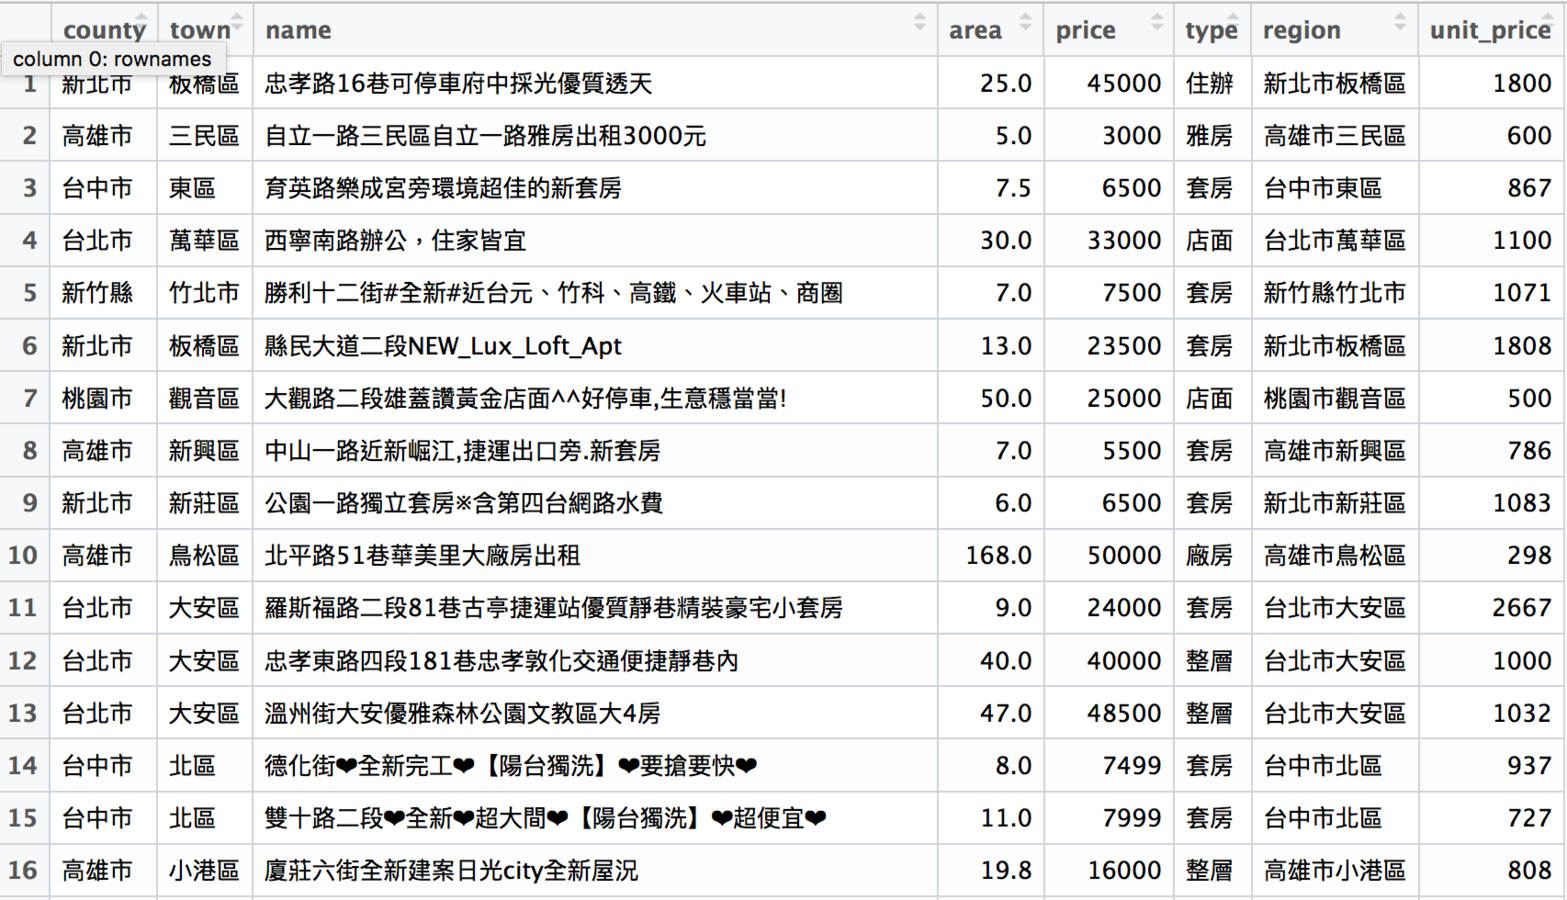
這裡用之前抓的591租屋網全台灣租屋資料為例
rent591
分析資料會用到的package:dplyr
-
相當於Excel和Google spreadsheet的樞紐分析功能
-
透過資料分組把資料進行各種彙整
-
常用的功能:filter、group_by、summarise、arrange
dplyr::filter
用價格、地區等資訊篩選資料
# load package
library(httr)
library(jsonlite)
library(rvest)
library(stringr)
library(dplyr)
...
# 把rent591裡面台北市的資料拿出來
rent591_tp <- filter(rent591, county == "台北市")

# 把rent591裡面租金大於1萬元的資料拿出來
rent591_expensive <- filter(rent591, price > 10000)

# 把rent591裡面的套房資料拿出來
rent591_tao <- filter(rent591, type == "套房")
rent591_tp
dplyr::arrange
用價格、地區等資訊排序資料
# load package
library(httr)
library(jsonlite)
library(rvest)
library(stringr)
library(dplyr)
...
# 把rent591_tp的資料以租金由高到低排列
rent591_tp <- arrange(rent591_tp, desc(price))

# 把rent591_tao的資料以每坪租金由低到高排列
rent591_tao <- arrange(rent591_tao, unit_price)

# 把rent591_tao_ya根據縣市名稱做排序
rent591_tao <- arrange(rent591_tao, county)
排序後的rent591_tp
dplyr::group_by
用價格、地區等資訊分類資料
dplyr::summarise
用分類結果彙整資料
# load package
library(httr)
library(jsonlite)
library(rvest)
library(stringr)
library(dplyr)
...
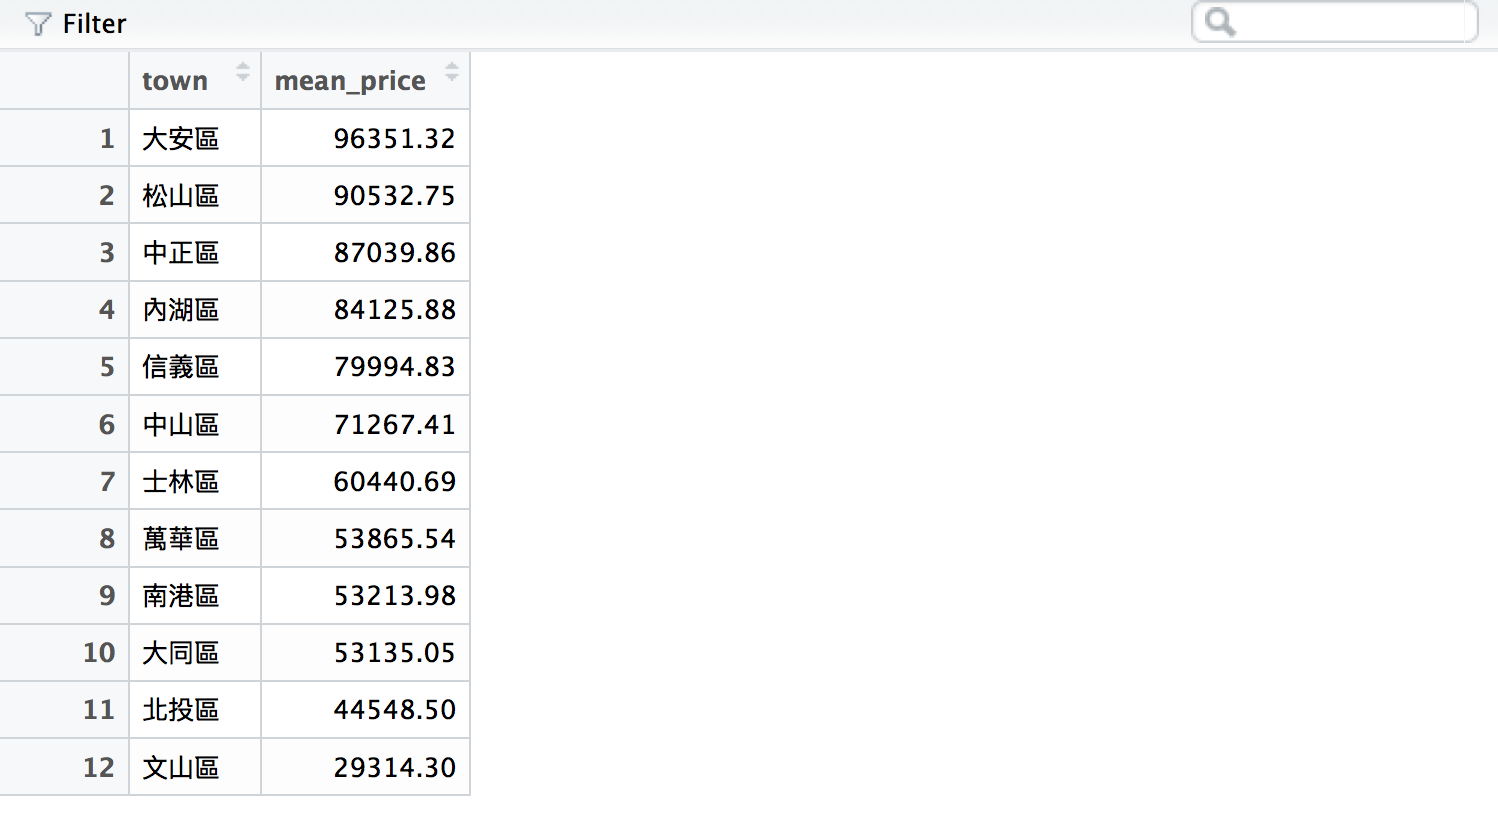
# 計算台北市各行政區的平均租金
# 先把rent591_tp根據行政區分類
rent591_tp_group <- group_by(rent591_tp, town)
# 再根據分類結果計算各行政區的平均租金
rent591_tp_price <- summarise(rent591_tp_group,
mean_price = mean(price))
# 最後把計算結果排序
rent591_tp_price <- arrange(rent591_tp_price,
desc(mean_price))
rent591_tp_price的結果
# load package
library(httr)
library(jsonlite)
library(rvest)
library(stringr)
library(dplyr)
...
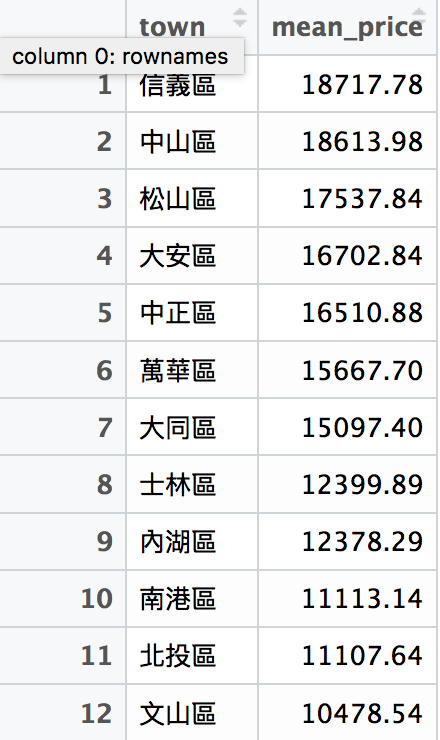
# 計算台北市各行政區的套房平均租金
# 先篩選出rent591_tp的套房資料
rent591_tp <- filter(rent591_tp, type == "套房")
# 先把rent591_tp根據行政區分類
rent591_tp_group <- group_by(rent591_tp, town)
# 再根據分類結果計算各行政區的平均租金
rent591_tp_price <- summarise(rent591_tp_group, mean_price = mean(price))
# 最後把計算結果排序
rent591_tp_price <- arrange(rent591_tp_area,
desc(mean_price))rent591_tp_price的結果
有了分析結果之後,
就可以來畫圖了
R的資料視覺化package:ggplot2
-
支援各種圖表類型
-
設計邏輯基於「grammar of graphics」
-
支援svg、pdf等向量輸出格式
基本的繪圖:長條圖
geom_bar
# load package
library(httr)
library(jsonlite)
library(rvest)
library(stringr)
library(dplyr)
library(ggplot2)
...
# 把台北市各行政區的平均租金繪製成長條圖
# 設定畫布跟基本資訊:
# 使用的資料:rent591_tp_price、x軸:town、y軸:mean_price
ggplot(rent591_tp_price, aes(town, mean_price)) +
# 選擇要畫的圖表類型,這裡選擇geom_bar(長條圖)
# stat = "identity"指的是用原本的數字作為長條高度
  geom_bar(stat = "identity") +
# 由於R不支援中文,因此要設定字體,這裡設定STHeiti(黑體)
  theme(text = element_text(family = "STHeiti"))
產生的圖表
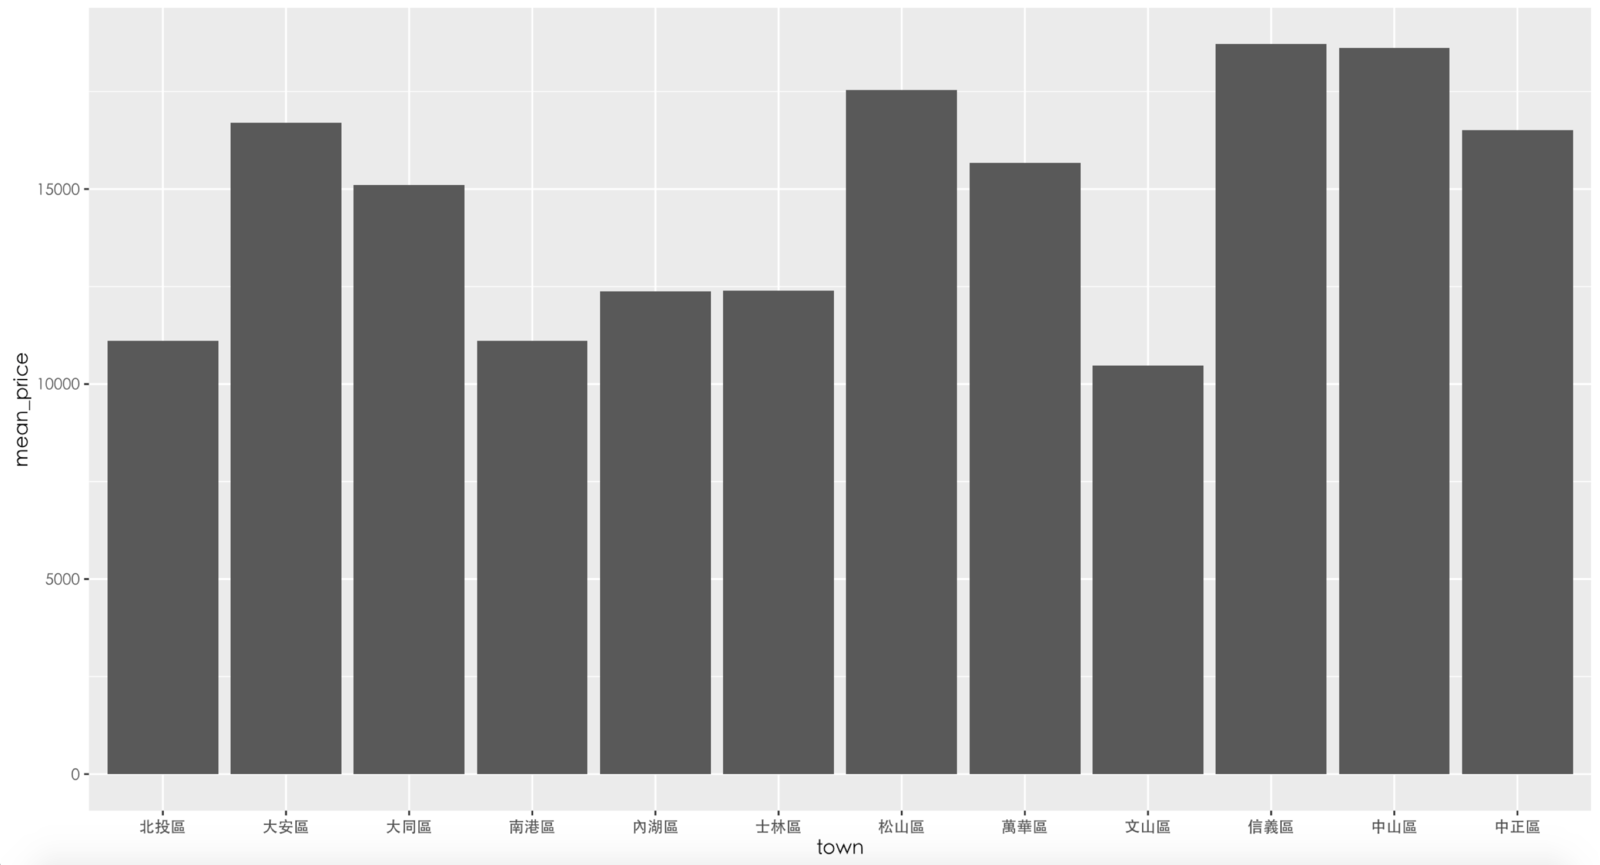
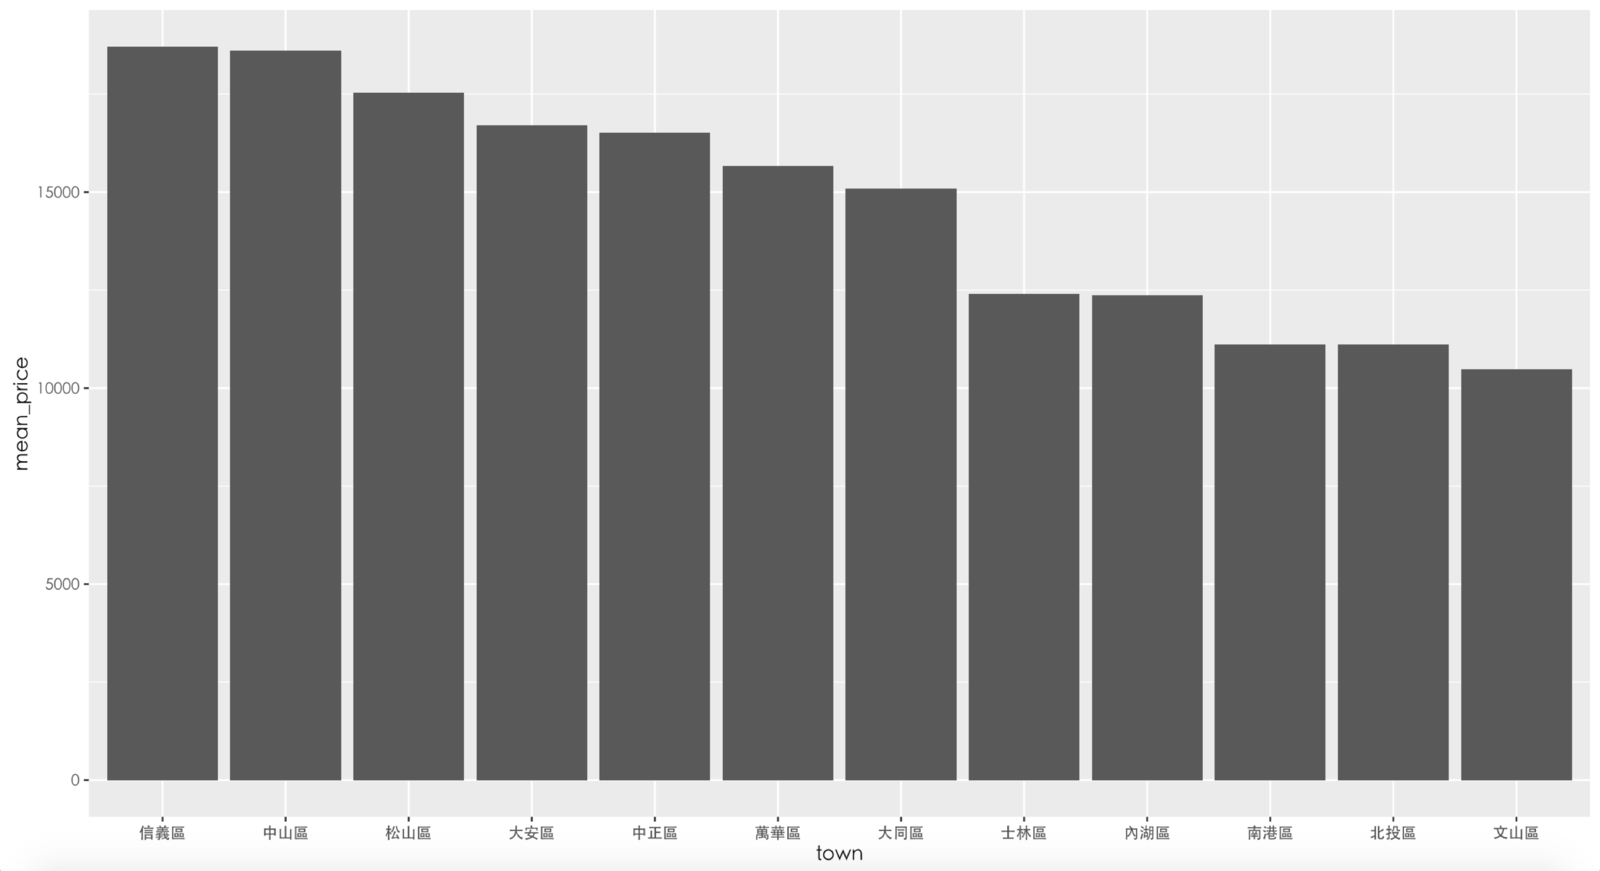
由於長條圖沒有自己排序,我們需要自己把行政區排序
# load package
library(httr)
library(jsonlite)
library(rvest)
library(stringr)
library(dplyr)
library(ggplot2)

...

# 把台北市行政區轉成可排序的factor格式,再根據自己定義的順序排序factor

rent591_tp_price$town <- factor(rent591_tp_price$town,
                                c("信義區","中山區","松山區",
                                  "大安區","中正區","萬華區",
                                  "大同區","士林區","內湖區",
                                  "南港區","北投區","文山區"))
# 再畫一次圖
ggplot(rent591_tp_price, aes(town, mean_price)) +
  geom_bar(stat = "identity") +
  theme(text = element_text(family = "STHeiti"))
排序後的結果
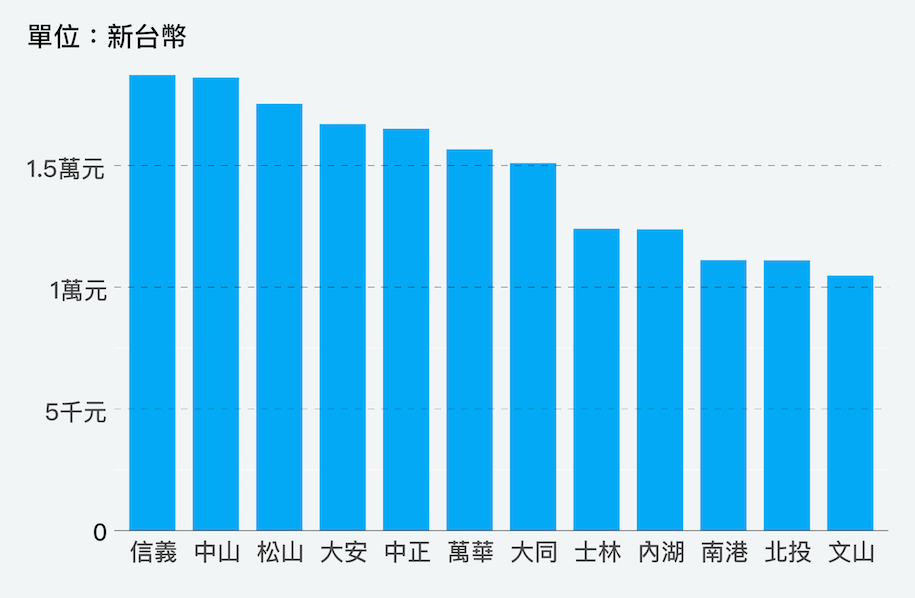
輸出成向量格式後,再用繪圖軟體進行後製,就是精美的資料作品了
用Adobe Illutstrator美化後
我們做了哪些事
-
從591租屋網爬取全台灣的租屋資料
-
將爬取下來的資料清理到方便分析的狀態
-
用篩選、排序、分組、彙整等功能分析資料
-
將分析結果畫成圖表
-
用Adobe Illustrator美化圖表
想了解更多資料分析?
-
Data Man 的資料視覺化筆記
-
電子郵件:imandylin2@gmail.com
-
端傳媒
Q & A
數感X數據:如何製作一篇資料新聞
By Andy Lin


