O2 and OH airglow in the mesosphere through the lens of Odin/OSIRIS Infrared Imager
Anqi Li
Doctoral dissertation
May 18th, 2022

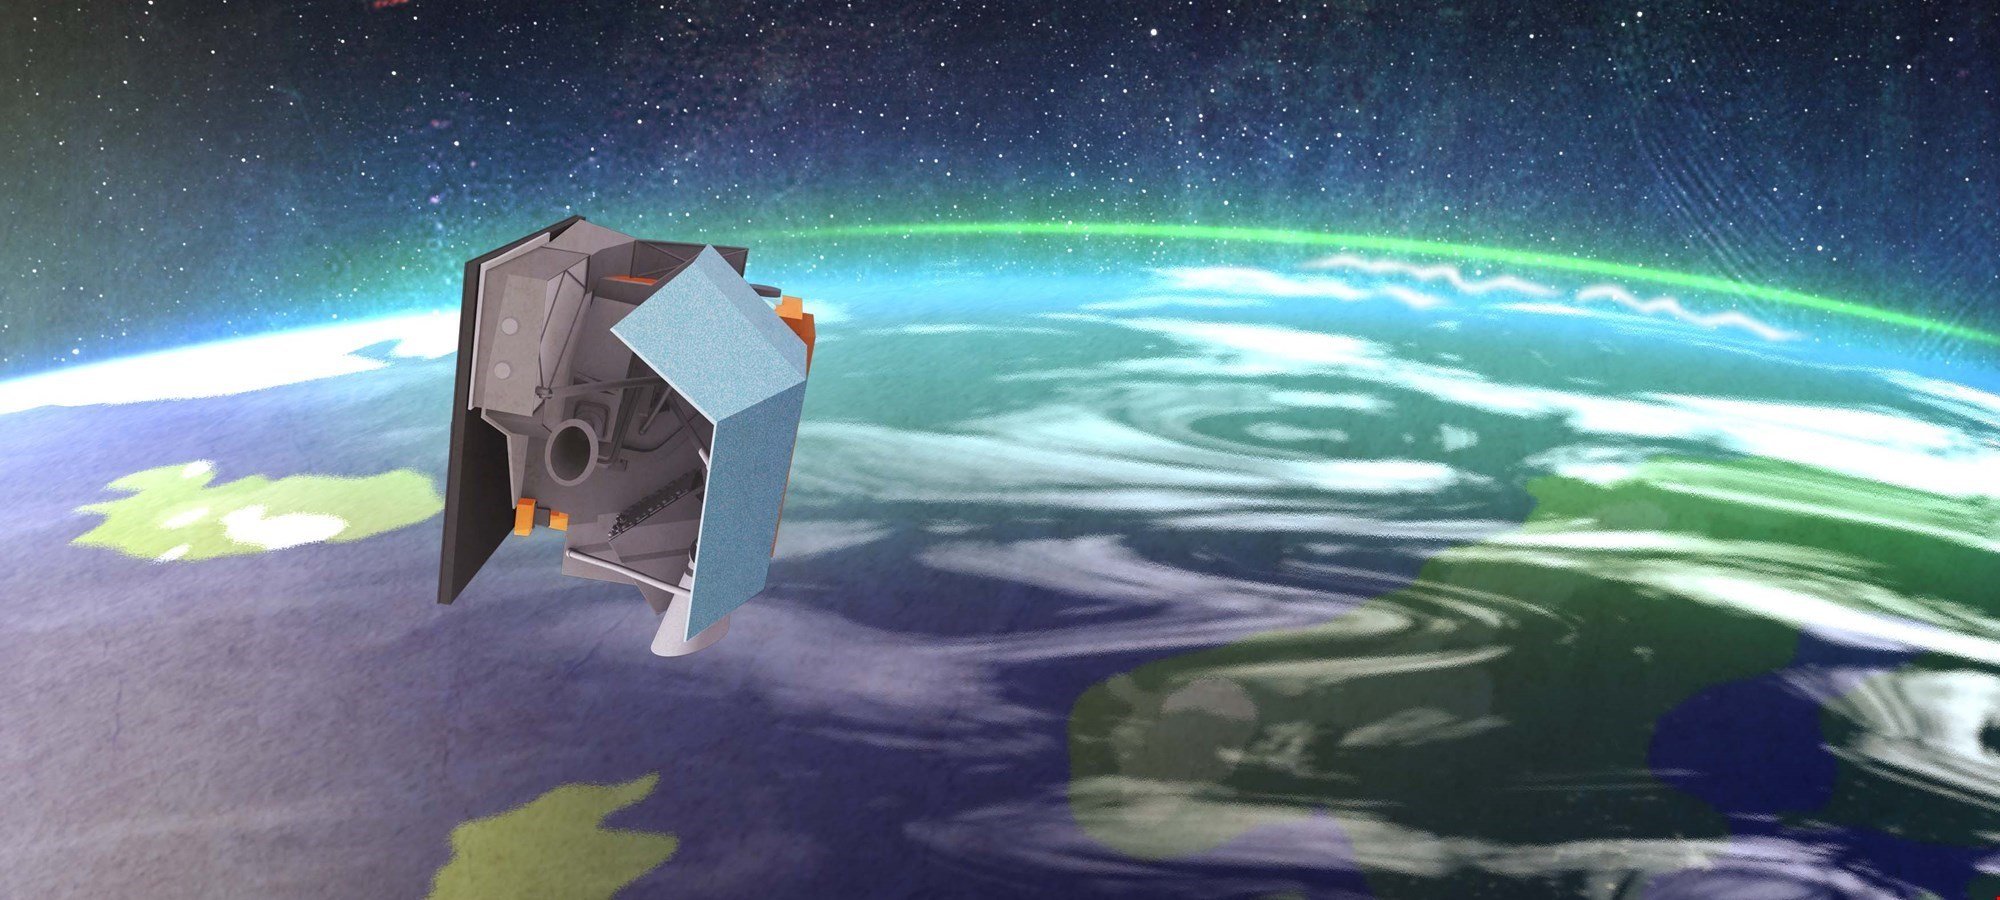
Image from NASA
Odin
- SubMillimetre Radiometer (SMR)
- Optical Spectrograph and InfraRed Imaging System (OSIRIS)
MATS
- Ultraviolet Imagers (2D)
- InfraRed Imagers (2D)

Airglow

\mathrm{OH}*
\mathrm{O}_2(^1\Delta)
\mathrm{O}_2(^1\Sigma)
1.27 μm
1.53 μm
762 nm
Image from NASA
Odin-IRI-O2 channel
1 Orbit
N pole
S pole
EQ
EQ
\mathrm{O}(^1D)
\mathrm{O}_2(^1\Delta)
\mathrm{O}_2
\mathrm{O}
\mathrm{O}_2(^1\Sigma)
MATS
(A-band)
Odin/OSIRIS
(IRA-band)
\mathrm{O}_3
\mathrm{O}
\mathrm{O}_2
\mathrm{OH}*
\mathrm{H}
\mathrm{O}_3
vibrationally excited states
\mathrm{O}_2
Paper 1

Paper 1
Step 1:

Limb radiance Volume emission rate (VER)
\mathrm{O}_2(^1\Delta)

VER

Step 2:
Paper 1

\mathrm{O}_3
With special consideration for the long lifetime of
!
\mathrm{O}_2(^1\Delta)
Assume equilibrium
\mathrm{O}_2(^1\Delta)
Close to sunrise at the equator and in the equinoxes
Odin near-terminator orbit
(Mr. Sloth in Zootopia)
!
Step 2:
Paper 1
\mathrm{O}_2(^1\Delta)
Not equilibrium
\mathrm{O}_3
\mathrm{O}_3
\mathrm{O}_2(^1\Delta)
Step 3: compare ozone
Paper 1
N pole
S pole
EQ
EQ


Summary
Paper 1
-
The quality of the retrieval scheme
-
Address the longlife time issue
-
Consistent with SMR, OS and MIPAS
-
Leading to a long term (15 yrs), high-resolution data set of daytime and
\mathrm{O}_2(^1\Delta)
\mathrm{O}_3
Paper 2

Step 1:
Limb radiance -> Volume emission rate (VER)
Paper 2
\mathrm{OH}*
Step 2:

Gaussian parameters:
-
Peak VER
-
Thickness
-
Emission height
Peak VER
Height

Peak VER
Height
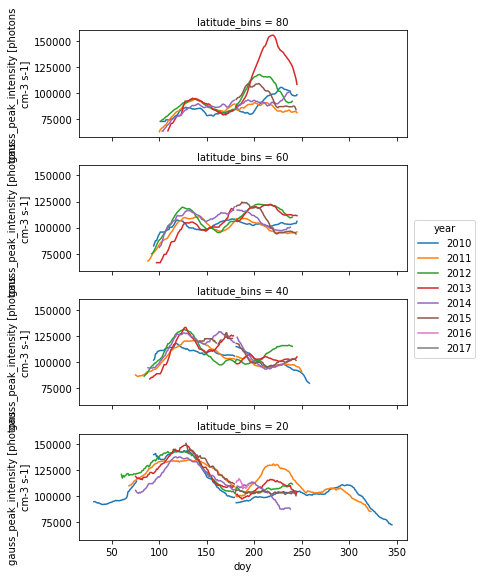
Paper 2
Note: NH is shifted by 6 months!
Summary
Paper 2
-
Retrieved nighttime
-
Characterised the airglow layer by fitting a Gaussian profile
-
Depicts the well known seasonal variations
-
Leading to a long-term (15 yrs), high-resolution data set
\mathrm{OH}*
publicly available!

Paper 3

\mathrm{O}
\mathrm{O}_2
\mathrm{OH}*
\mathrm{H}
\mathrm{O}_3
vibrationally excited states
\mathrm{O}_2
Paper 3

11-year Solar Cycle
Seasonal var. removed
\mathrm{OH}*
OH*
Ly-a
Paper 3
Peak VER / cm-3 s-1
Year
Year
Seasonal var. removed

\mathrm{OH}*
Observed
Paper 3
Ly-a anomaly / %
ZER anomaly / %
ZER anomaly / %

Modelled
Seasonal var. removed
Paper 3
\mathrm{OH}*
ZER anomaly / %
Ly-a anomaly / %
ZER anomaly / %
Summary
Paper 3
-
IRI confirms that OH* layer displays the expected signature correlated to the solar cycle
-
.... but not near the equator
-
Simulated the diurnal variation and re-sampled the modelled data
-
The observed distortion near the equator is caused by the change in Odin local time sampling
Paper 4

(SSW-ES)
Paper 4
SSW - ES

Monthly zonal mean
\mathrm{OH}*
Paper 4
SSW - ES


Daily zonal mean
\mathrm{OH}*
Paper 4

SMR
IRI
IRI
Proxy
Proxy
SSW - ES
\mathrm{OH}*
\mathrm{O}_2(^1\Delta)
\mathrm{OH}*
\mathrm{O}
Nighttime!
[OH*] = pT^{-3.4} [O]
Summary
Paper 4
-
IRI has captured multiple episodic signals during the SSW-ES events
-
Incorporated H2O and T from SMR to aid our qualitative assessment
-
Calculated proxies O and OH*, which resembles well the observed data
-
The vertical transport of O is the key
Conclusion
of this thesis
-
Analysed the airglow observations made by Odin/OSIRIS infrared imager
-
Includes preparing the complete data set (>15 yrs!)
-
Contributed to a better understanding of the chemical and dynamical processes controlling the mesosphere
-
Preparation for the MATS mission
MATS - IR channel
Simulation
\mathrm{O}_2(^1\Sigma)
Counts
Supplemental slides

MSIS Temperature

Photochemical model
\mathrm{O}_2(^1\Delta)
\mathrm{O}_2(^1\Sigma)

MATS
Odin-IRI


OH nightglow


OH* peak VER SH

OH* peak VER NH
Note: NH is shifted by 6 months!
OH* peak height NH
Note: NH is shifted by 6 months!


PhD Dissertation
By ankiki


