VISUALISING
GEOGRAPHIC
DATA
FOR THE WEB
Anna Powell-Smith
HELLO!
I'm a web developer
By day:
freelance for clients
By night:
make maps, hack on fun stuff
HOW I GOT INTO MAPS
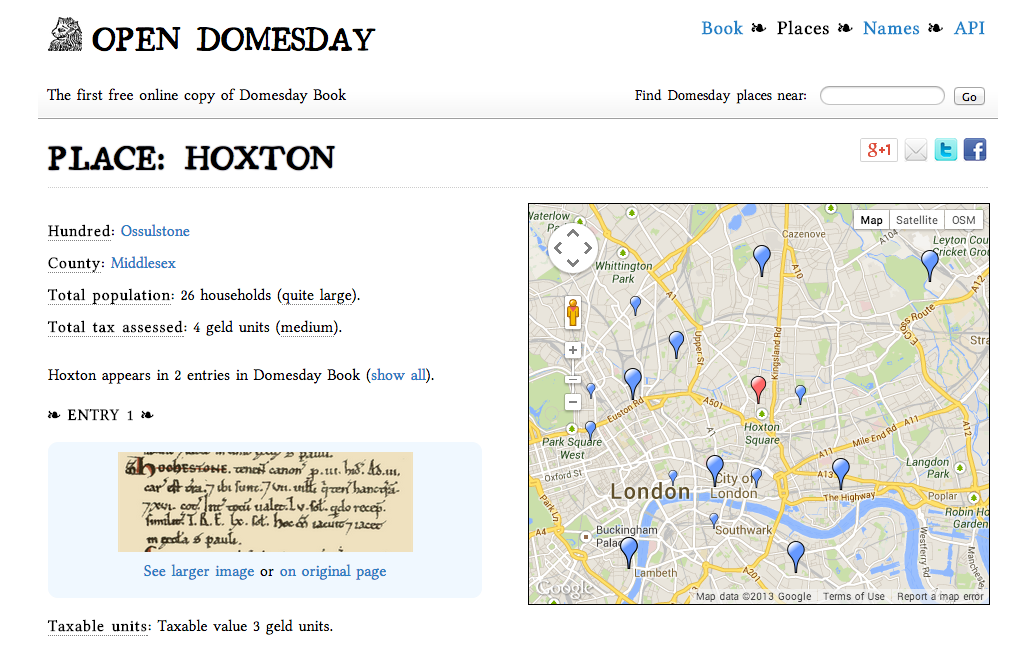
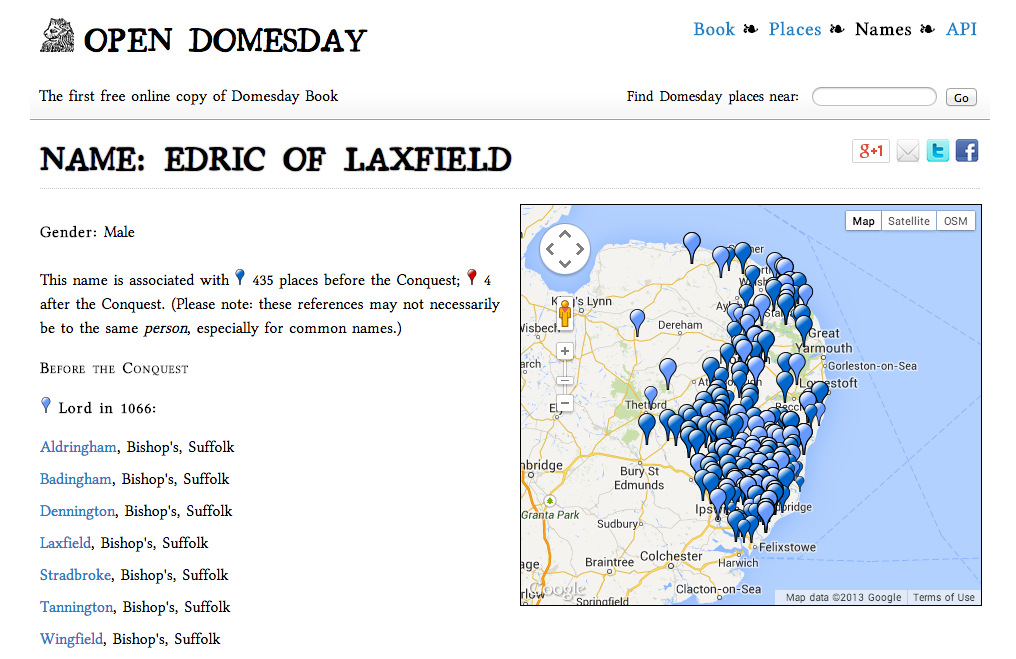
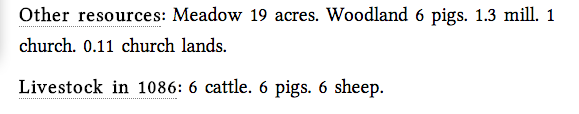
DOMESDAY BOOK
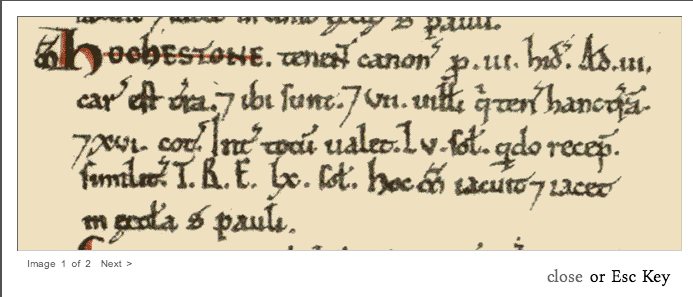
DOMESDAY BOOK
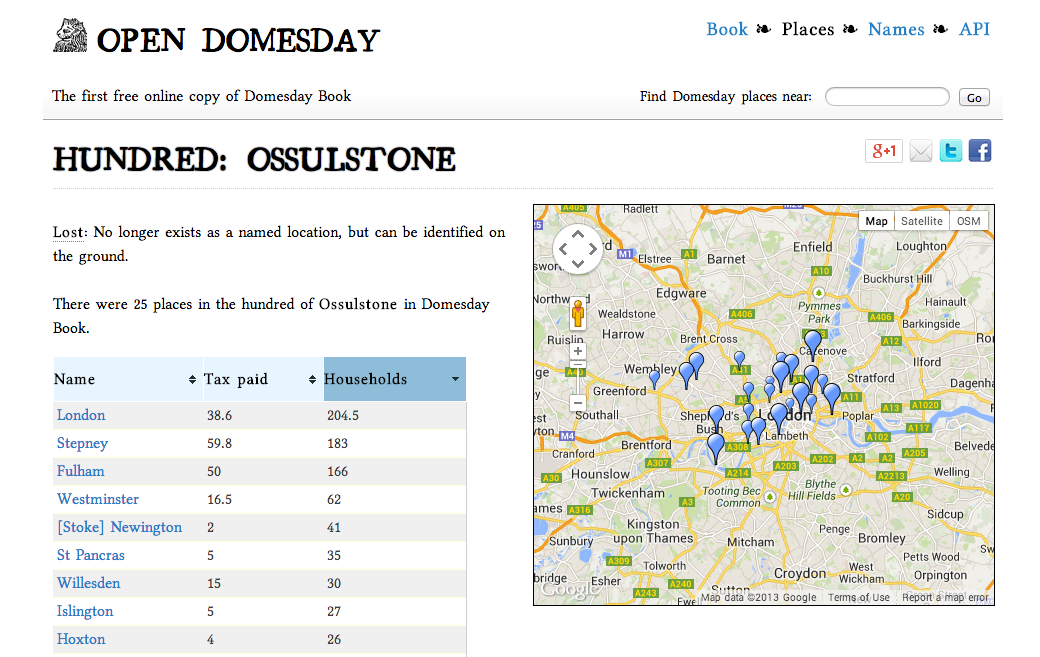
DOMESDAY BOOK
SHEEP, COWS AND EELS
The original overambitious Government IT project...
starting out in Norfolk
DOMESDAY INFRASTRUCTURE
GeoDjango + PostGIS database back-end
+
Google Maps / OpenStreetMap front-end
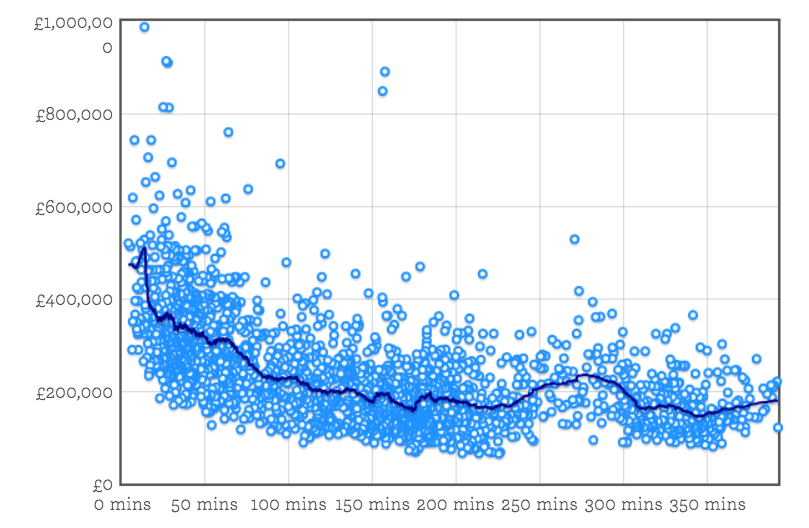
HOUSES PRICES / TRAIN TIMES
THE PROCESS
A. Train times
1. Get list of all train stations in England/Wales/Scotland, with postcode and TLC
2. Scrape traintimes.org.uk for direct peak-time trains
3. Take average of 3 train times
B. House prices
4. Convert postcode to lat/lng
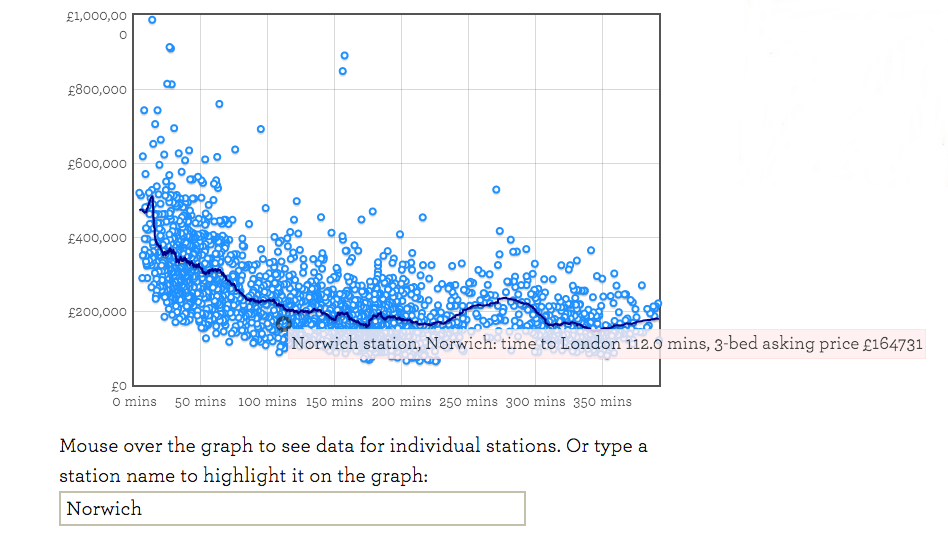
5. Run Nestoria API search on lat/lng: mean price of 3-bed within 2km in last 6 months
C. Graph
6. Graph house price against train times
7. Add moving average line, analyse the results
HOUSE PRICES / TRAIN TIMES
A TALK OF TWO HALVES
1. A brief overview of the landscape

A TALK OF TWO HALVES
2. So, you've got some awesome data... what now?

PART 1: MODERN MAPS
- Insanely brief background: maps on the web
- Hot topics:
-
Tools
- Awesome map-making tools - Mapbox, CartoDB
- Map superpowers with D3.js
- WebGL for million-point maps in the browser
Data- Big OSM data, and big data tools
- Governments releasing open geographic data
- Real-time data
EARLY 1990s: FIRST WEB MAPS
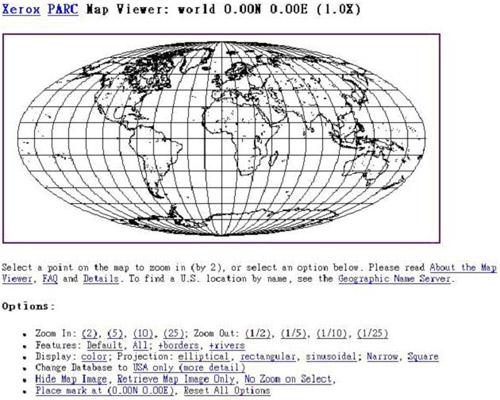
1993: Xerox PARC Map Viewer
Change scale, projections, add marks
1990s/2000S: TILED MAPS IN HTML, Flash, JAvaSCRIPT
Address lookup, aerial photos, map display, routing
1996-2006: Multimap
2005: GOOGLE MAPS -
MAPS 2.0
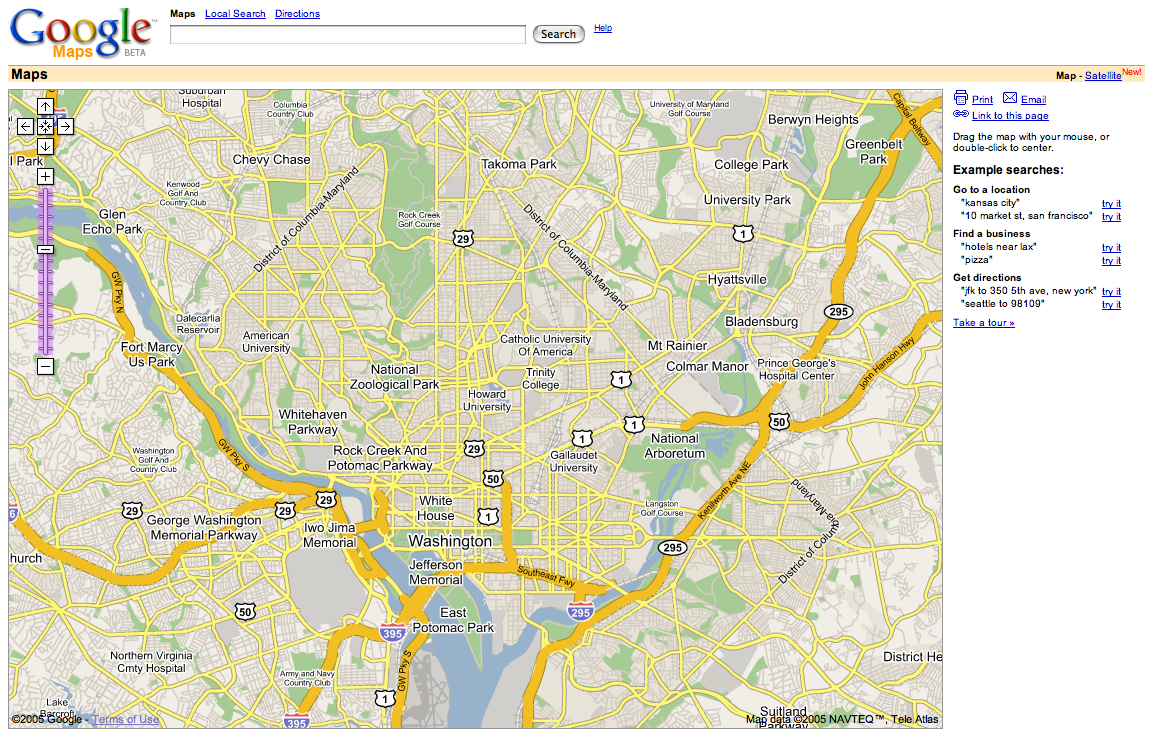
Slidable, zoomable maps using Ajax
2004-: OPEN STREET MAP
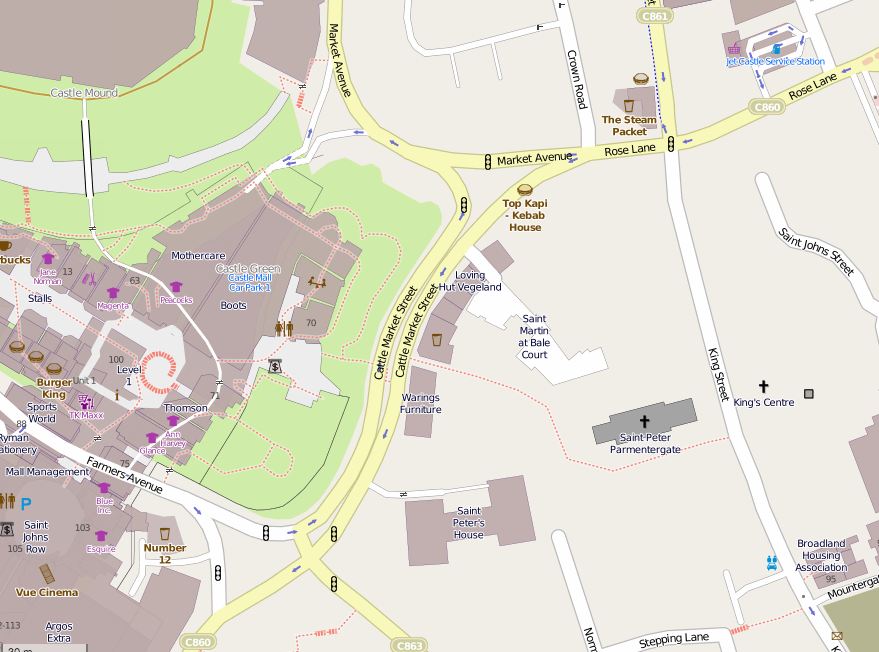
Open map data: the Wikipedia of maps
MODERN MAPS:
AWESOME MAPPING TOOLS
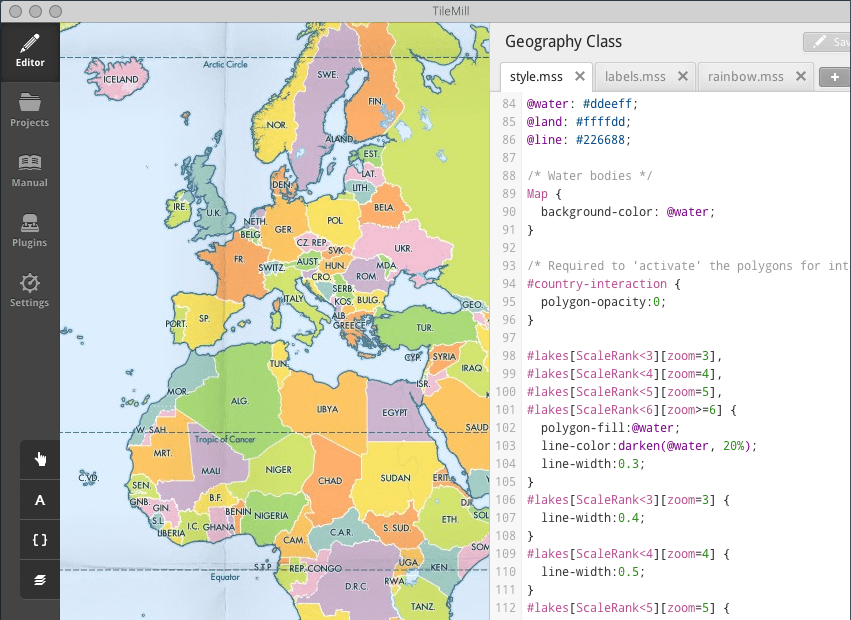
TileMill, Mapbox
MODERN MAPS:
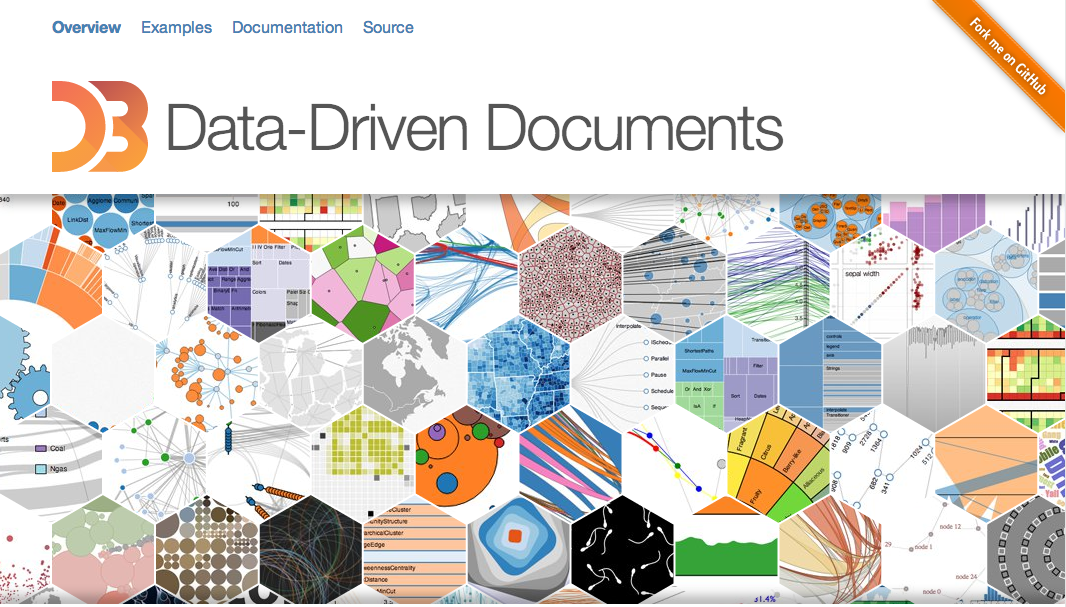
D3.JS
D3: Visualization LIBRARIES

Before D3
BEFORE D3: CHARTING LIBS
Convenient, but tricky to extend or debug
var plot1 = $.jqplot('chart1', [[3,7,9,1,4,6,8,2,5]]);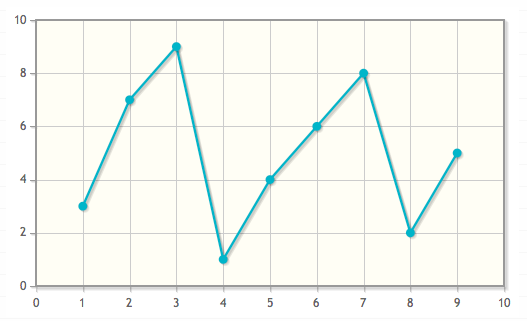
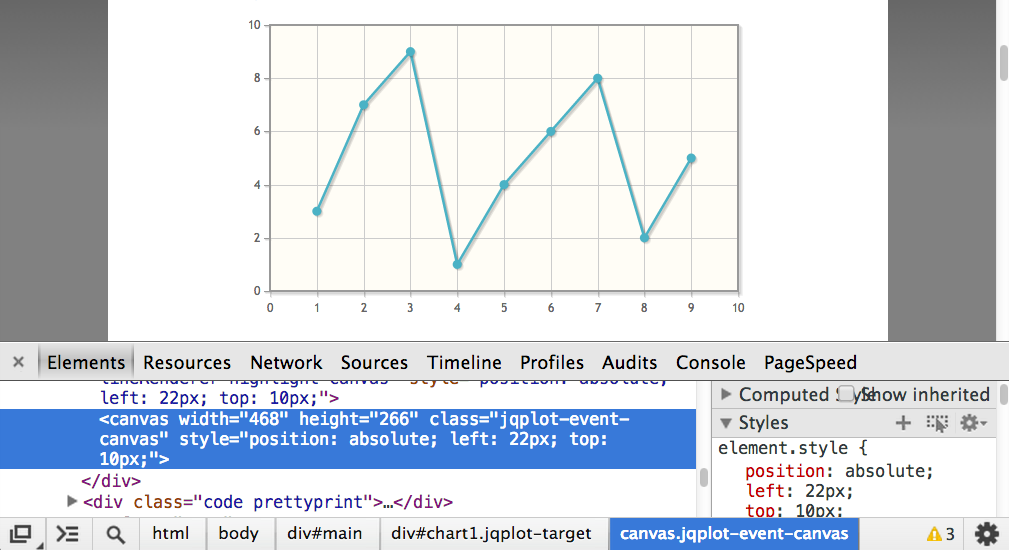
BEFORE D3: Charting LIBS
Hard to debug using standard web tools
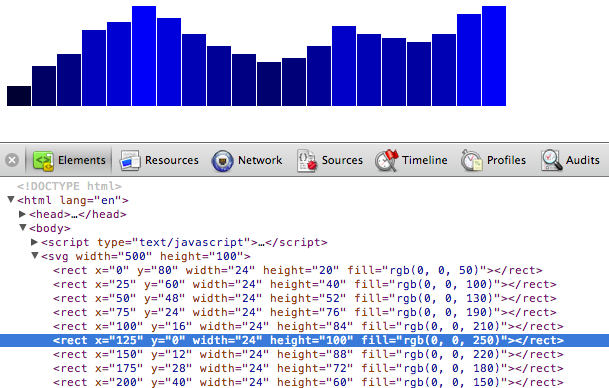
D3.jS: Bind data to the dom
var dataset = [ 5, 10, 13, 19, 21, 25, ...];

var rectangles =
    svg.selectAll("rect").data(dataset)

rectangles.enter().append("rect")
.attr("width", 24)
.attr("height", function(d) {
    return d * 4;
});
WITH D3: DEBUG IN BROWSER
The D3 Difference
1. Solves the fundamental problem of data visualisation: manipulate the DOM with data
2. Web standards: style with CSS, interact with JS events, debug with DevTools
3. Fast, simple, efficient
4. Sexy animations and transitions
5. Modular code encourages plugins
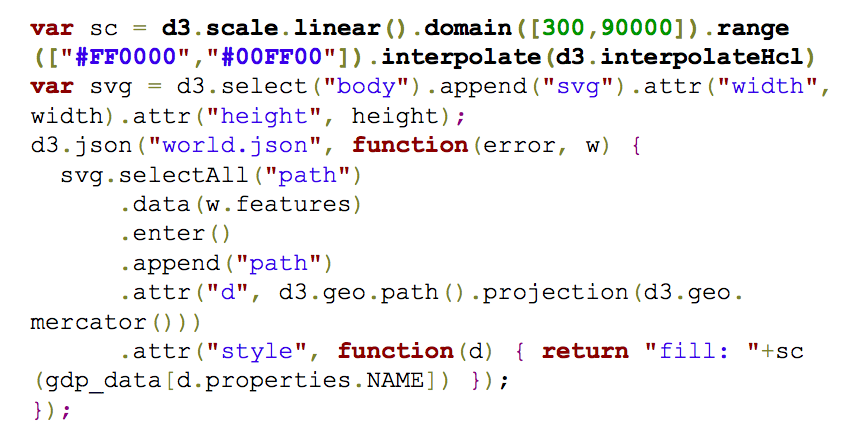
MODERN MAPS WITH D3
MODERN MAPS:
WEBGL & MILLION-POINT maps
MODErn MAPS: OSM DATA
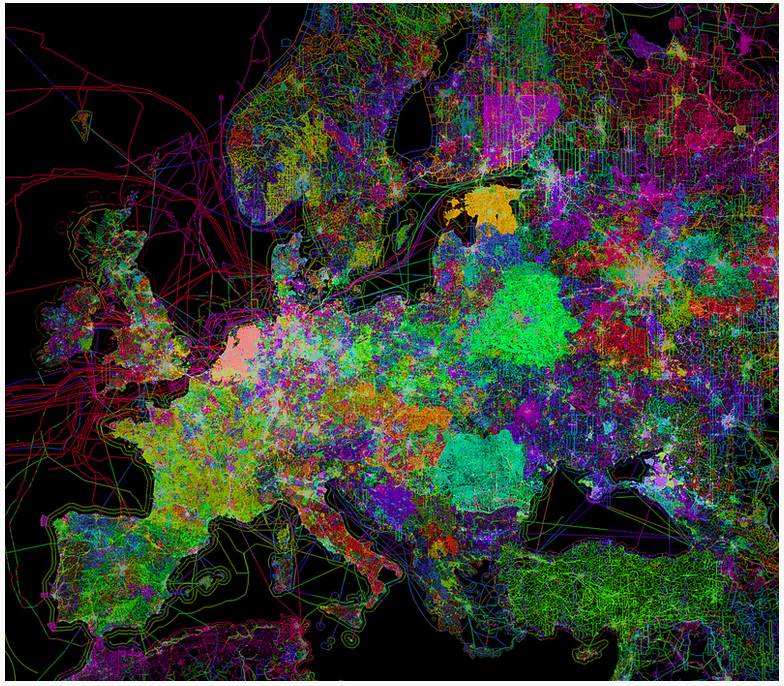
Map of OSM contributors in Europe
MODERN MAPS:
USING OSM DATA
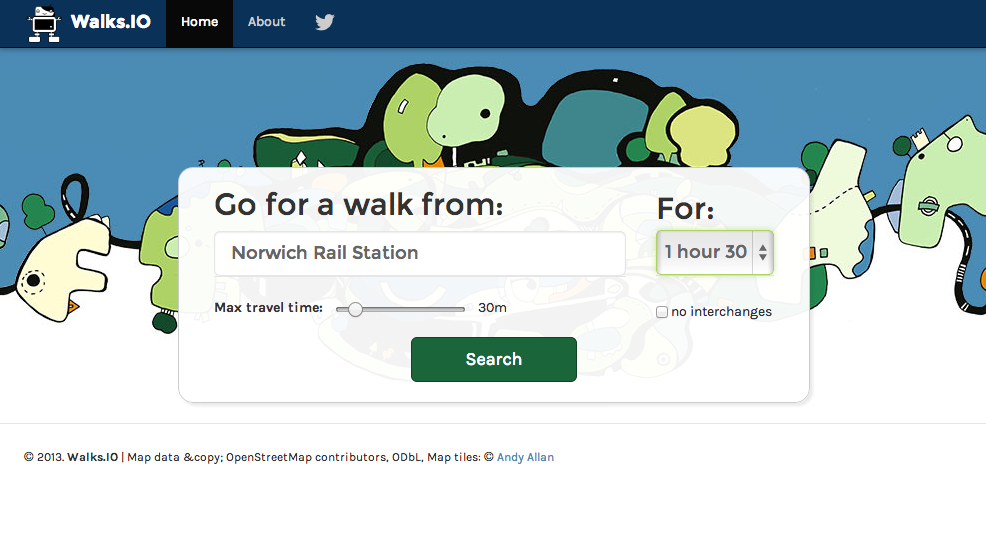
walks.io - automatic walk generator
MODERN MAPS:
USING OSM DATA
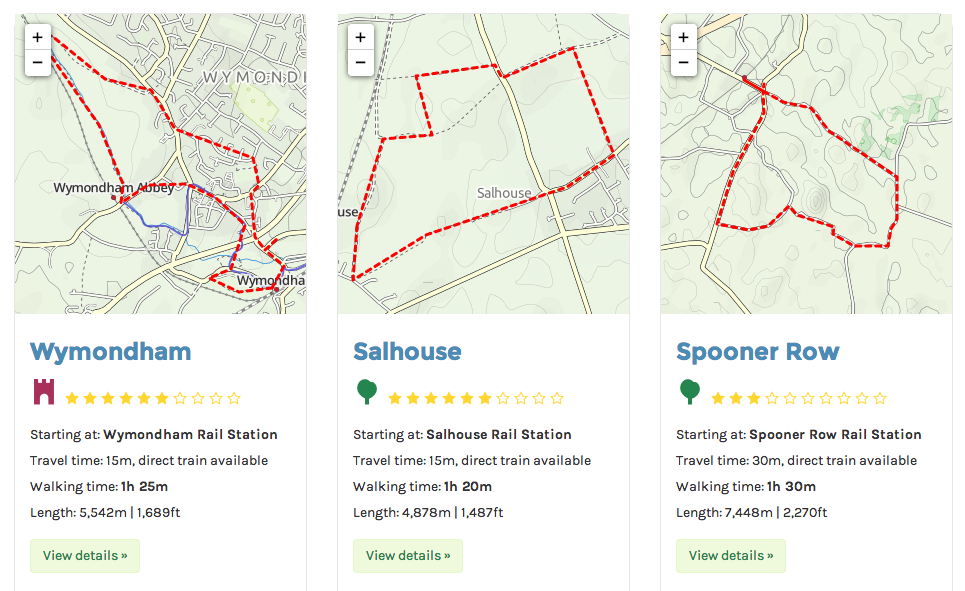
automatically finds walks within a set travel time
from OSM footpaths, stations and scenic-ness data
from OSM footpaths, stations and scenic-ness data
MODERN MAPS:
OPEN REAL-TIME DATA
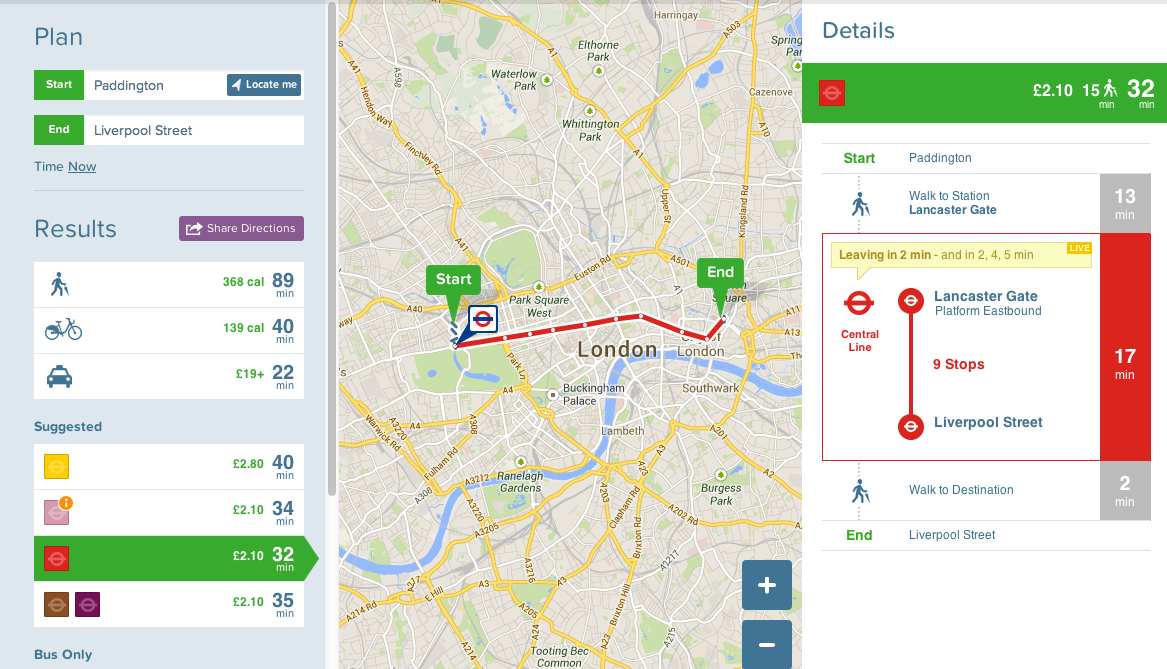
http://citymapper.com
MODERN MAPS:
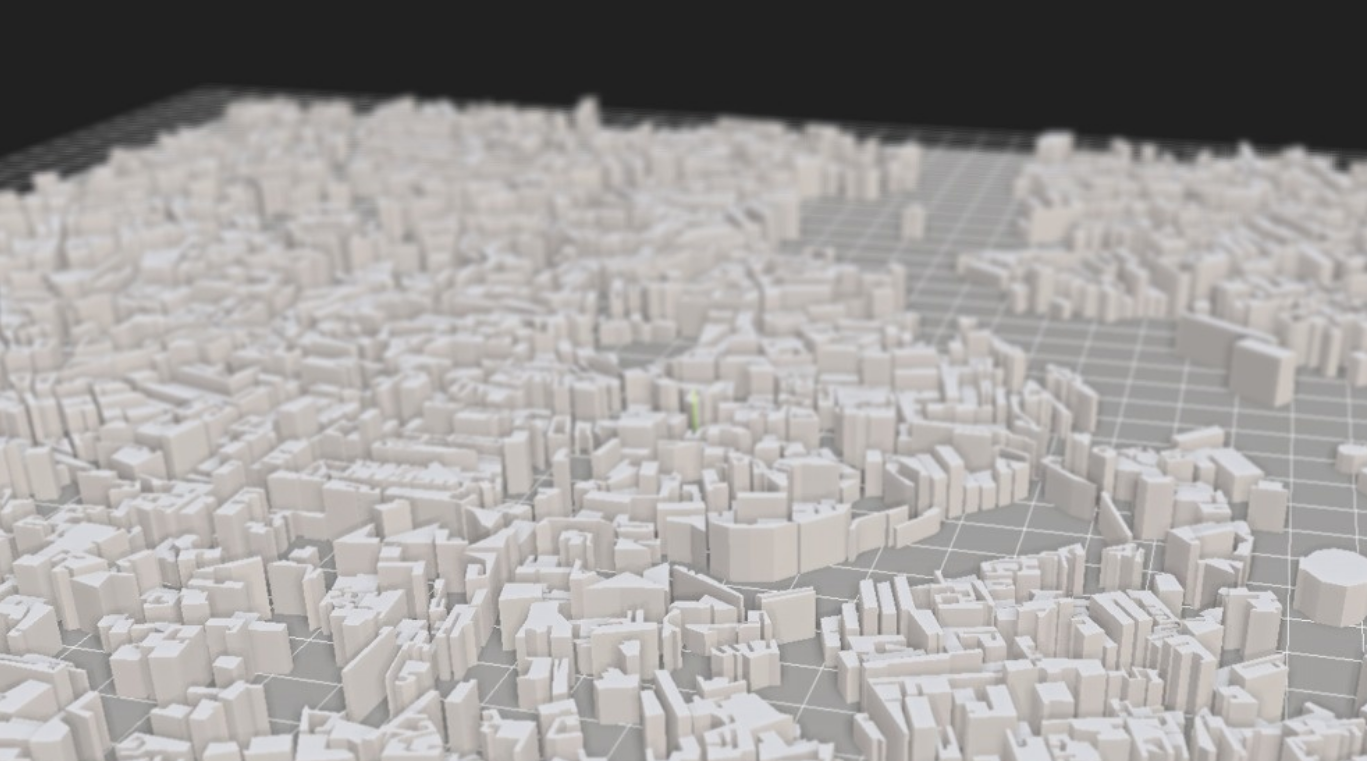
OSM + WEBGL
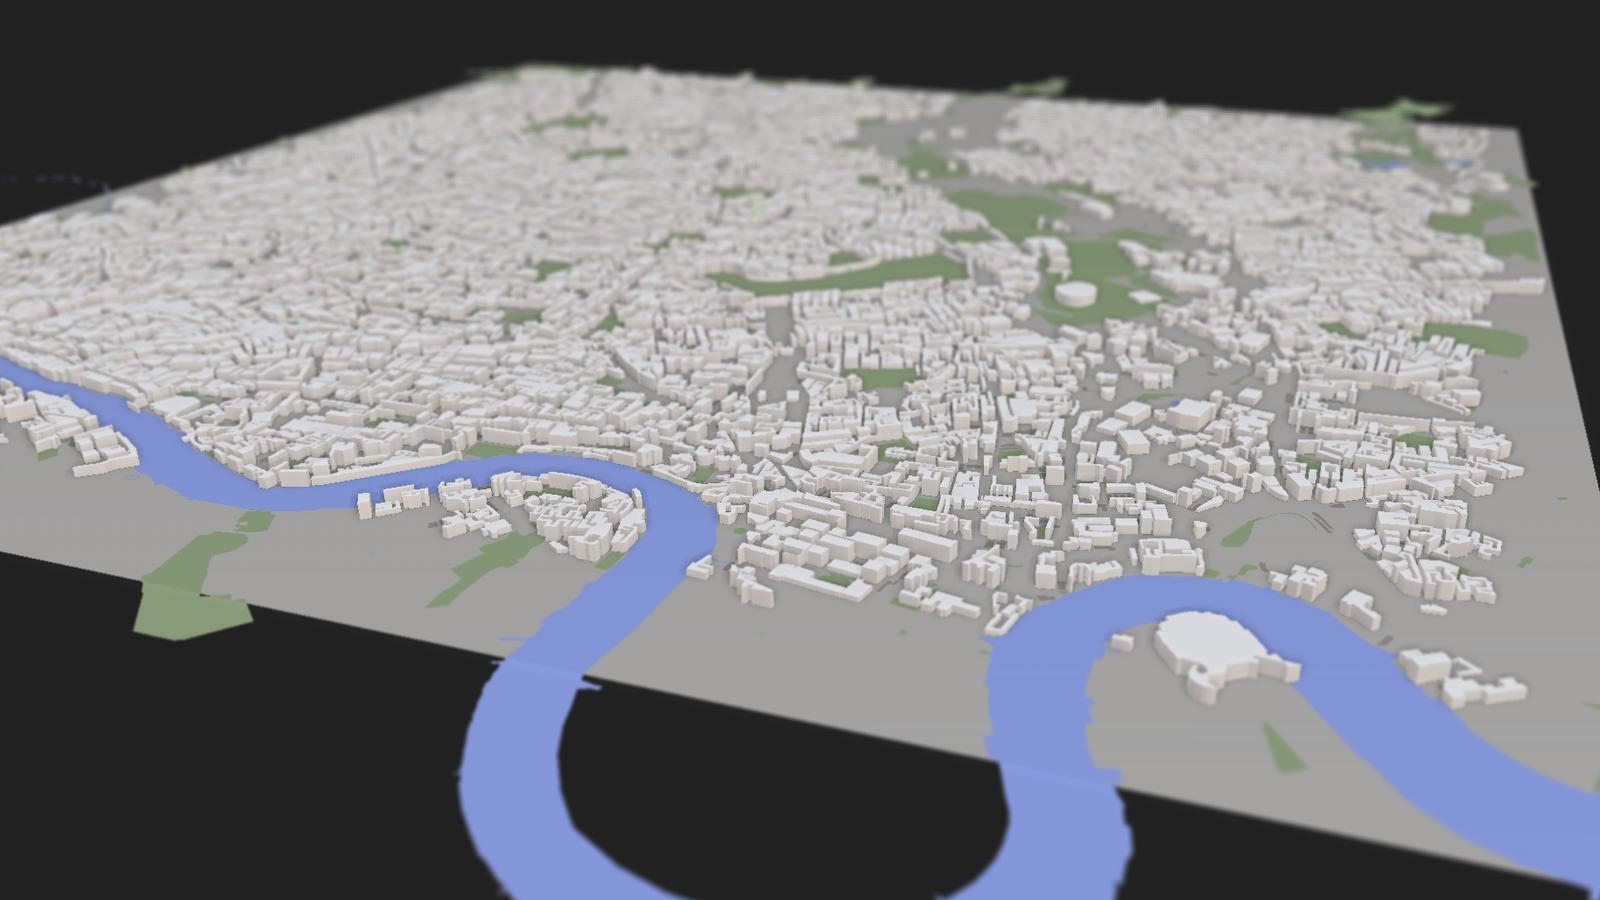
ViziCities: OSM data in the browser
MODERN MAPS:
OPEN DATA + WEbGL
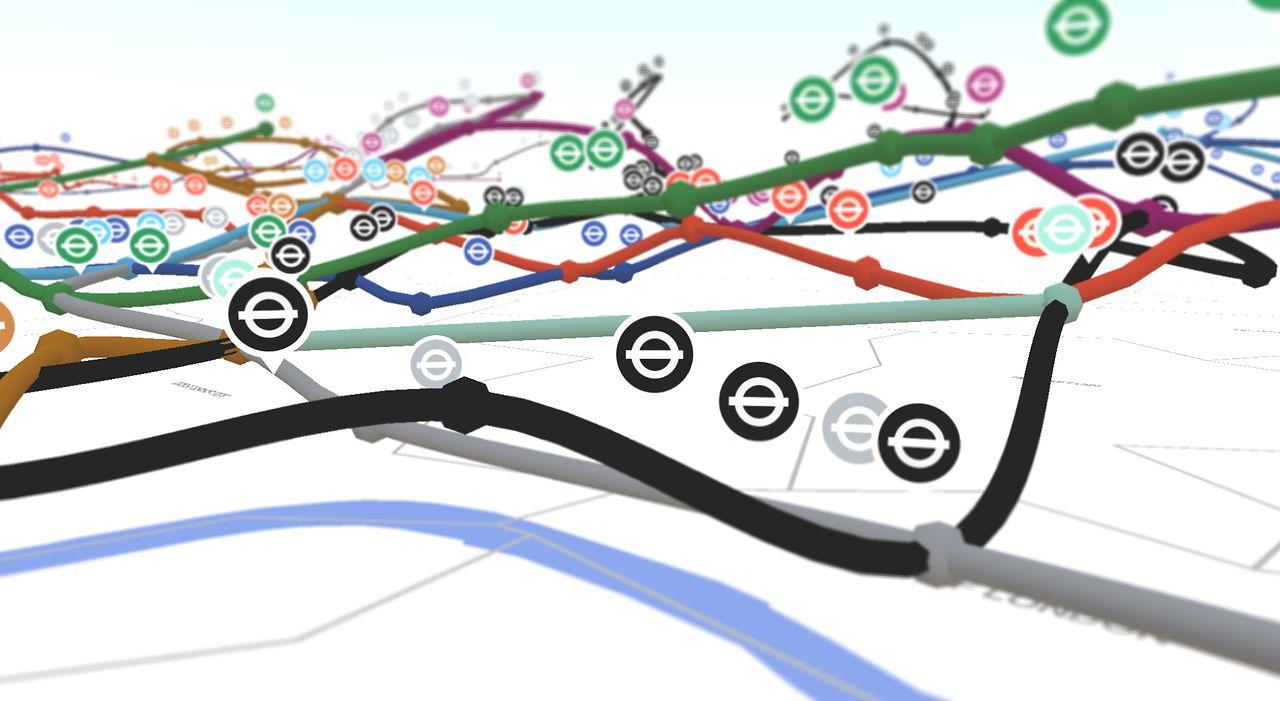
http://vizicities.com
PART 2:
SO, YOU'VE GOT SOME DATA...
You've got a spreadsheet of some awesome data, and you want to put it onto a map.
What now?
1. Geocoding your data
2. Exploring your data
3. Displaying your data
GEOCODING YOUR DATA
Geographic fields you may have:
-
Latitude & longitudes
-
Postal codes
- ONS codes
-
Address strings, town names
- Administrative districts - names or codes
Geocoding = geographic fields -> coordinates
LATLNGS
You're very lucky!
-
Points
-
Lines
-
Polygons
... you can start exploring and displaying right away
GOOGLE FUSION TABLES
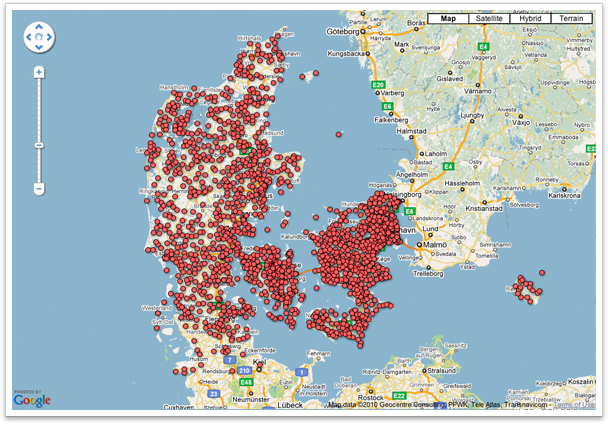
Launched in 2009 for large data tables
Unbeatable ease for getting started
GOOGLE FUSION TABLES
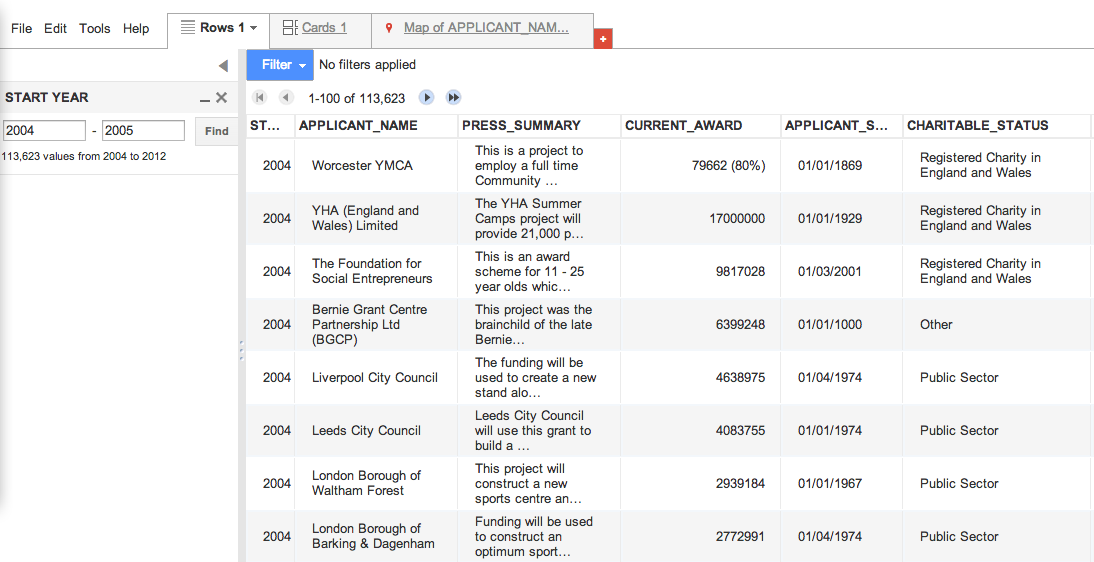
Sort and filter data, view results on map
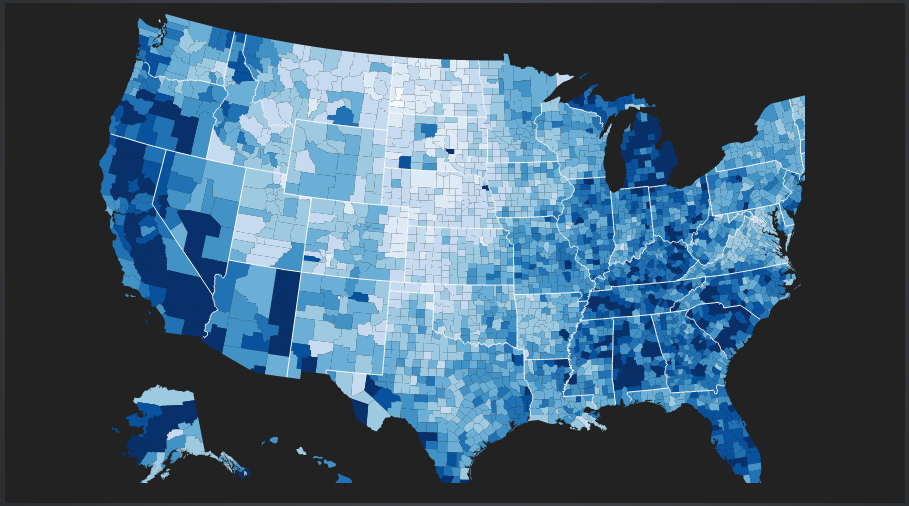
GOOGLE FUSION TABLES
Heat maps out of the box
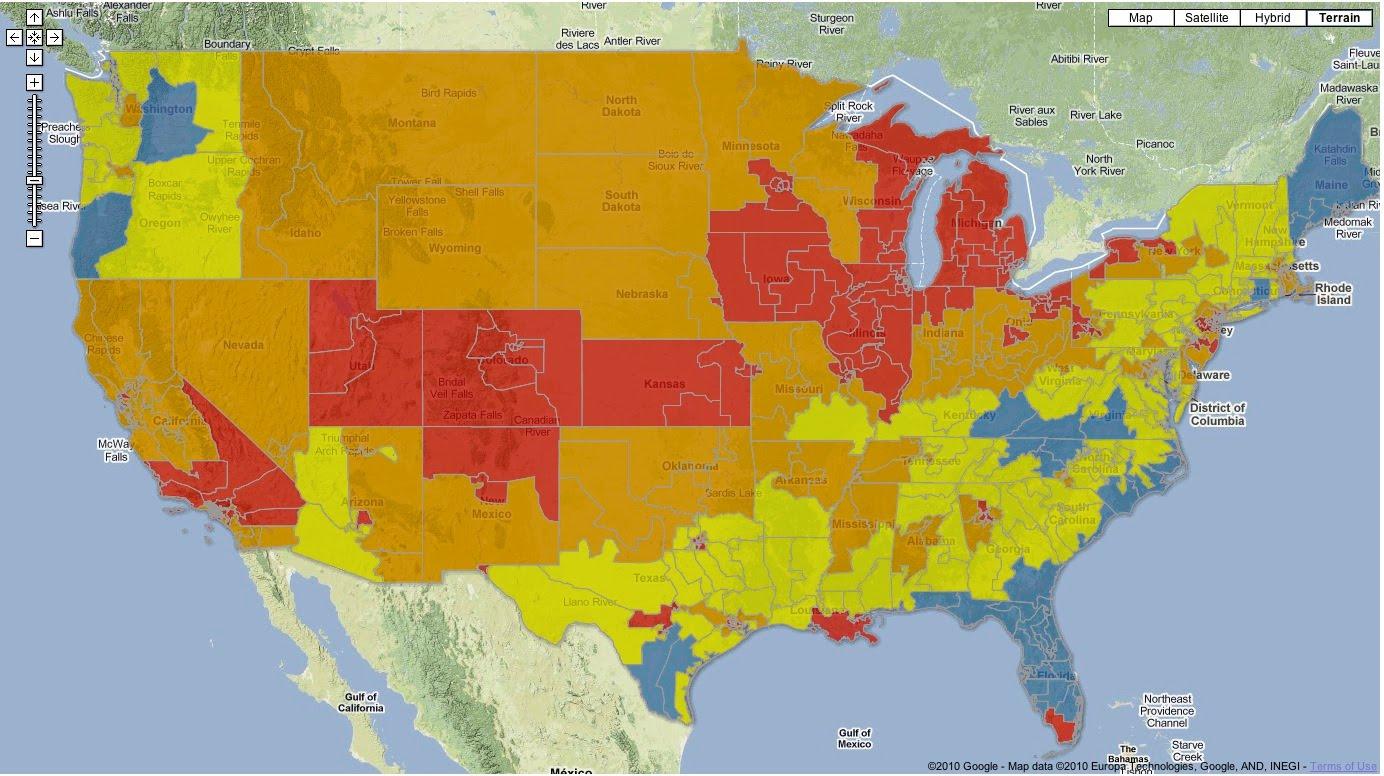
Chloropleths (intensity maps) - merge with boundaries
CARTODB
Google Fusion Tables +++
Hosted geospatial database with PostGIS
Free only up to 25MB
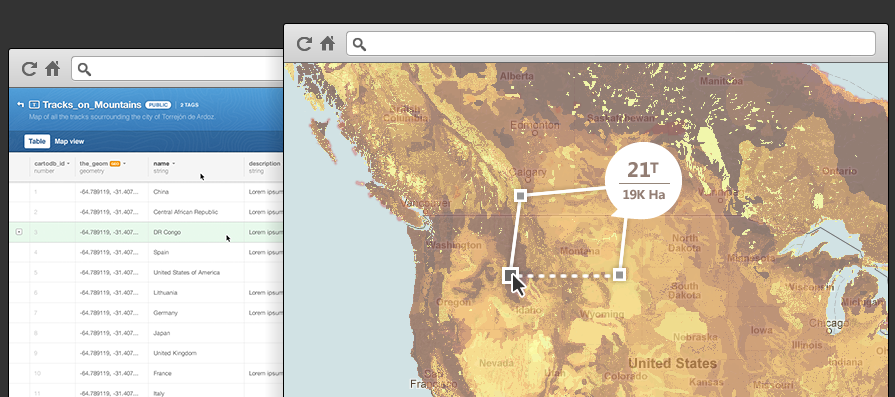
CARTODB
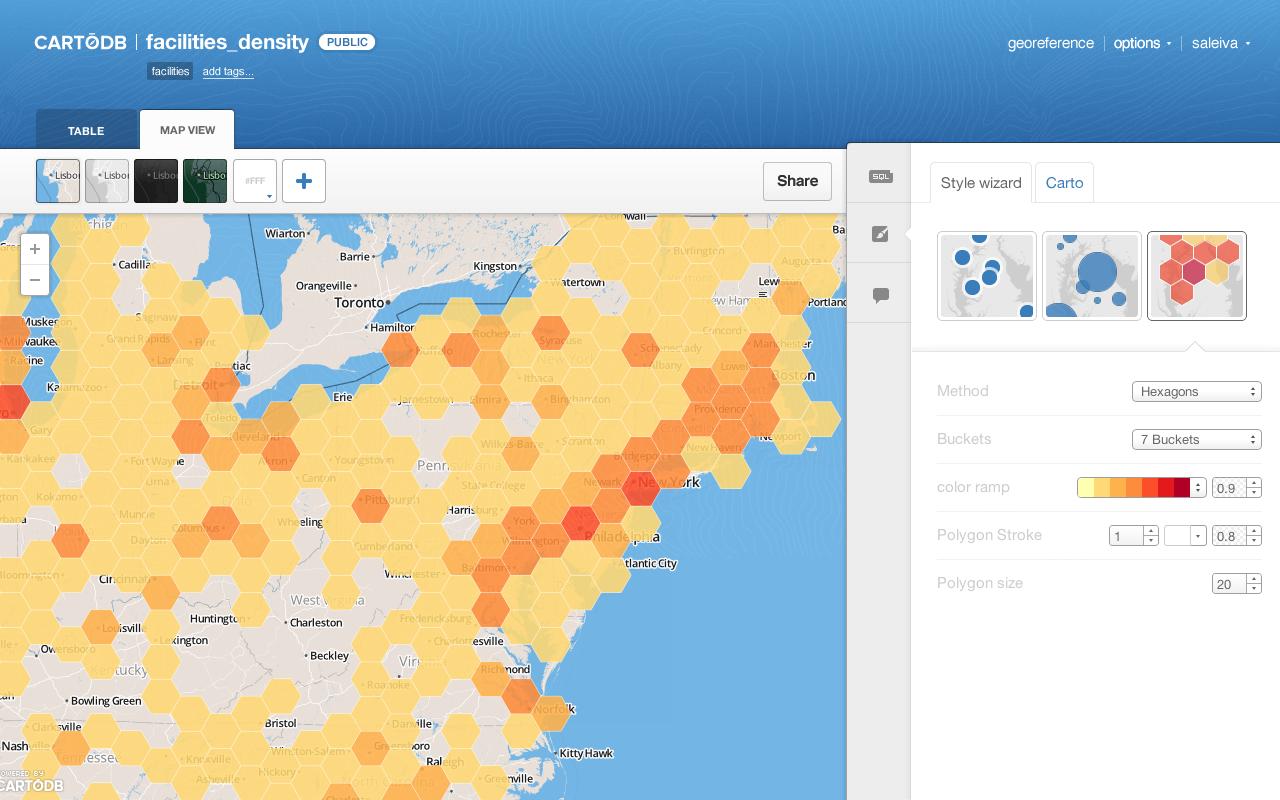
Hexbins and advanced styling,
customisable info-boxes, choice of map backgrounds
CARTODB
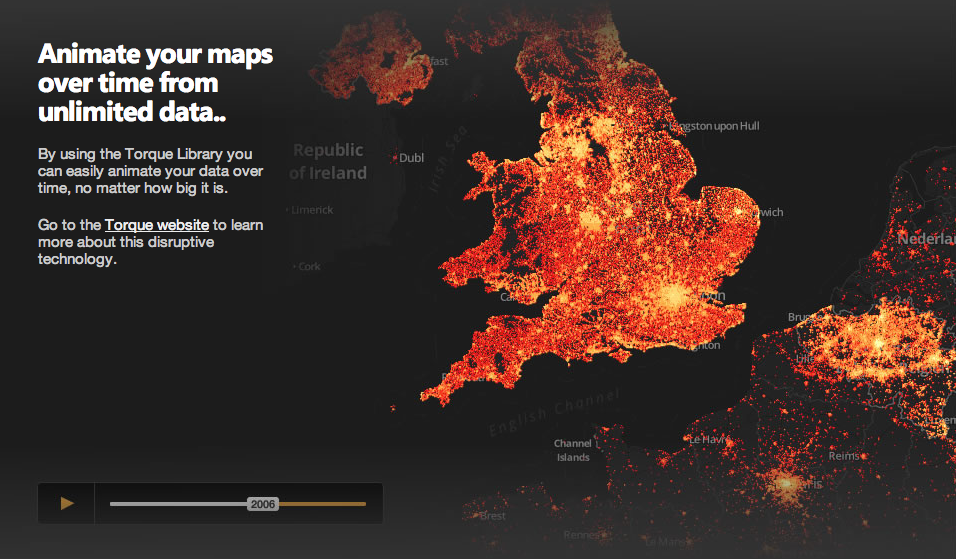
Dynamic time maps with Torque
TILEMILL & MAPBOX
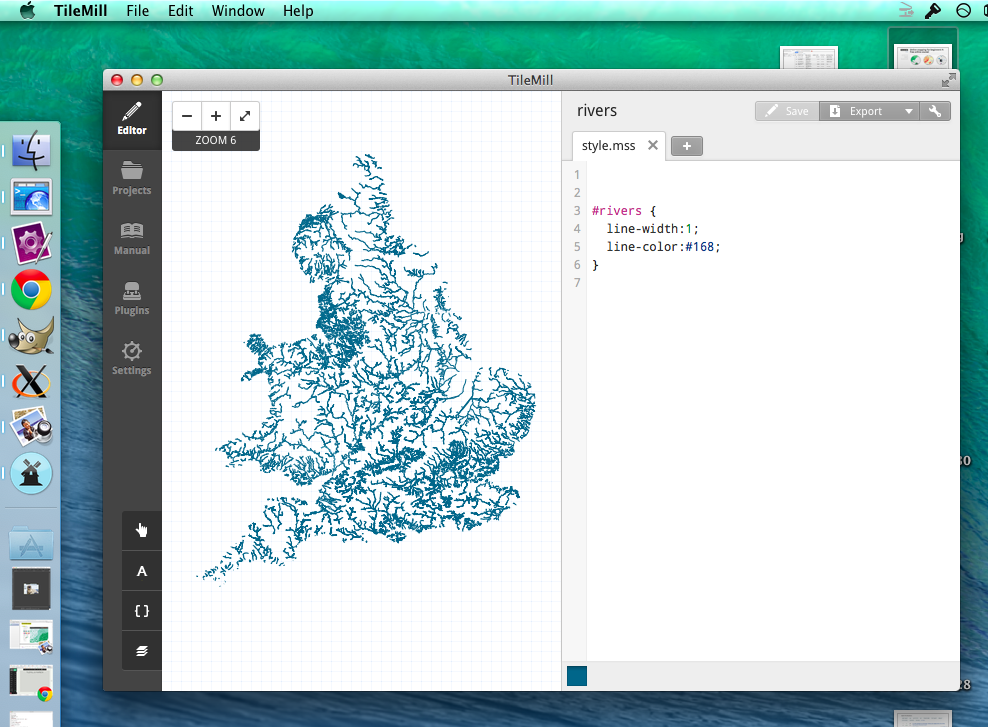
TileMill desktop software for Mac and Windows:
Import datasets, design your own maps -
again, no programming skills needed
POSTCODES

Full postcodes should "just work"
in Google Fusion Tables, CartoDB.
in Google Fusion Tables, CartoDB.
But beware postcode accuracy!
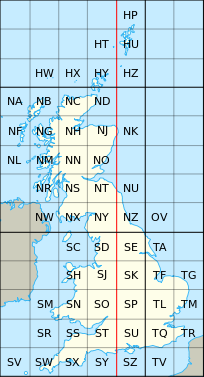
NATIONAL GRID (OSGB36)
Coordinate TF0325
find grid TF, 3km east
and 25km north
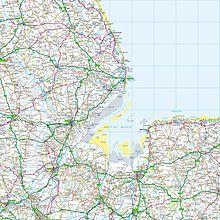
To get latlng, use UK Postcode API:
http://www.uk-postcodes.com/api.php
ADDRESS STRINGS
-
King's Centre, King Street, Norwich
-
King Street, Norwich
-
Norwich
Can use Google Maps or CartoDB (Nokia) to geocode
Probably won't be 100% accurate
ADMINISTRATIVE DISTRICTS
If your file has long strings like 'E09000001'...
congratulations, those are UK districts!
You'll need to find the boundaries.
HOW?????
uk districts
These can be:
-
Administrative - councils, districts
-
Electoral - constituencies, wards
-
Census - output areas
-
Health - here be dragons!
-
Postal - ye olde postcode
-
Other - police, Europe...
See: A Beginner's Guide to Geography, by the ONS
ADMINISTRATIVE
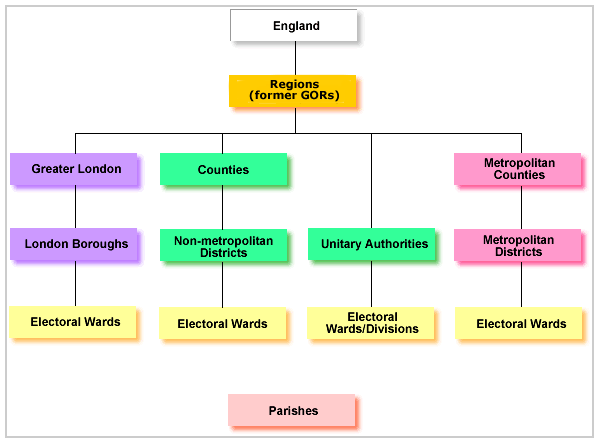
Boring but crucial.
Get boundaries from ONS (open data).
Get boundaries from ONS (open data).
ONS ADMIN CODES
Woohoo! The most exciting part of our talk!
ONS changed all its data codes in 2011.
From hierarchical short codes:
-
12 - Cambridgeshire
-
12UD - Fenland... etc
To nine-letter codes, all starting with E0:
- City of London - E09000001
The first two numbers now tell you the type of area.
Your data may have either!
MAPPING ONS CODES
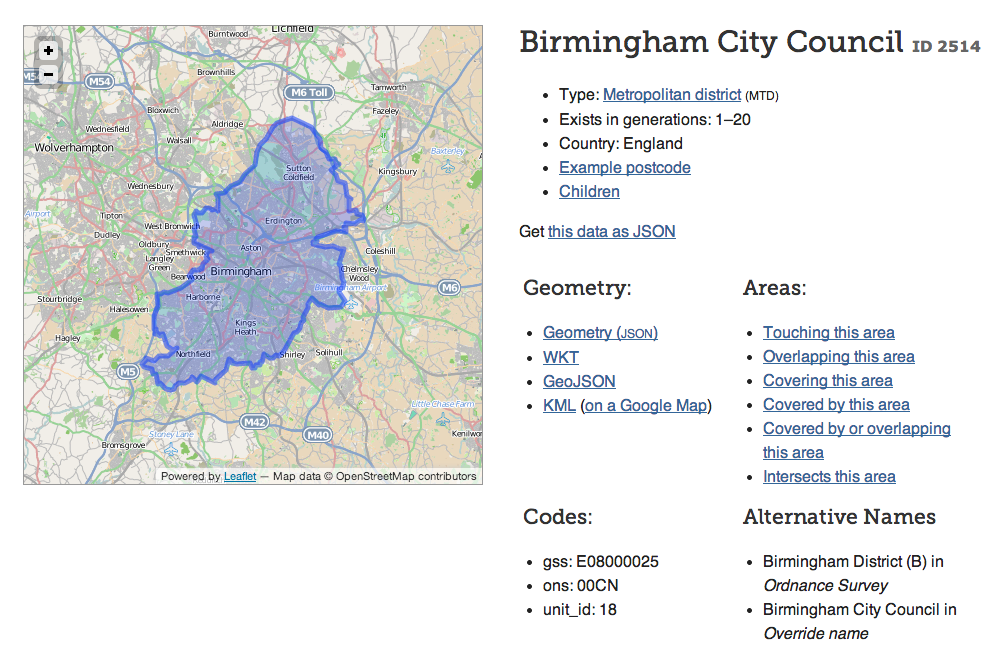
MapIt!
http://mapit.mysociety.org/area/E08000025.html
http://mapit.mysociety.org/area/OOCN.html
gns <-> ons codes
MAPPING ADMIN BOUNDARIES
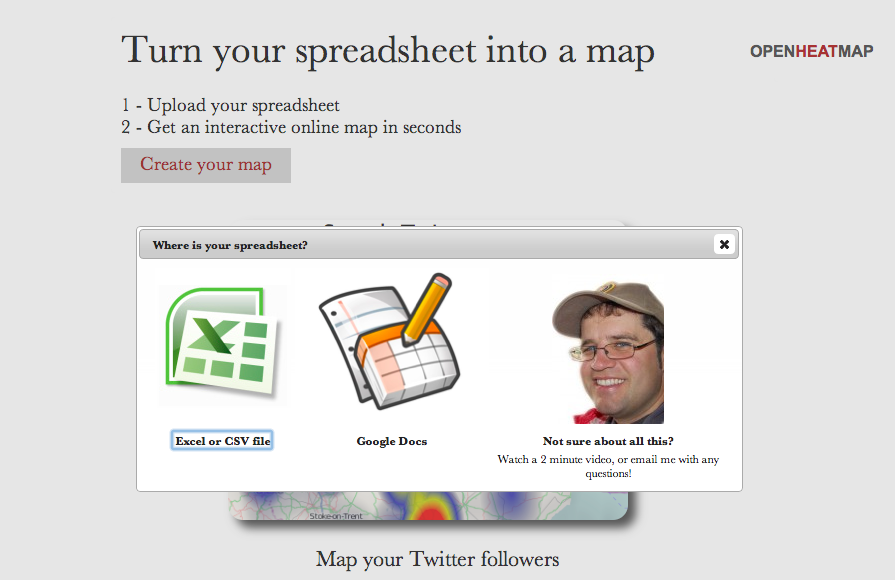
Can be done with Fusion Tables or CartoDB with a little effort, but for no effort at all... OpenHeatMap
INSTANT SHAREABLE MAPS
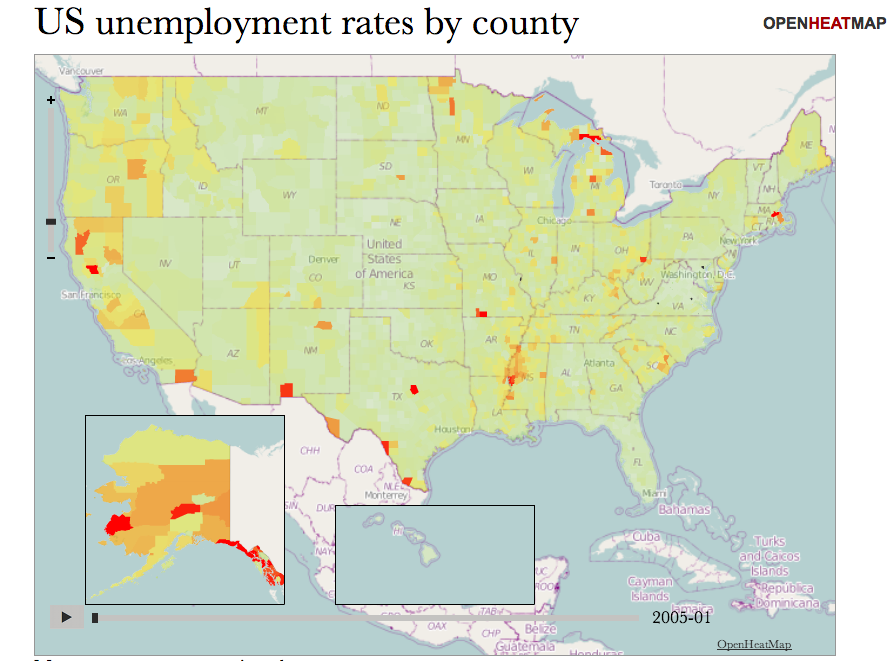
Note time slider!
Open HEAT MAP
What OpenHeatMap understands in the UK:
Admin regions:
-
Council names
-
Council codes (old codes only)
-
County names
-
Region names
Electoral regions:
CENSUS: OUTPUT AREAS
- Designed to be static
- Designed to be socially homogenous
-
OAs are about 150 households, LSOAs = 4-5 OAs
-
Census/social data typically available at LSOA level
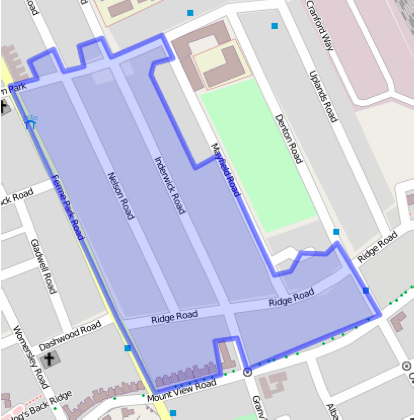
OUTPUT AREAS...
... are cool
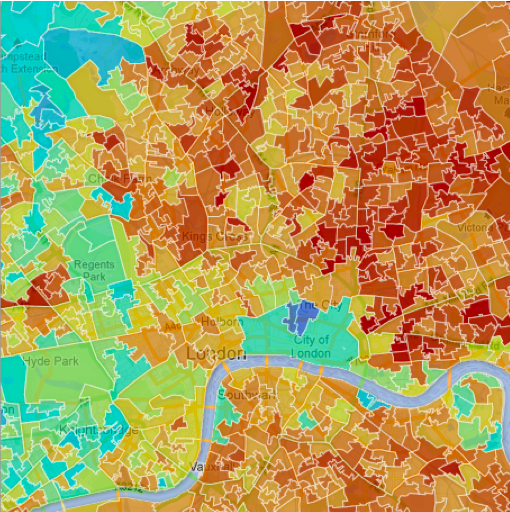
OUTPUT AREAS
-
Get boundaries from the ONS
-
Shapefile is about 150MB
-
You can make it smaller with ogr2ogr
POSTCODE -> ADMIN AREA?
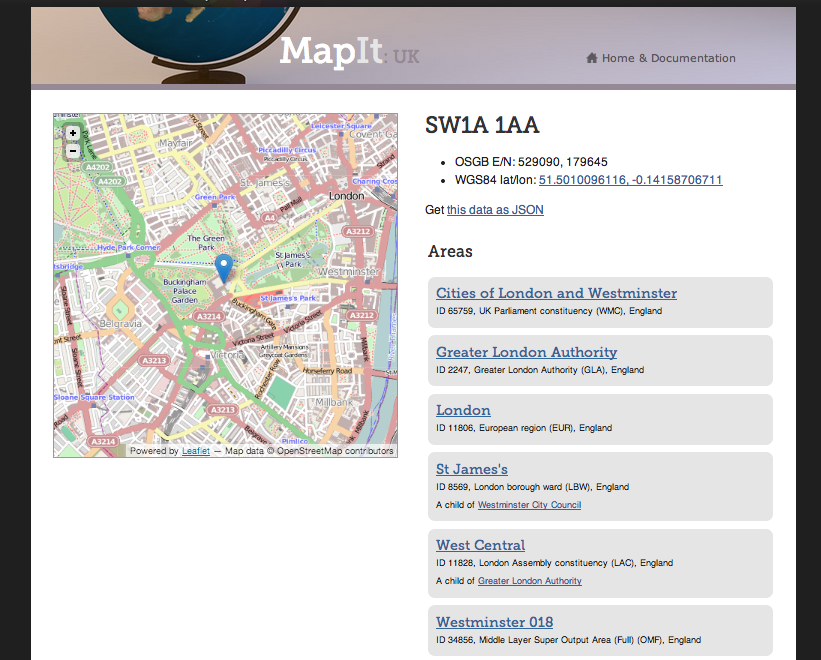
MapIt!
BOUNDARY AREAS?
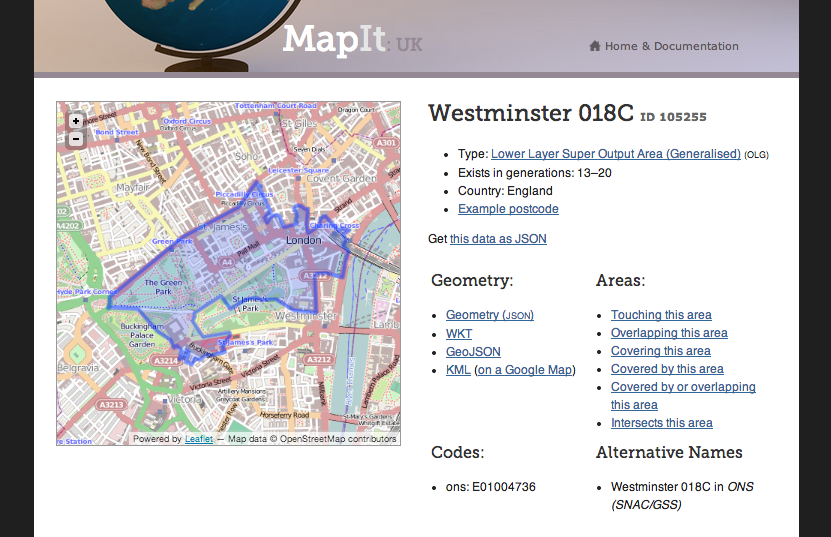
MapIt!
MAKING MAPS WITH D3
... is something to do
after you've explored the data
after you've explored the data
MAKING MAPS WITH D3
...is fun, but not something
you want to learn in a 20-minute talk
you want to learn in a 20-minute talk
MAKING MAPS WITH D3
Recommendations for starting mapping:
Scott Murray, Interactive Data Visualisation for the Web
Mike Bostock's Let's Make a Map
ARE WE DONE?
Nope!
DISPLAYING YOUR MAP
-
Projection
-
Colours
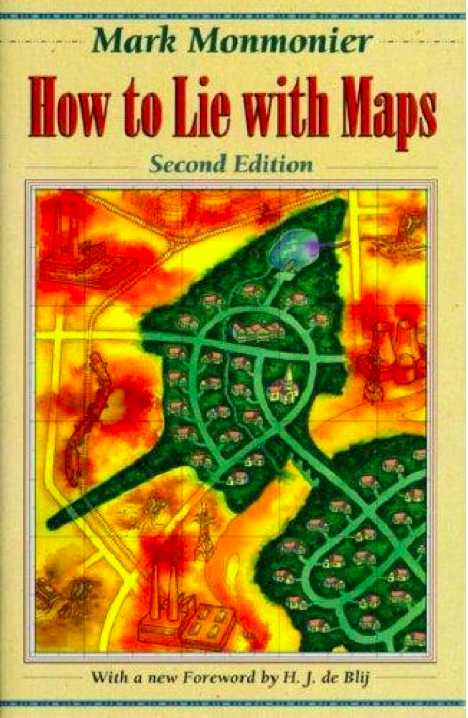
- How to lie with maps...
DISPLAYING - PROJECTIONS
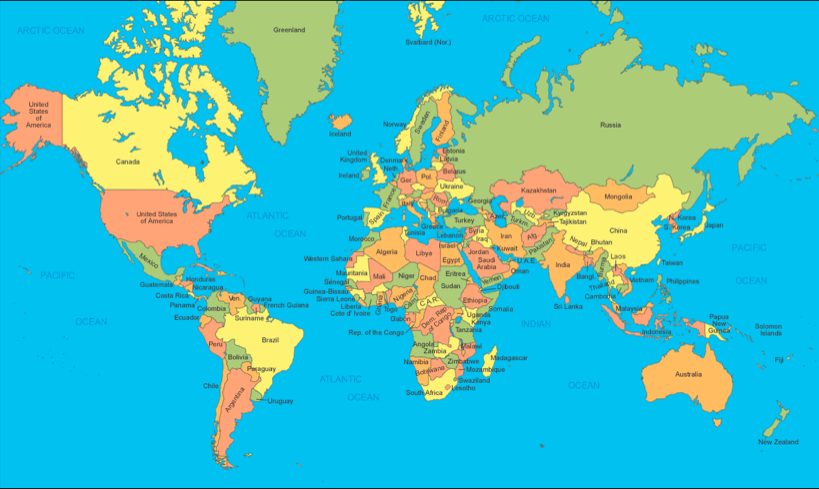
Is Greenland really bigger than Australia?
Projection slides from a talk by Dimi Sztanko (@dimi)
DISPLAYING - PROJECTIONS
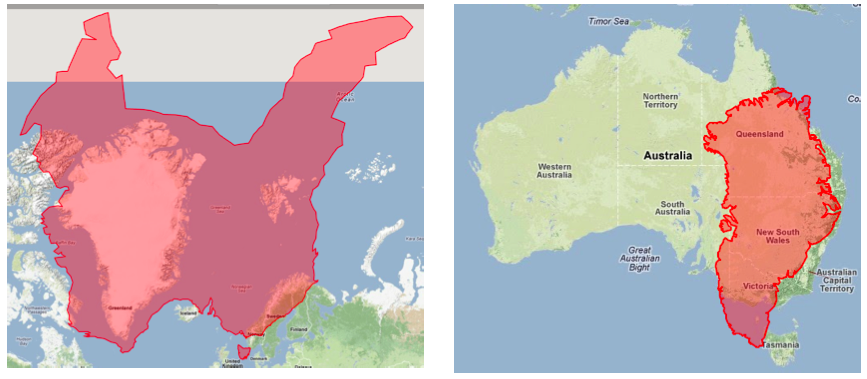
Nope!
MERCATOR PROJECTION
-
Cylindrical projection from 1569
-
Great for navigating with a compass...
-
Horrible for rendering the whole world
- "Politically incorrect"
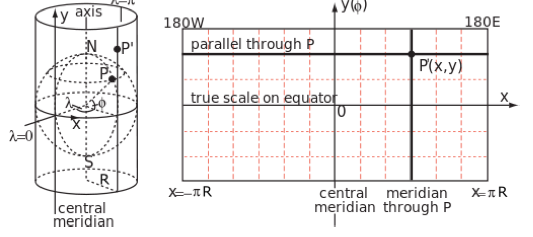
WHICH PROJECTION TO USE?
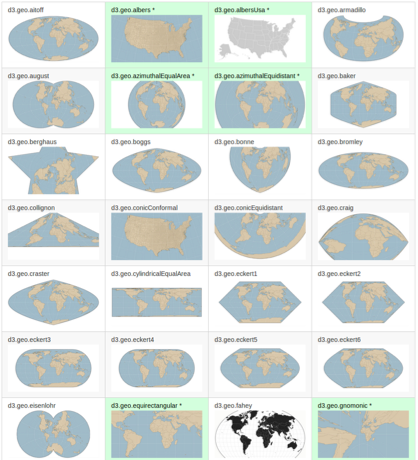
Hundreds to choose from...
NO "RIGHT" ANSWER
-
There is no silver bullet
-
Every projection has distortions
-
Depends what you are showing
-
Depends what do you want to say
-
Depends on your taste
- Ultimate super detailed guide with explanations: http://bit.ly/1iycTul
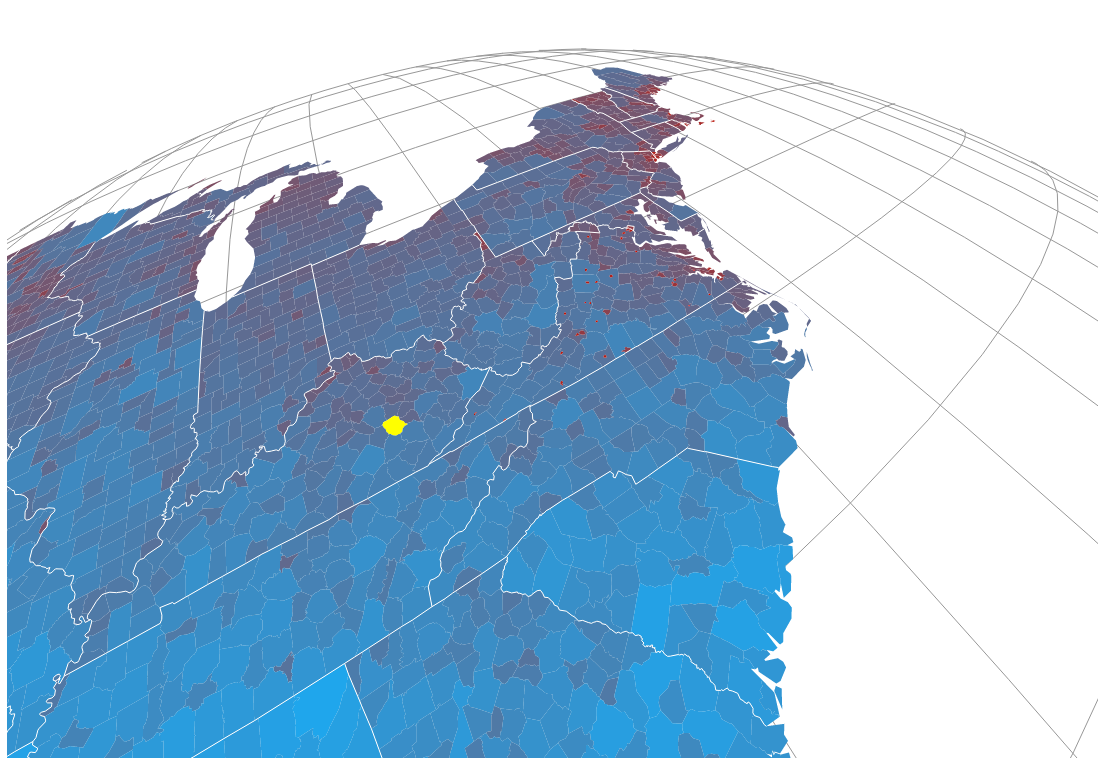
PROJECTIONS FOR COUNTRIES
If your country is elongated north-south...
use transverse mercator
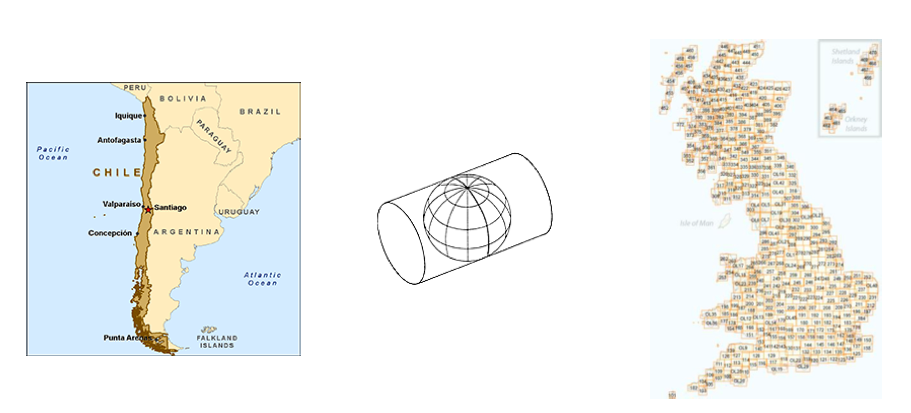
PROJECTIONS FOR COUNTRIES
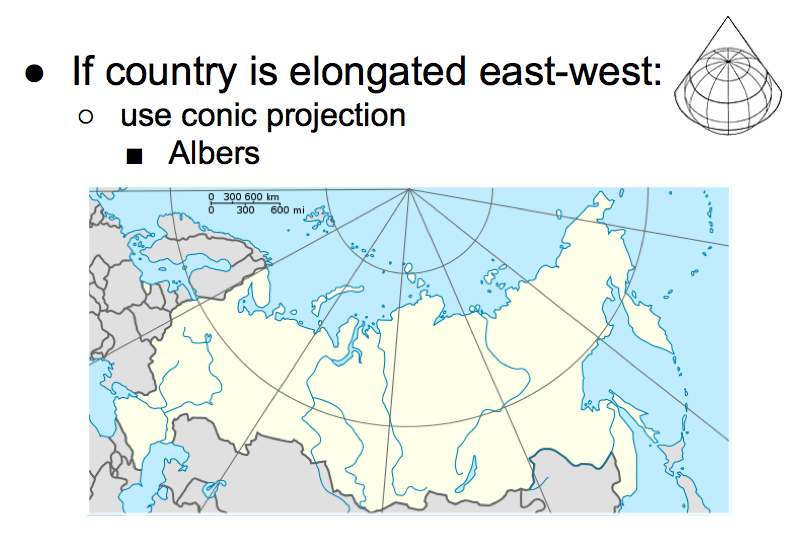
PROJECTIONS FOR COUNTRIES
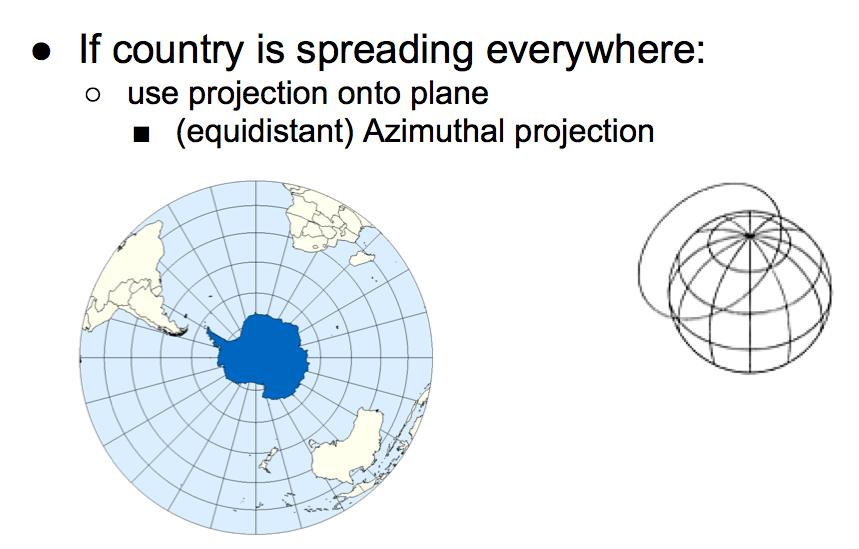
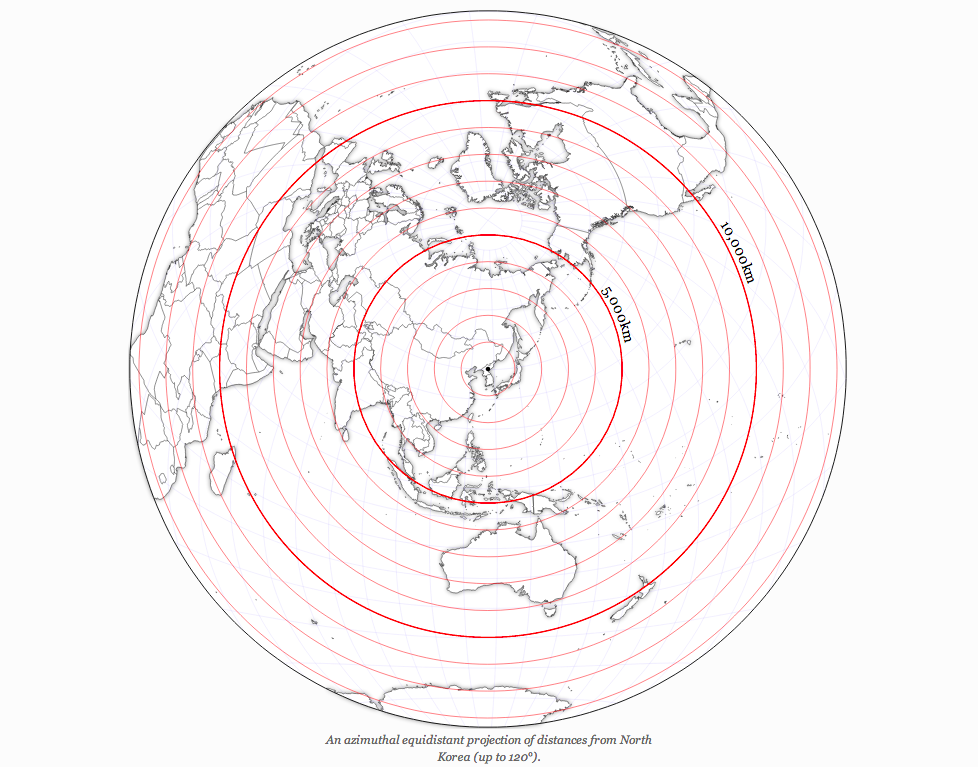
PROJECTIONS FOR DISTANCE FROM A SINGLE POINT
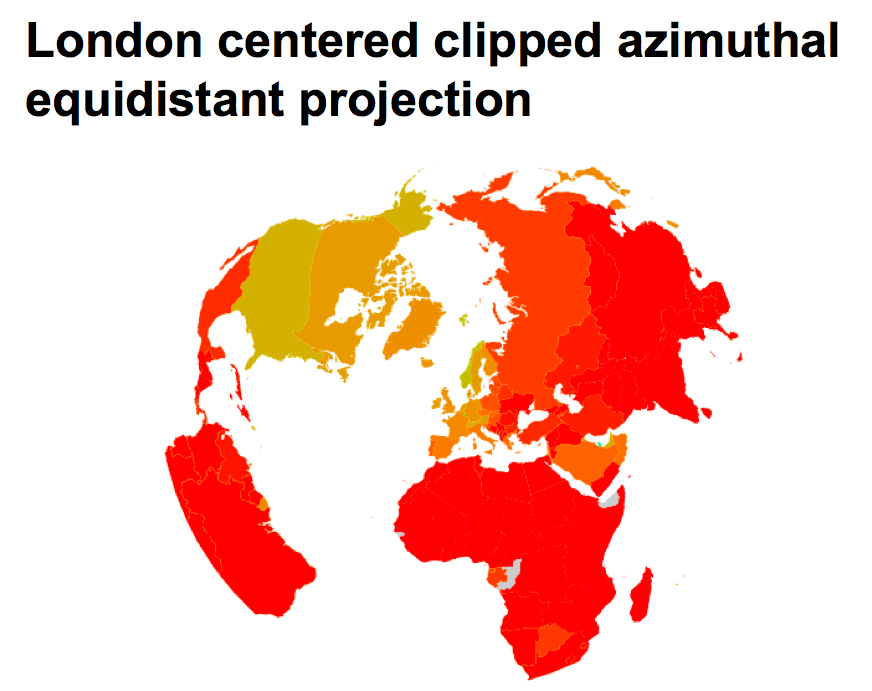
(USE FOR YOUR MISSILE MAPS)
DISPLAYING - COLOURS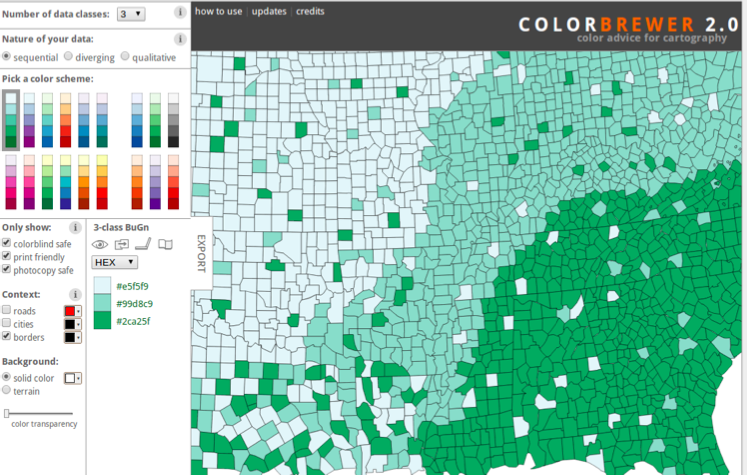
DISPLAYING - COLOURS
1. Identify the number of data classes
2. Set the nature of your data:
-
qualitative
-
diverging
- sequential
3. Choose options:
-
colour-blind safe
- print safe
4. Pick a colour scheme
DISPLAYING - MORE...
WHERE TO GET HELP - GEO
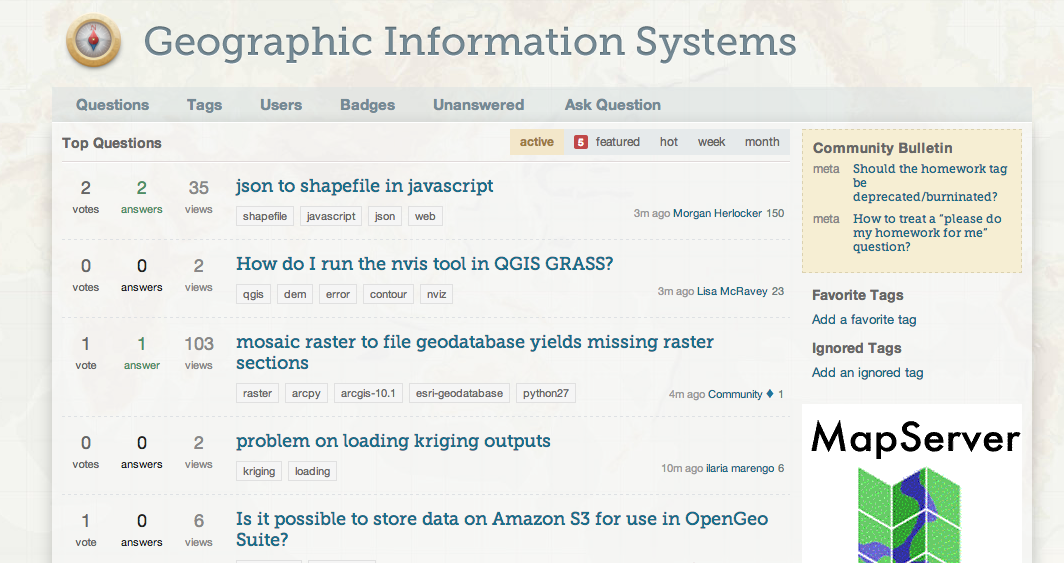
http://gis.stackexchange.com
WHERE TO GET HELP - DATA
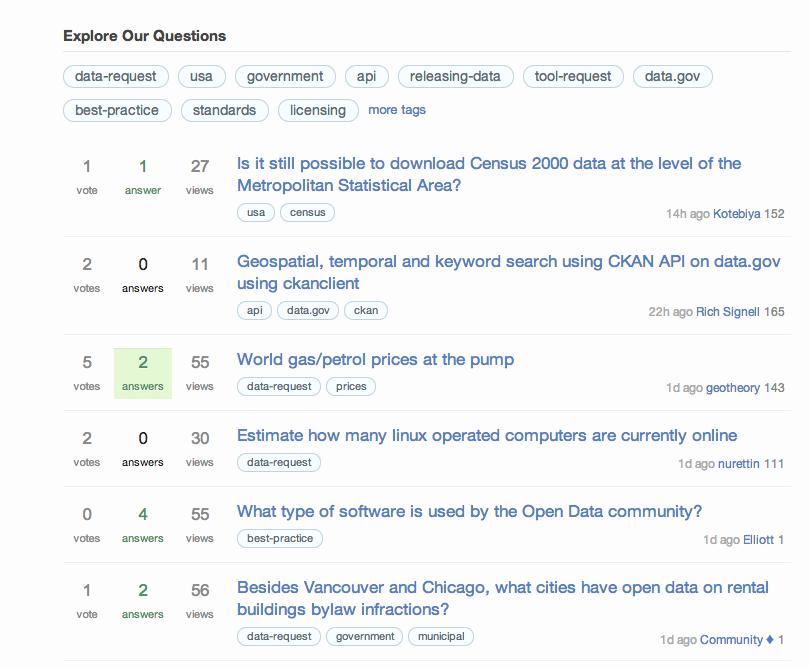
http://opendata.stackexchange.org
ANy QUESTIONS?
Slides made with:
http://slid.es
http://slid.es
Projection slides by Dimi Sztanko:
http://twitter.com/sztanko
Me:
http://anna.ps
http://anna.ps
http://twitter.com/darkgreener
DRINKS!
PS: Work for mySociety.org (MaPit):
http://mysocietyltd.theresumator.com
web developers + events officer
Sync Norwich
By annaps


