Experiences from the 2015 Nepal Earthquake.
Arogya Koirala
Kathmandu Living Labs
3 December, 2018
What we do:
Bring people, data, and technology together
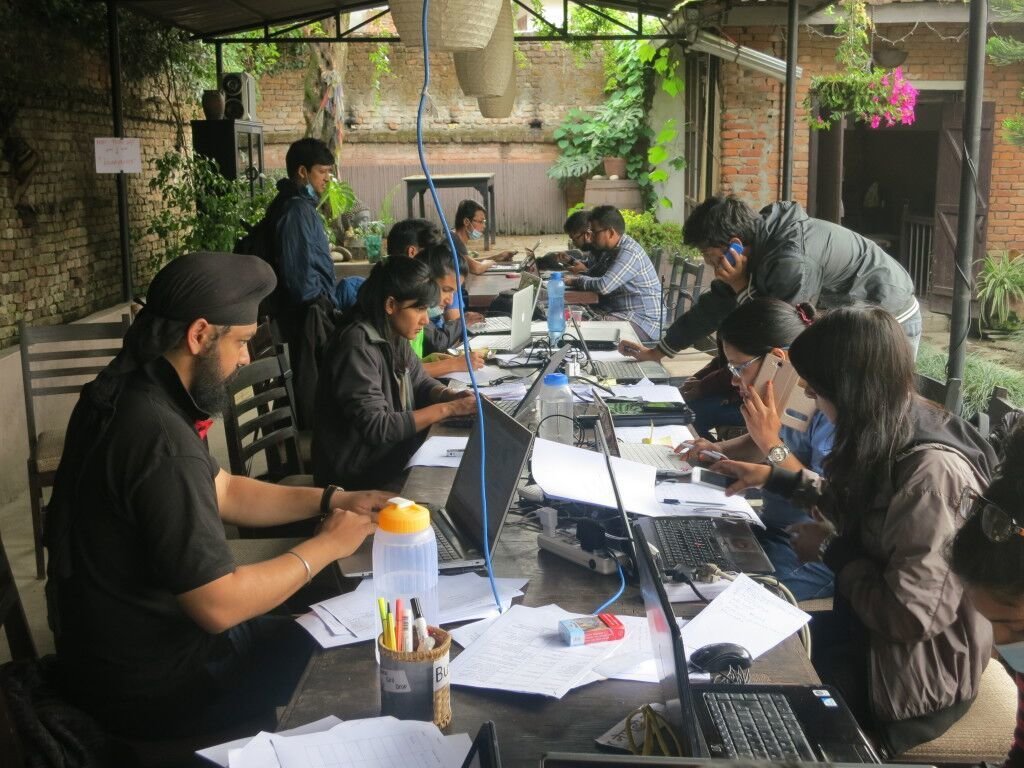
Ground level coordination:
8000+ Volunteers.
150,000 + edits.
10x increase in data size.
The OpenStreetMap Community.
Using satellite imagery and the help of the to rapidly map roads, buildings and more.


....[this] network of human sensors has over 6 billion components, each an intelligent synthesizer and interpreter of local information.
- Michael Goodchild (2007)
Citizens as sensors
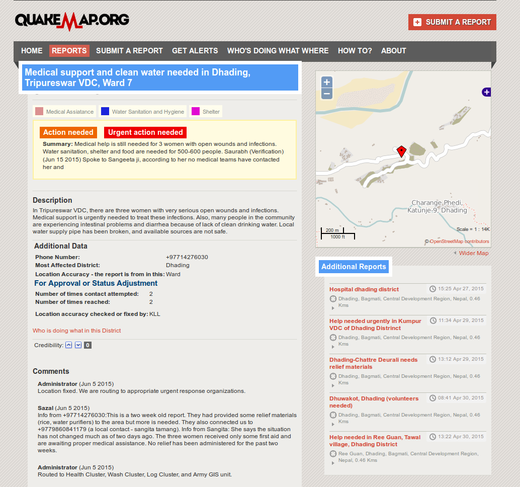
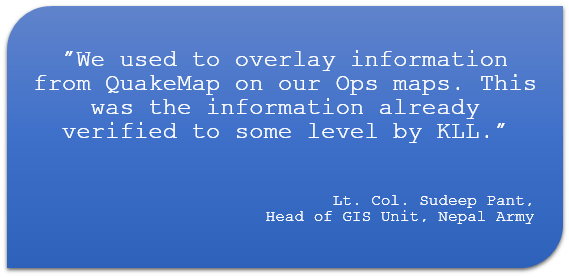
Quake Map.
Crowd-sourcing to bridge the information gap between rescue workers and people in need.

Time of crisis = No time for designing from scratch.
Pre-existing platform = Reduced development times.
Focus on deployment (mobilizing volunteers and coordinating with relief agencies) from the outset.
National Housing Reconstruction Survey
Assessing building damage, and socio-economic impact of the 2015 EQ using mobile data collection technology.


Goal: Identify beneficiaries and disburse of grants
Need to assess ground reality.
Time sensitive.
Highly ambitious.
31 districts. 5 million+ people. 1 million+ building.
Opportunity.
Building damage + socio-economic data during the inter-census period.
Challenge #1: Scale.
7 government and non-government organisations.
2500 engineers to be deployed.
11 districts.
1 million buildings.
Less than 3 months.
Challenge #2: Poor Connectivity
Completely offline.
Image compression.
Send images and text-seperately.
One of the largest mobile-based data-collection efforts ever.
Adapt, not build.

100 days. 11 severely affected districts. 762,106 households. 3,677,173 individuals.
Mid-term census.
2015 Earthquake Data Portal
Making damage assessment and socio-economic data accessible to all.

Thank you.
arogyakoirala@gmail.com
PARIS21 CRF - Experience sharing
By Arogya Koirala


