Creation and Implementation
The collaboration between Design and UX development
DockYard
Amanda Cheung, Lead UX Developer
Ashley Treni, UX Designer
Data Visualization

Tonight’s Agenda:
- Presentation
- Design and Development considerations
- Collaborative techniques
- Recap
- Case study
- Workshop
- Our solution
Design Considerations
Creating a data visualization

Data visualization
Diagram by Ben Fry
- Visualization form
- Context (interactive web visualization)
- Interaction types
- Presentation techniques (framing information)
Considerations:


Networks
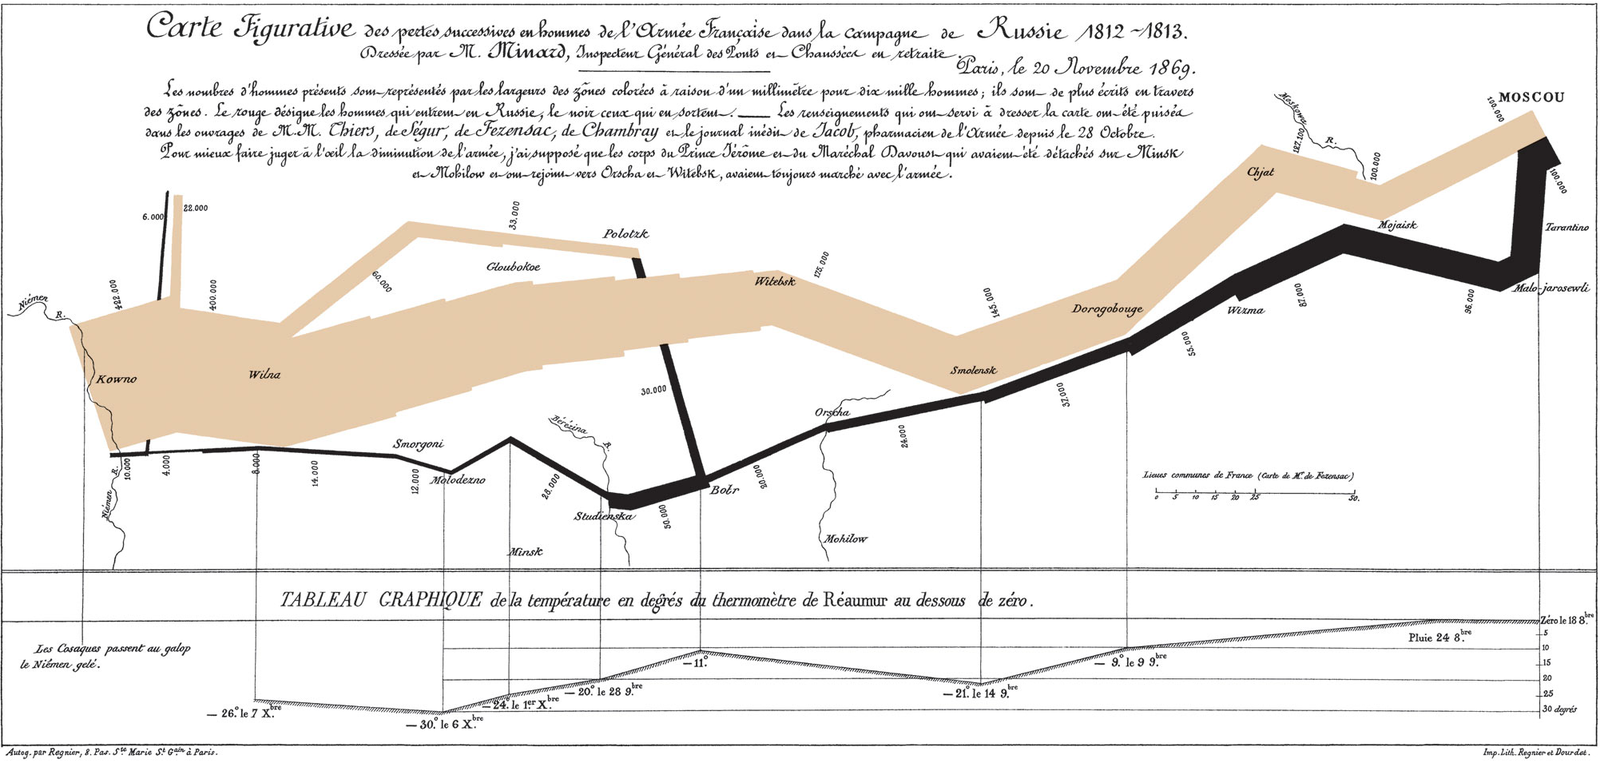
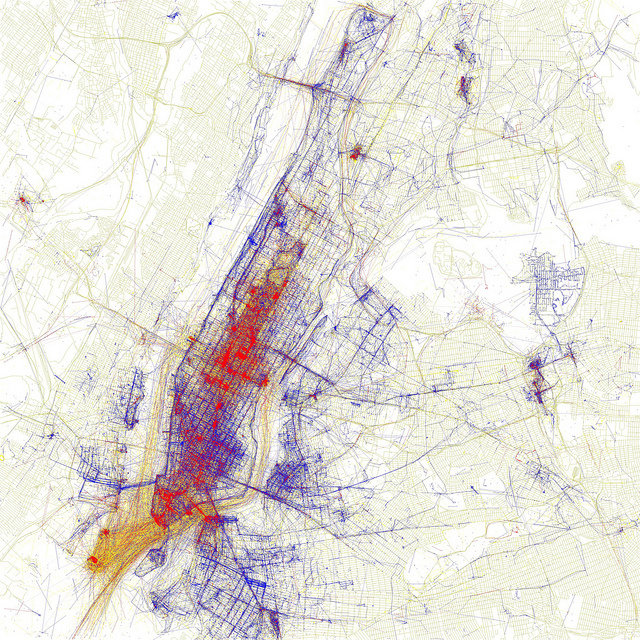
Maps
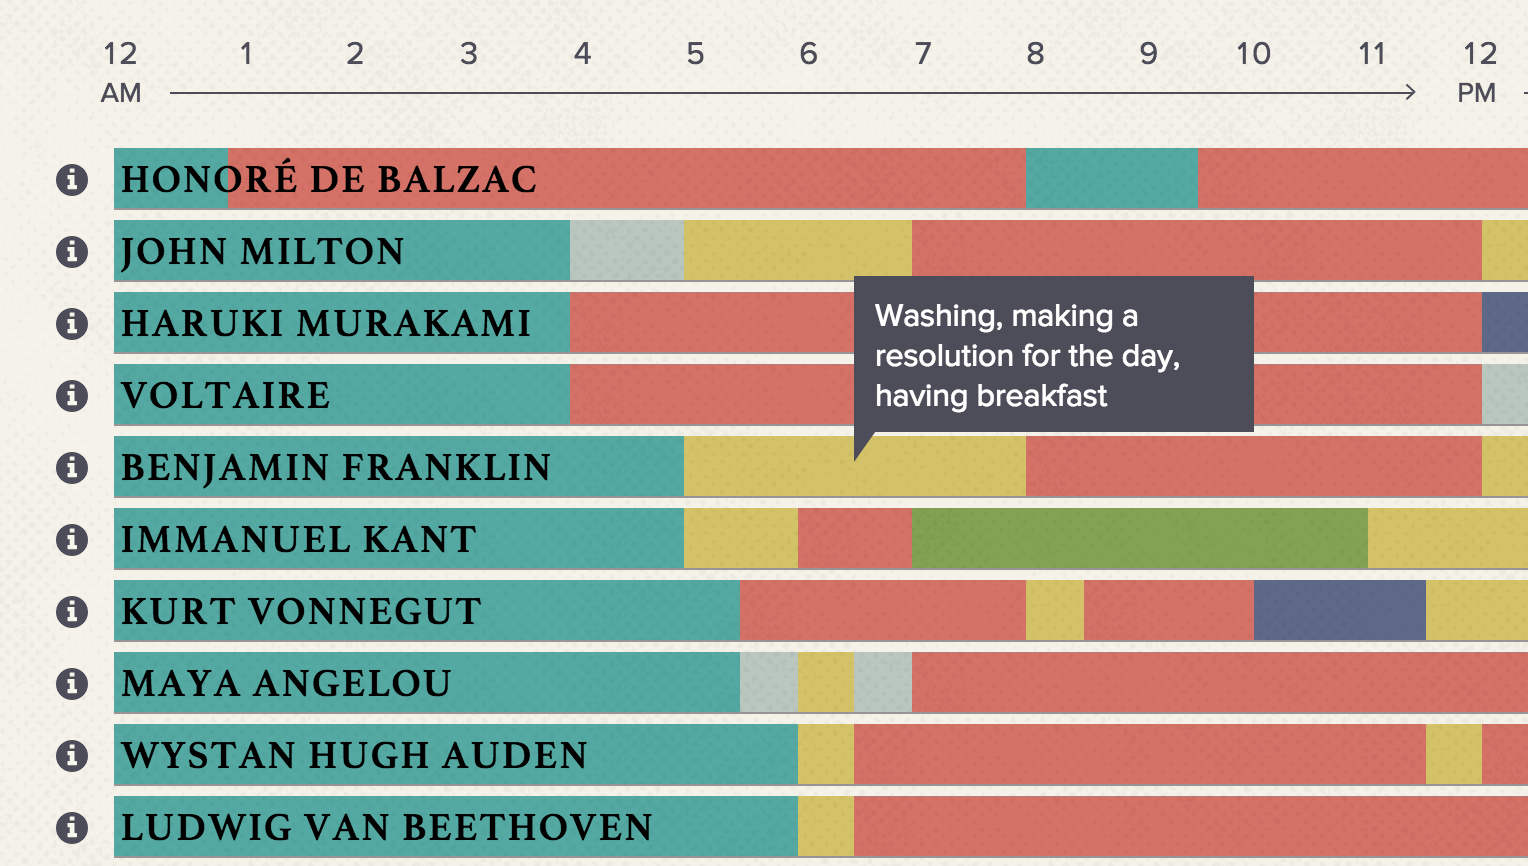
Timelines
Trees
Graphs
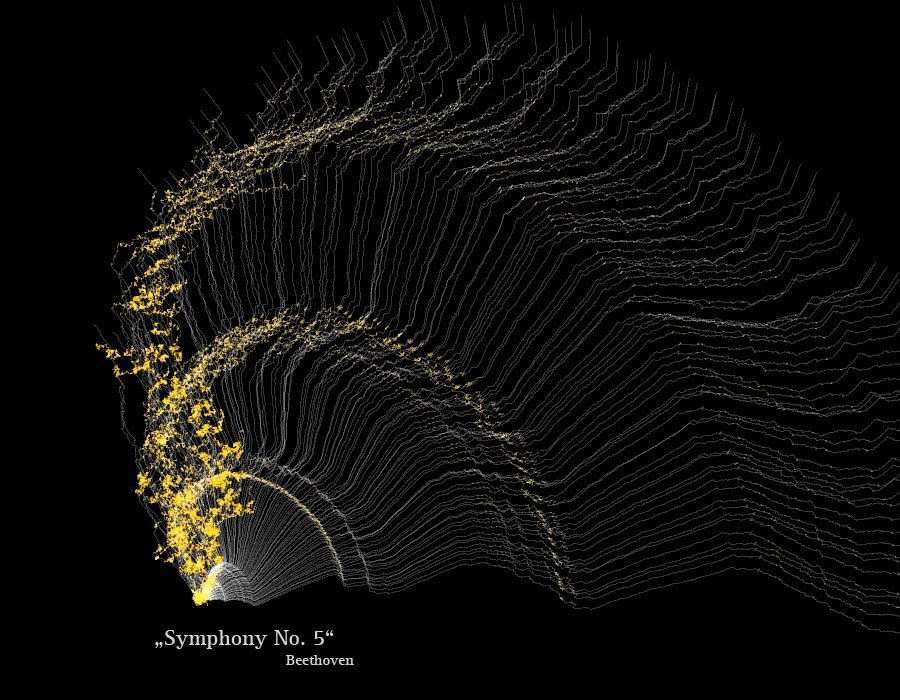
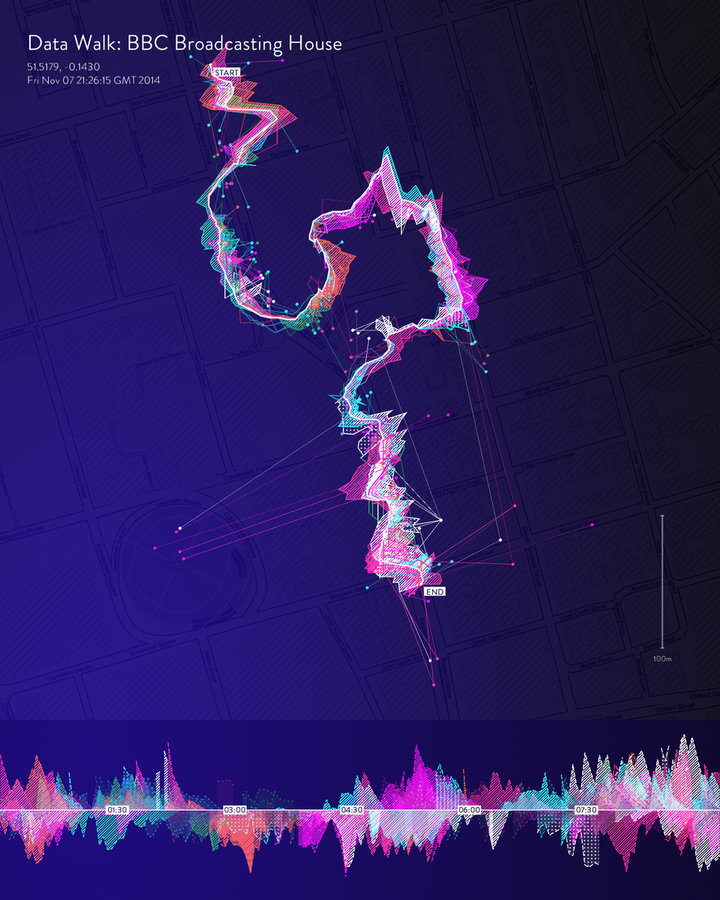
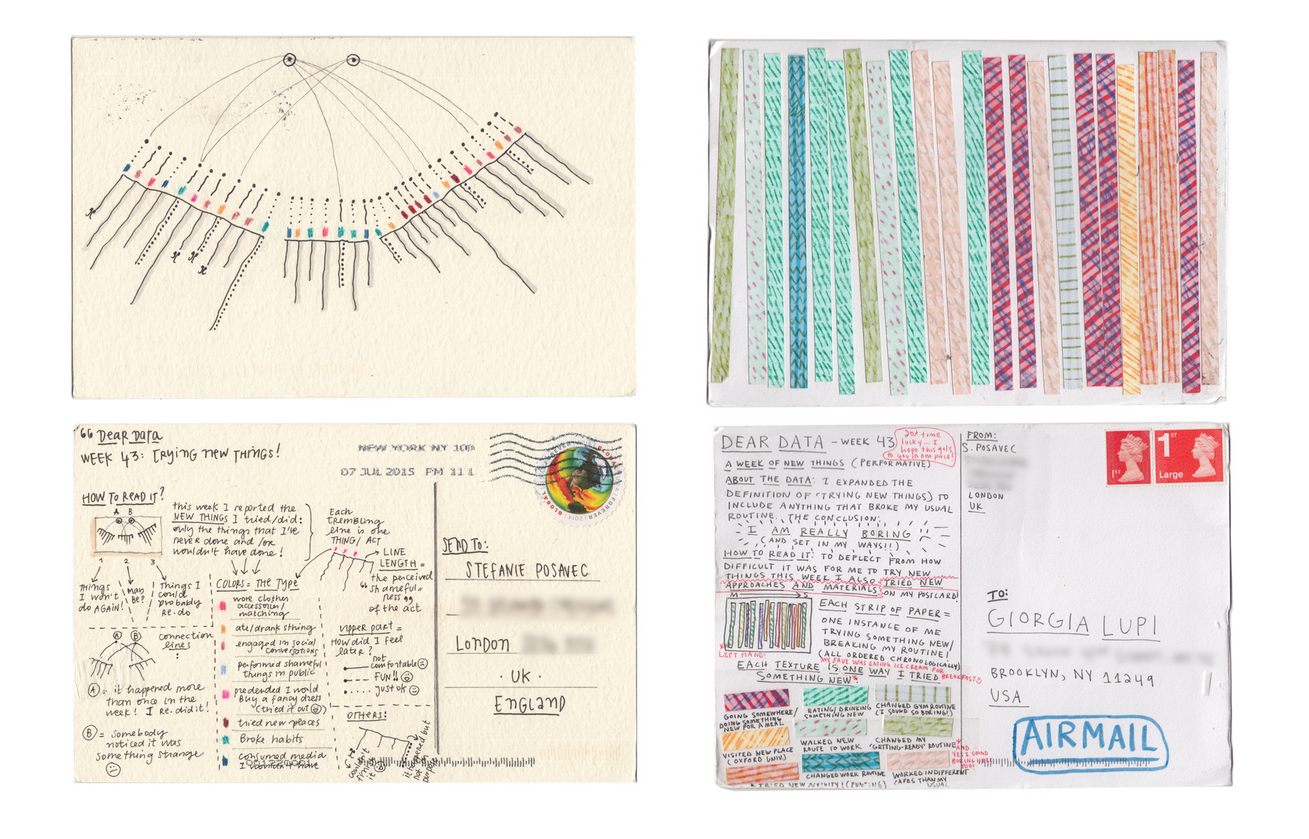
Visualization Forms

Inventing abstraction - MoMA

How the United States generates electricity - Washington Post

What's really warming the world? - Bloomberg

Newsmap.js

Development considerations
Implementing a data visualization
Considerations:
- Performance
- Accessibility
- Responsive web design
- Maintainability
“Designers are in a unique position to impact overall page load time and perceived performance. The decisions that are made during the design process have an enormous impact on the end result of a site.”

Speed to load

Performant user interactions
Click, hover, scroll, etc.
Interaction: Select to Redisplay
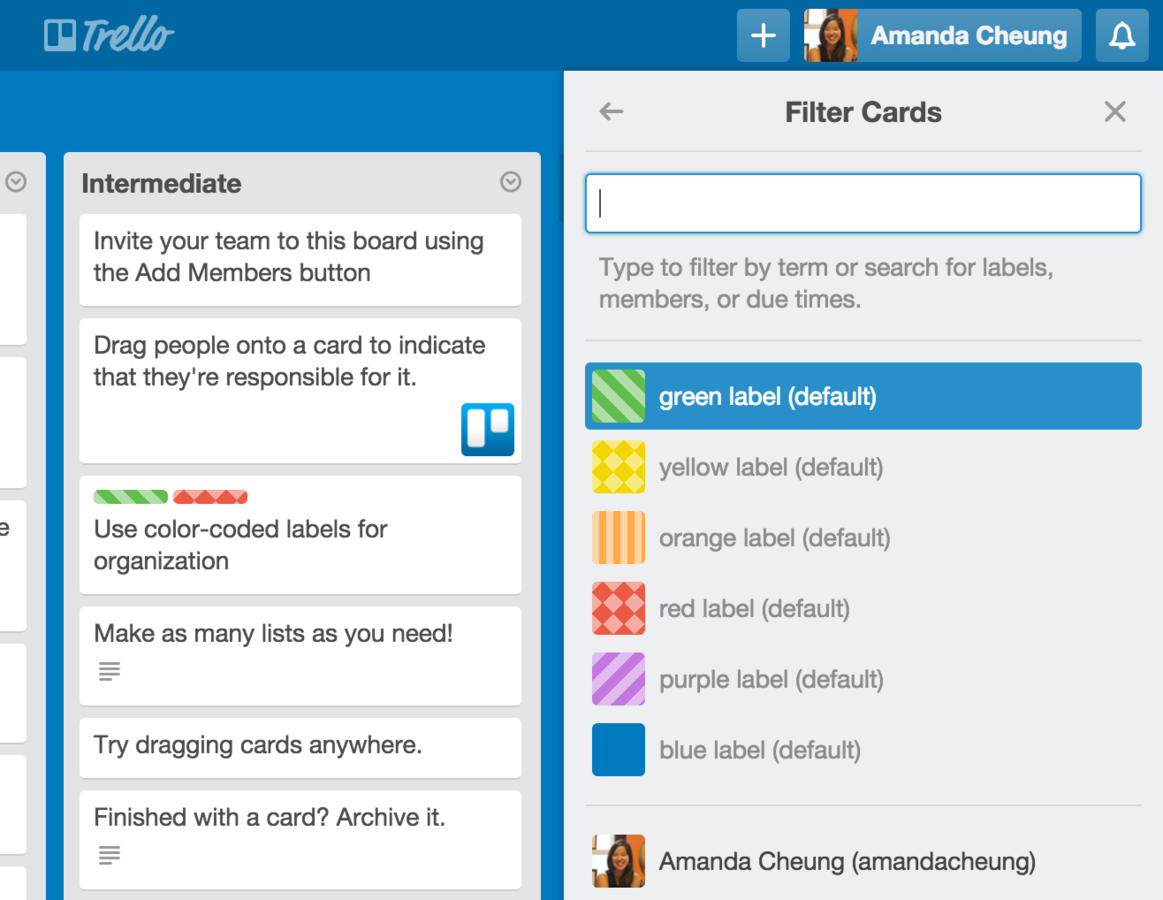
Accessibility
Visual
Motor
Auditory
Cognitive


Table alternative?
Color Vision Deficiency


Trello’s color blind friendly mode

Interaction: Click + Animation
Presentation: Isolated Views
Responsive web design


Flexible dimensions
Hover vs. Click

Maintainability

Code bloat:
- Number of colors
- Repeatable components / interactions
- Ease of implementation
- Responsive web design media queries changes
- Style guide
Let’s connect the two
How design maps to development considerations


Collaboration
Communication strategies and methods
Designer
Developer
Discovery & Design
Development
Points of collaboration
Start of project
Check-ins
Transition
Quality Assurance
Check-ins:
During discovery and design phase
- Sketches
- Wireframes
- Demos
- Research & prototype unknowns
Meet ~once a week
Design heavy, dev light
Sketches

Wireframes

Demos:
Transition:
Design near completion. Preparing handoff. The most overlap happens here!
- Annotated designs
- Documentation
- Prototypes
- Review all comps
- Come up with a list of questions
Meet for long periods
Design heavy, dev heavy
Annotated designs
List of questions

Quality Assurance:
During development phase after each feature completion. Ensure expected user experience
- In-browser demo
Meet ~once a week
Dev heavy, design light
Recap
- Design impacts development
- Problem solve together to arrive at the best solutions
- Both work together to arrive at better user experiences
Workshop
Case study

Target Audience:
Major Variable:
Visualization form:
Context:
Internal tool for research team at the NY Philharmonic
Event types, Seasons
Timeline, Graph
Interactive web visualization


Tasks
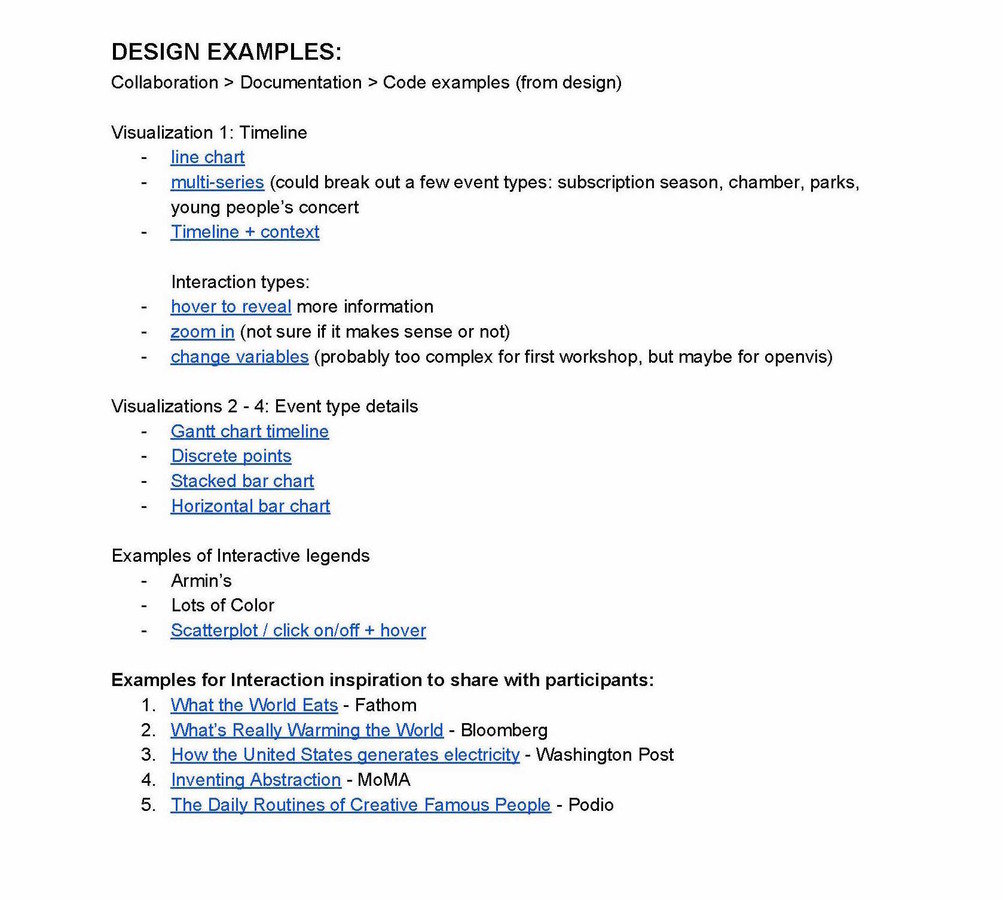
- Annotate Visualization
- Find examples of interactions
- Consider responsive layout
- Prepare conversation with UX development
Workshop time!
Break into groups
Pass out handouts/templates/visualizations
- What the World Eats - Fathom
- What’s Really Warming the World - Bloomberg
- How the United States generates electricity - Washington Post
- Inventing Abstraction - MoMA
- The Daily Routines of Creative Famous People - Podio
Interactive visualizations for inspiration:
Documentation resource - http://bit.ly/1nc87cq
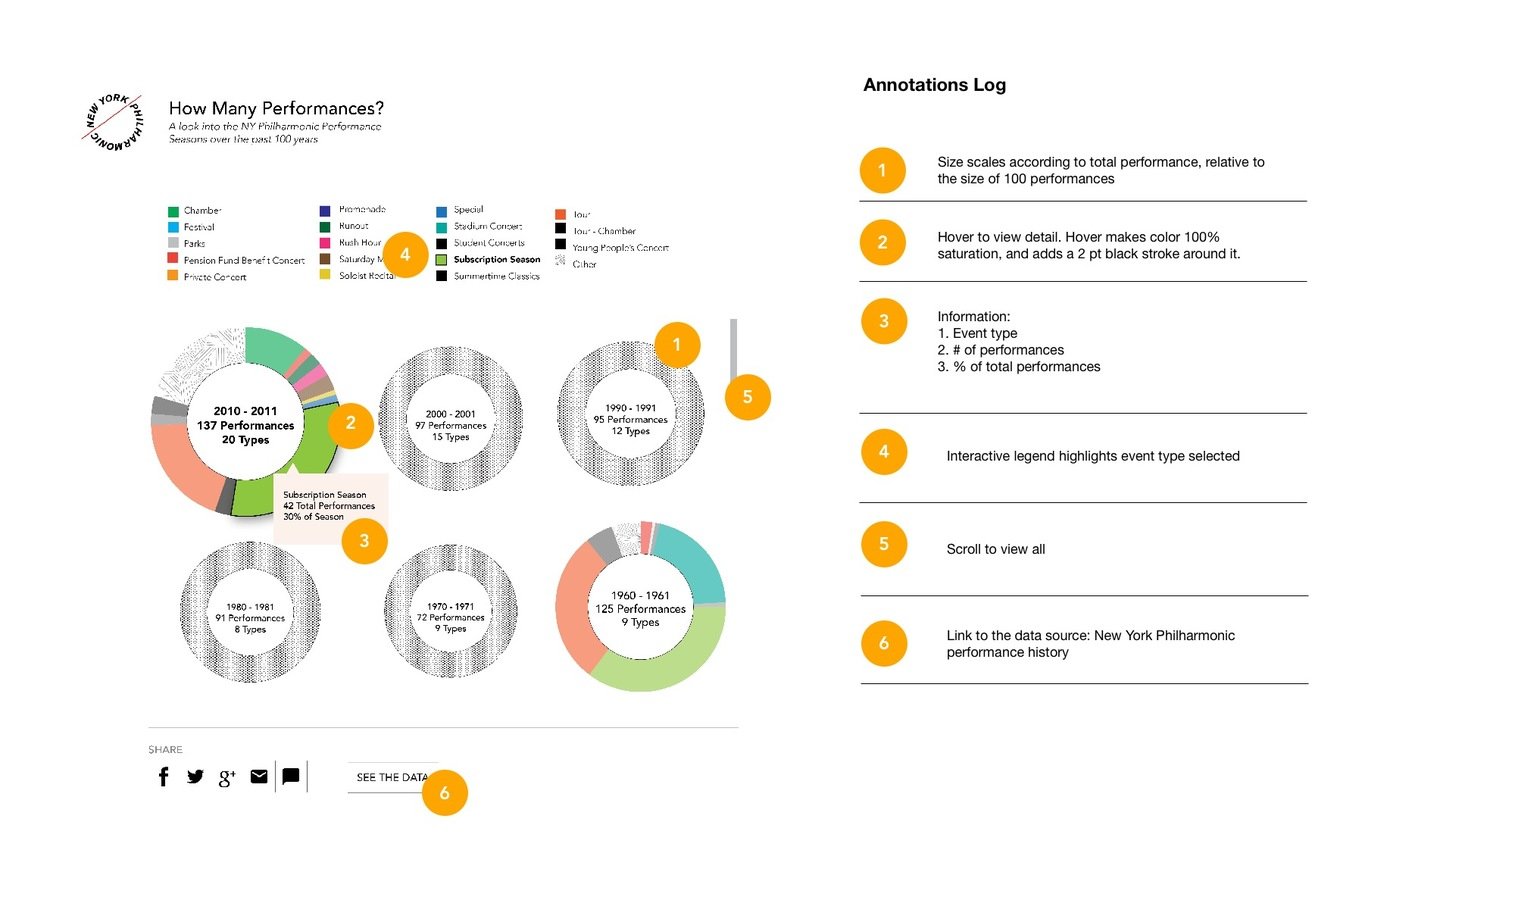
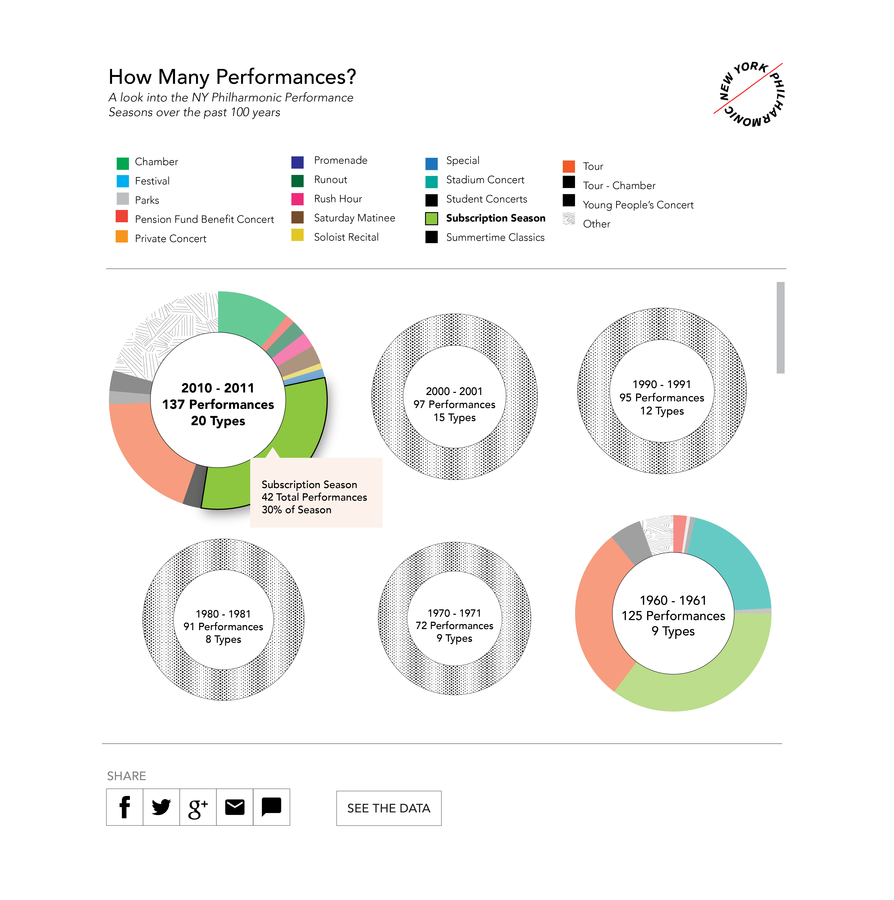
Our solution:
- Final visualization
- Review our process, wireframes and documentation
- Go over decisions that were made
- See our implementation

Examples to facilitate discussion
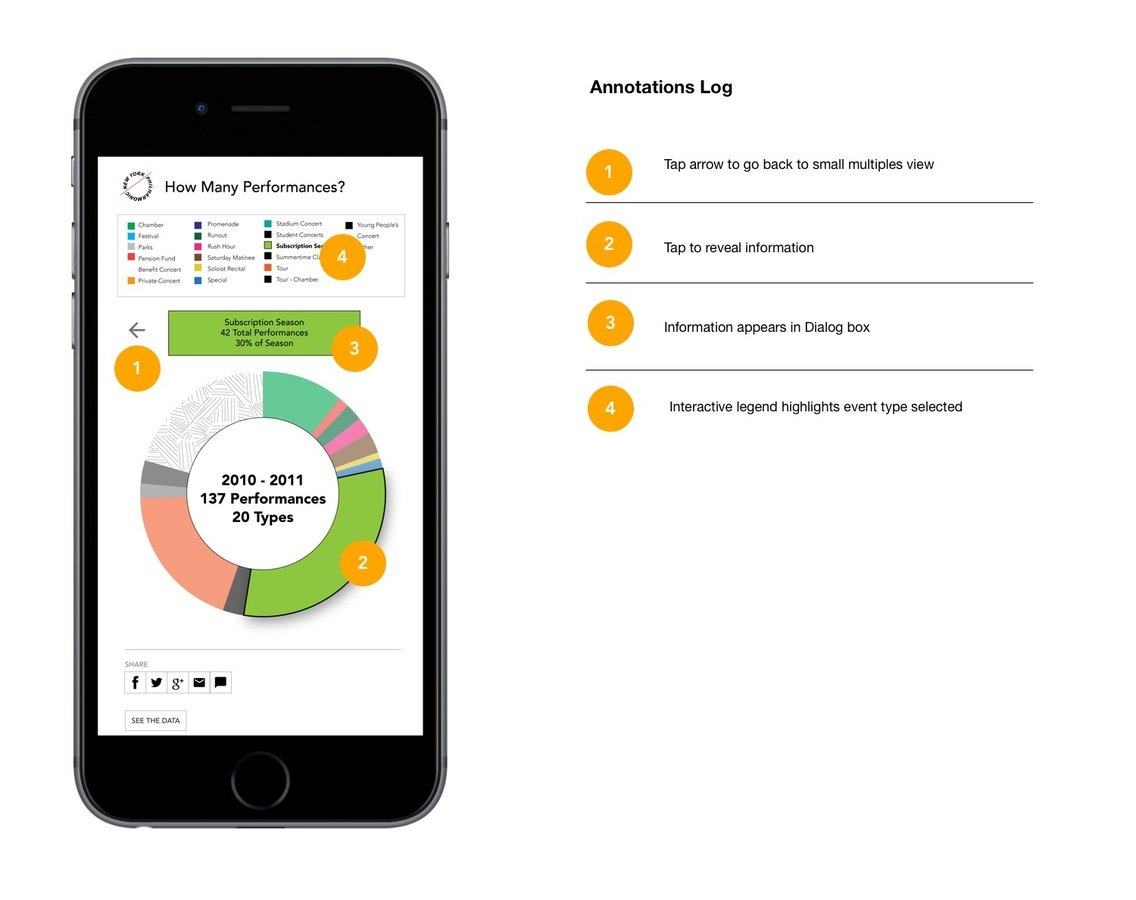
Design with annotations
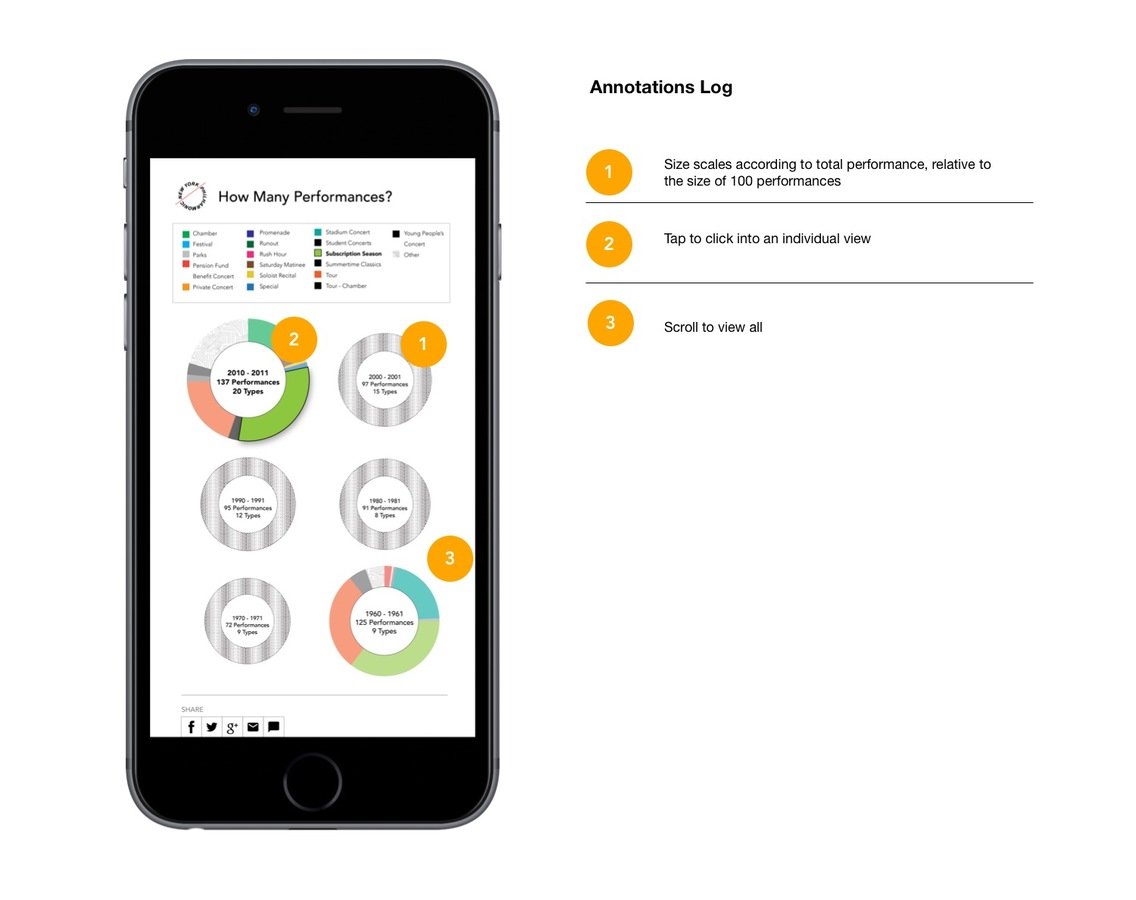
Design with annotations
Performance:
Use SVG, performant interactions, don't use javascript to watch scroll or mouse position
Responsive:
Flexible height and width, future devices, ideal touchscreen target sizes
Accessibility:
Separate table so all information can be seen without interaction, arrow keys for navigation, hover/focus states, url
Maintainability:
Can increase and decrease number of event types
Creation and Implementation
By atreni
Creation and Implementation
by Ashley Treni & Amanda Cheung
