Images of Knowledge (?) / Milestones of Graphic Presentation of Data in Hungary

Attila Bátorfy, ELTE MMI/Átló
Kőszeg, Institute of Advanced Studies


The scope
visual representations carrying information
numbers
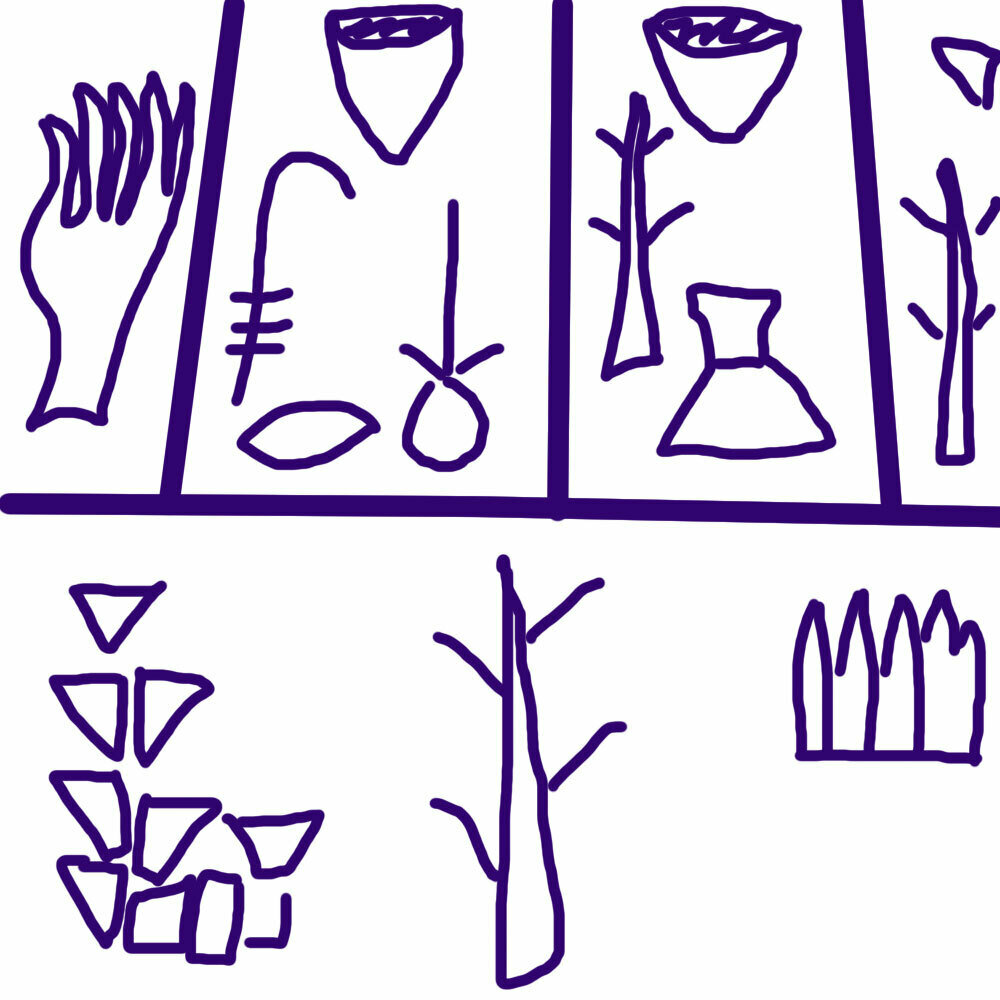
pictographs
script
fonetic script
hieroglyphs
tokens
informational images
pictograms
tables
signs
diagrams
information graphics
data graphics
infographics
statistical diagrams
visualizations
scientific imagery
logical diagrams
statistical/mathematical diagrams
"normal" map
data map

i.e. 40 000k.
Szváziföld
rovátka

i.e. 3300k.
Mezopotámia
tokenek

520k.
Porfiriosz/Boethius
fastruktúra

950k.
Ismeretlen
vonaldiagram
1350k.
Nicole Oresme
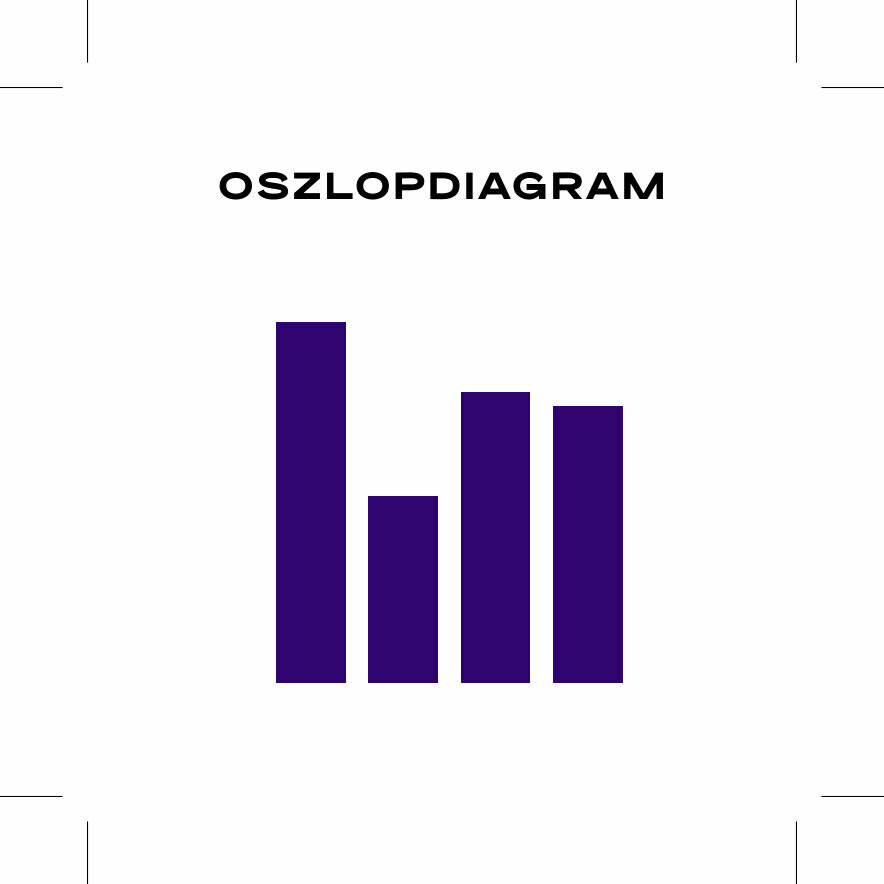
oszlopdiagram
1644
Michael van Langren
statisztikai diagram
1685
Robert Plot
az első grafikon
1721
Athanasius Kircher?
modern oszlopdiagram
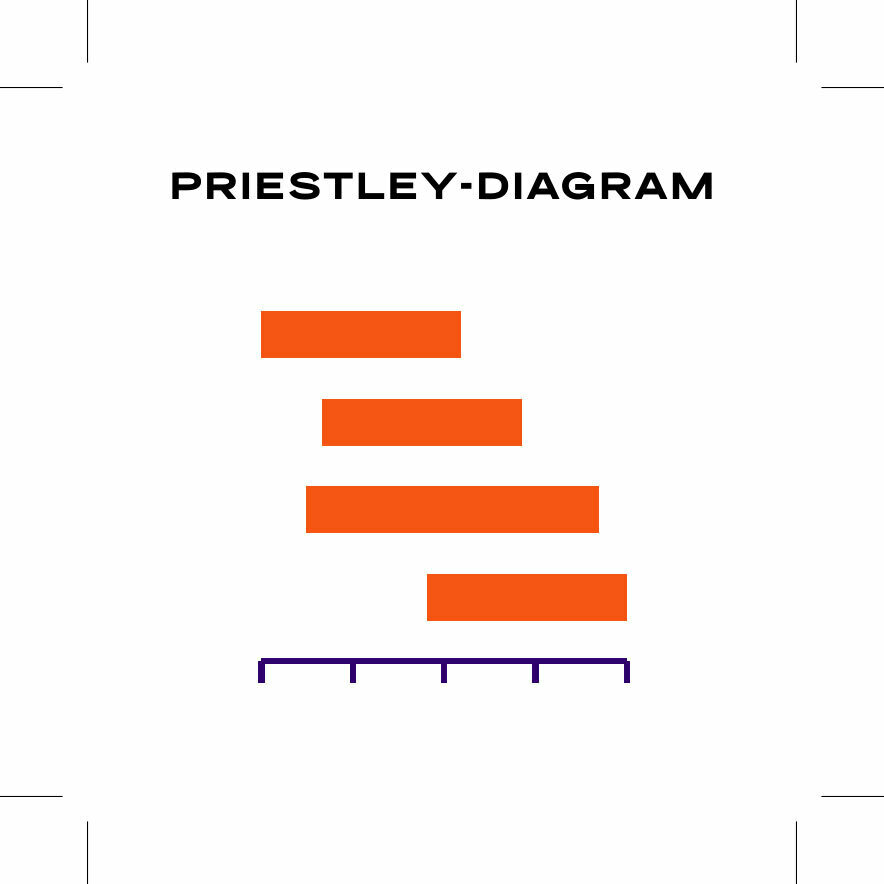
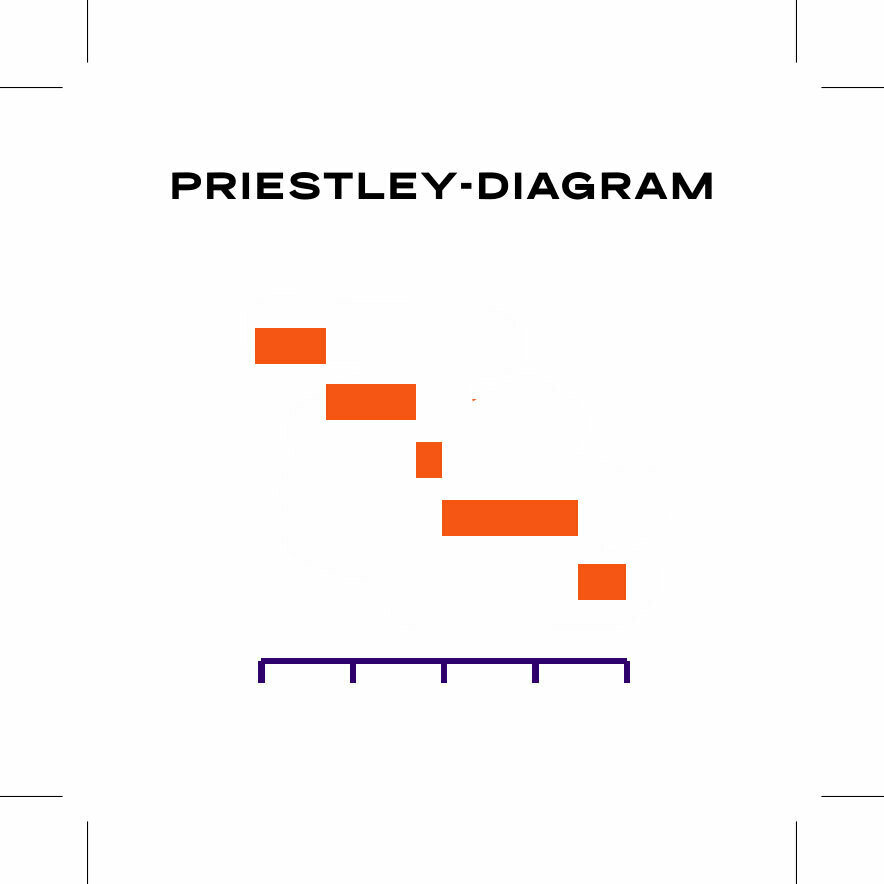
1765
Joseph Priestley
idővonal
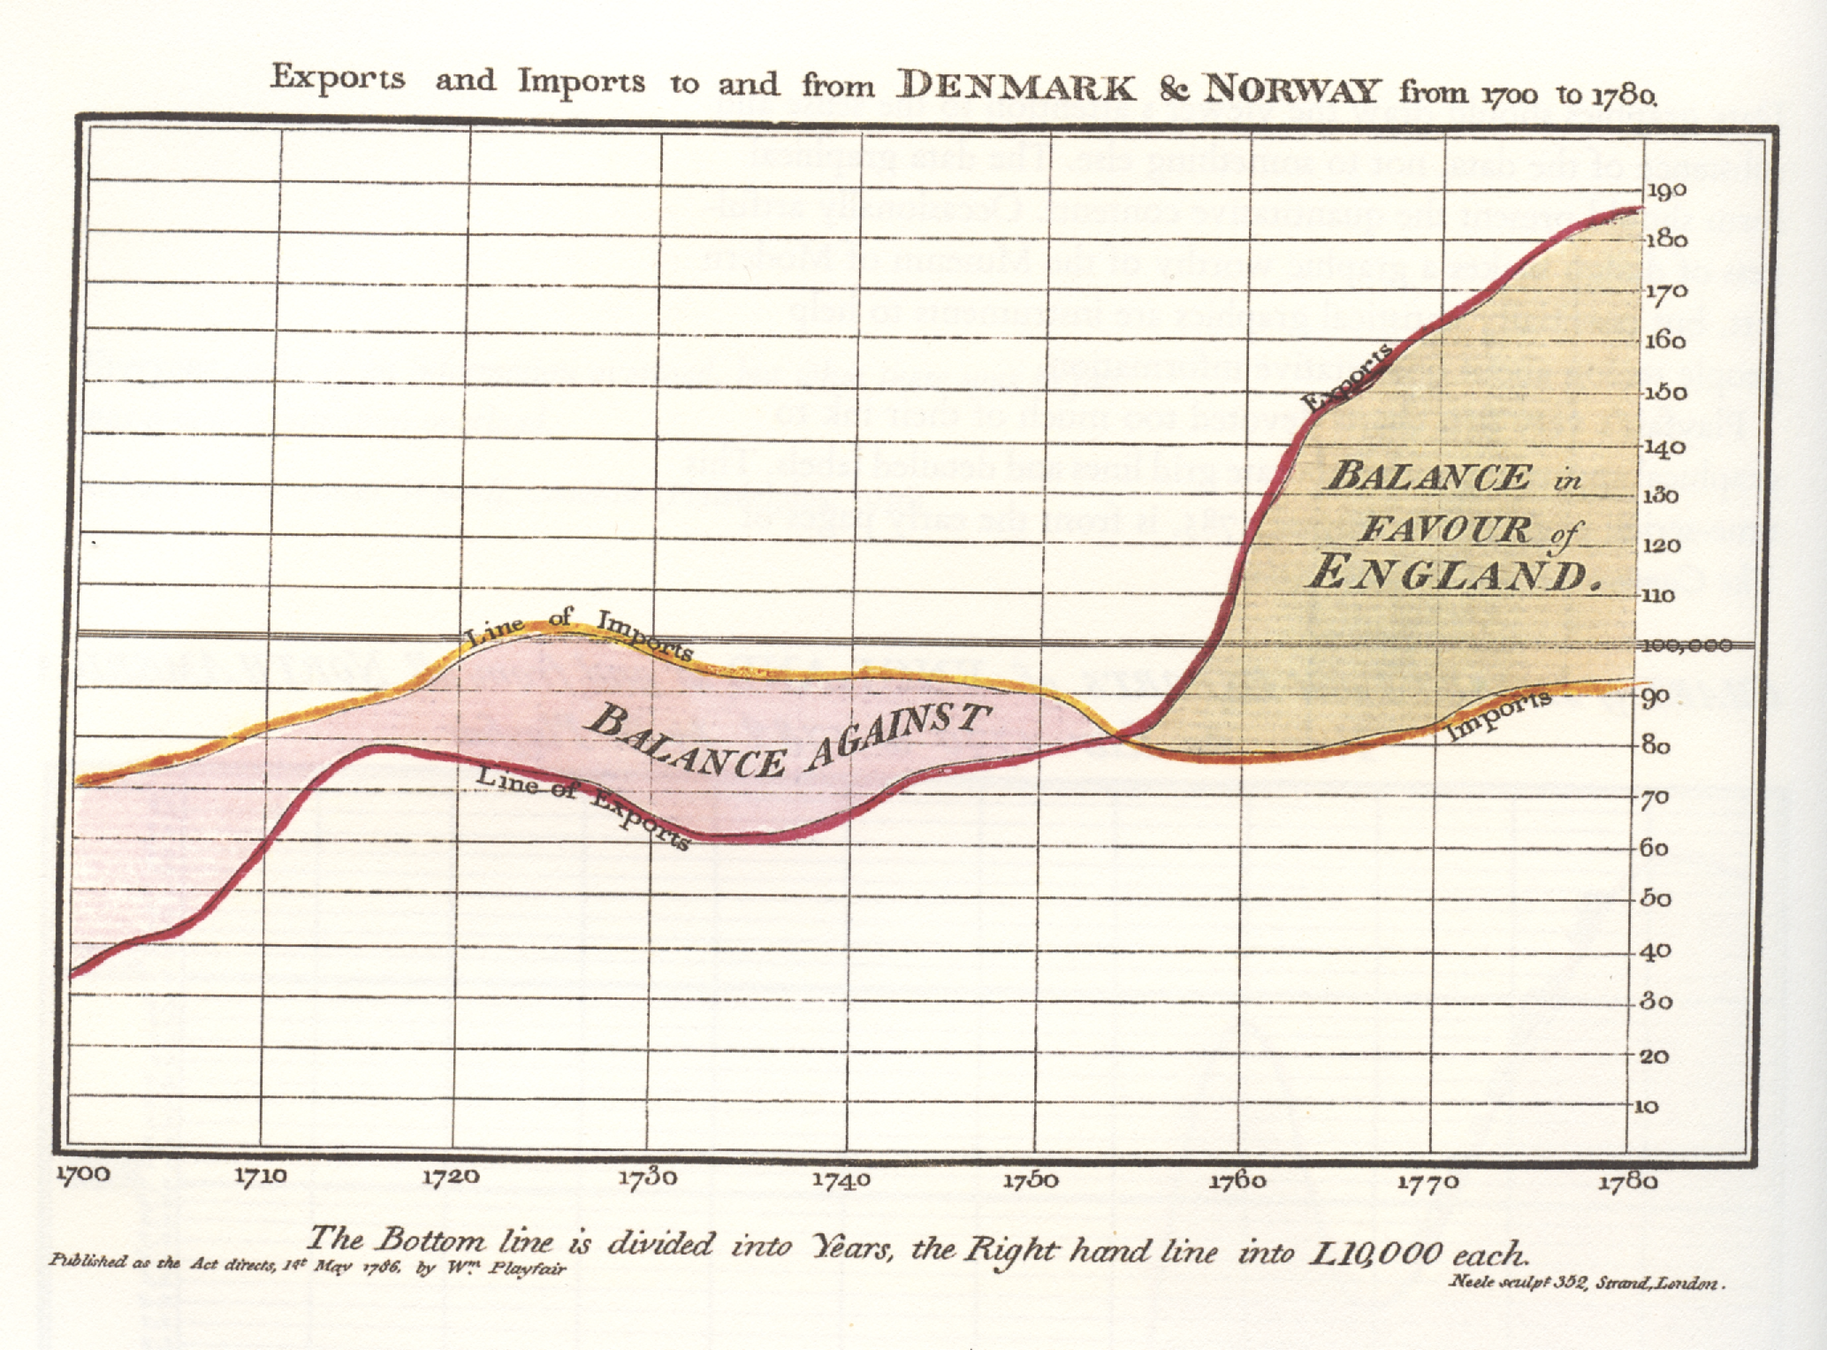
1786
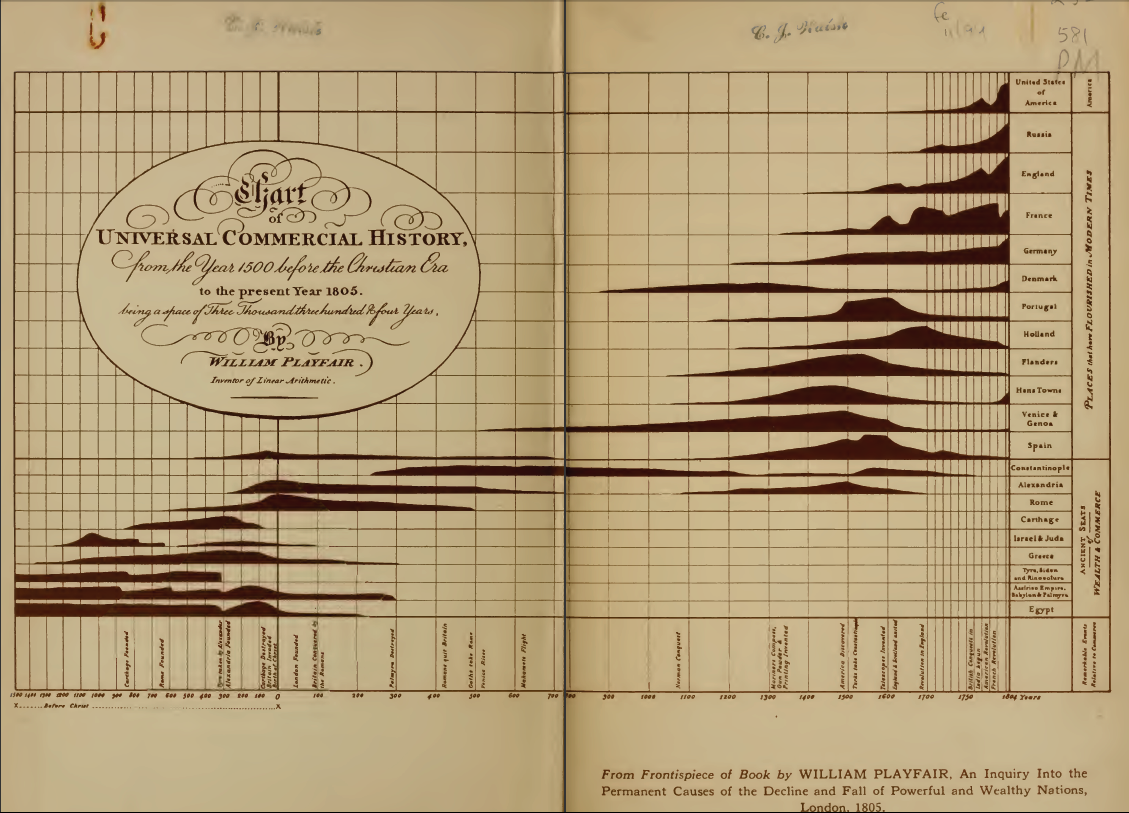
William Playfair
felületdiagram
1786
William Playfair
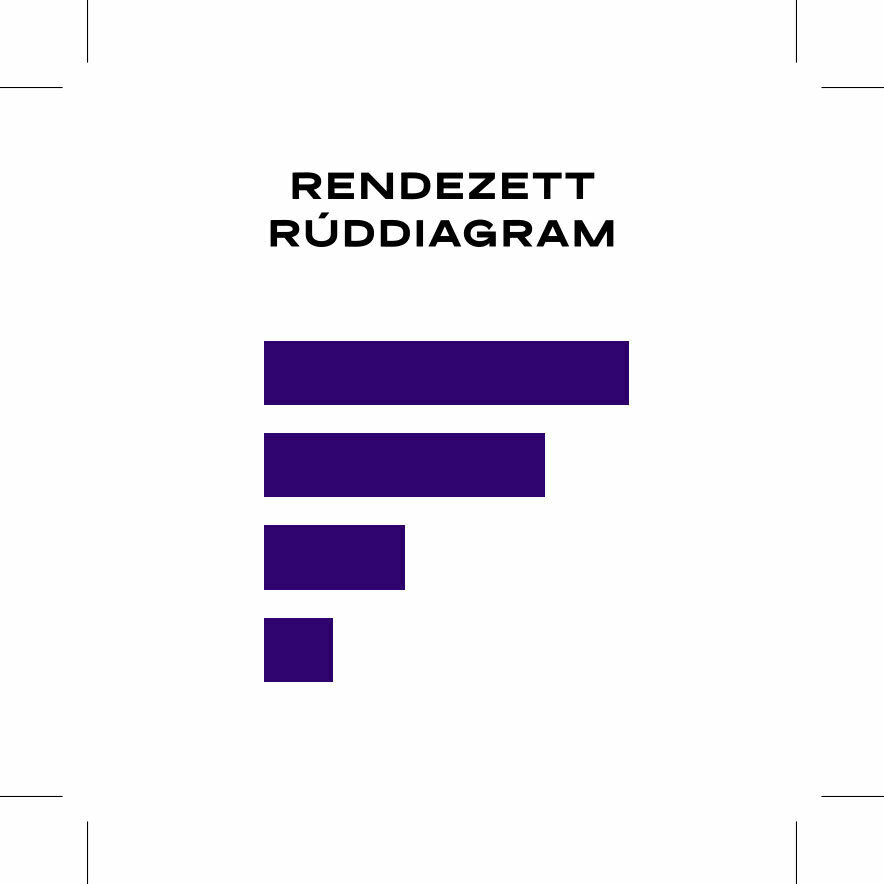
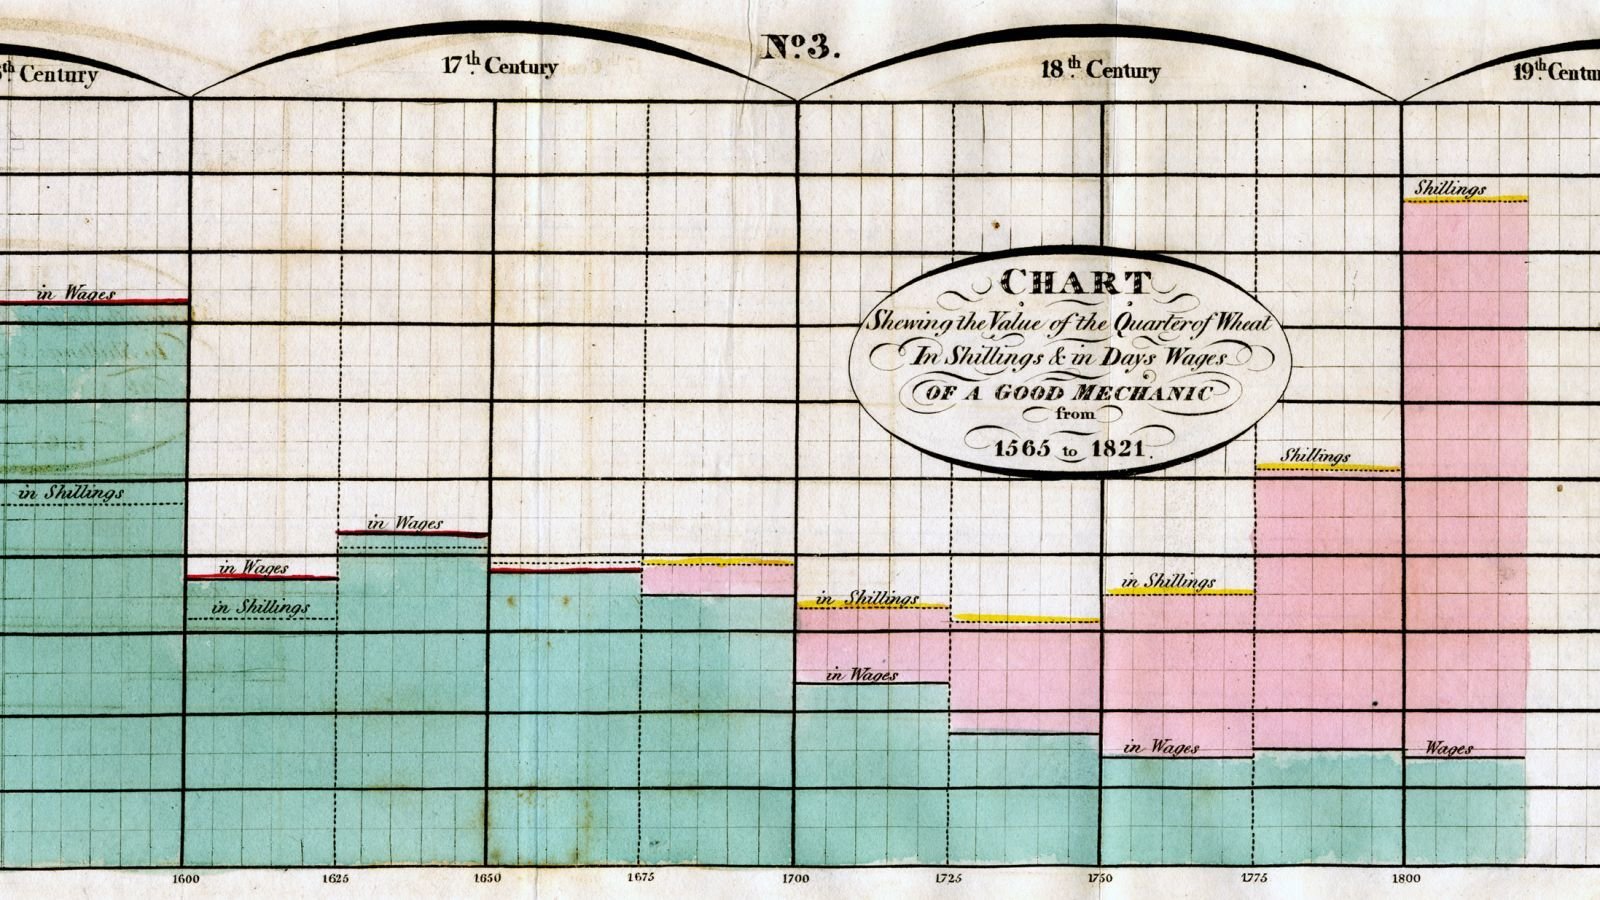
rúddiagram

1829
André-Michel Guerry
rózsadiagram
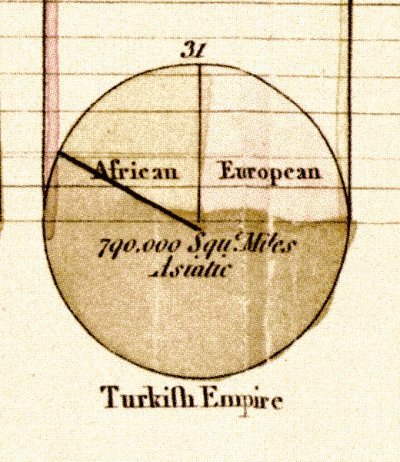
1801
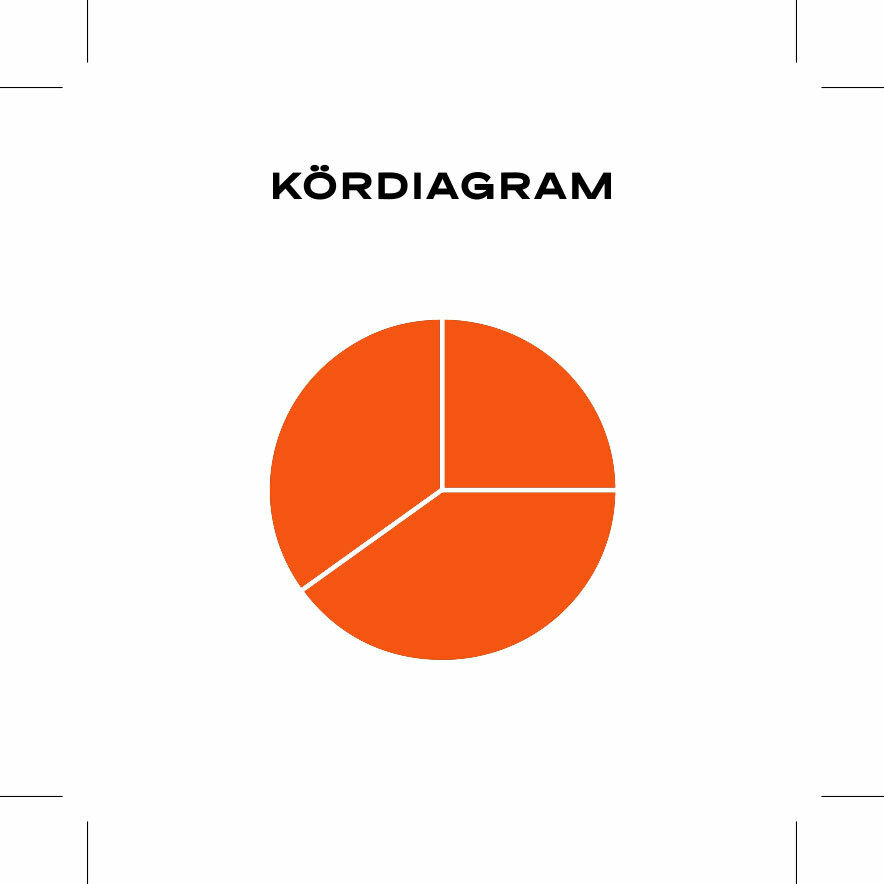
William Playfair
kördiagram
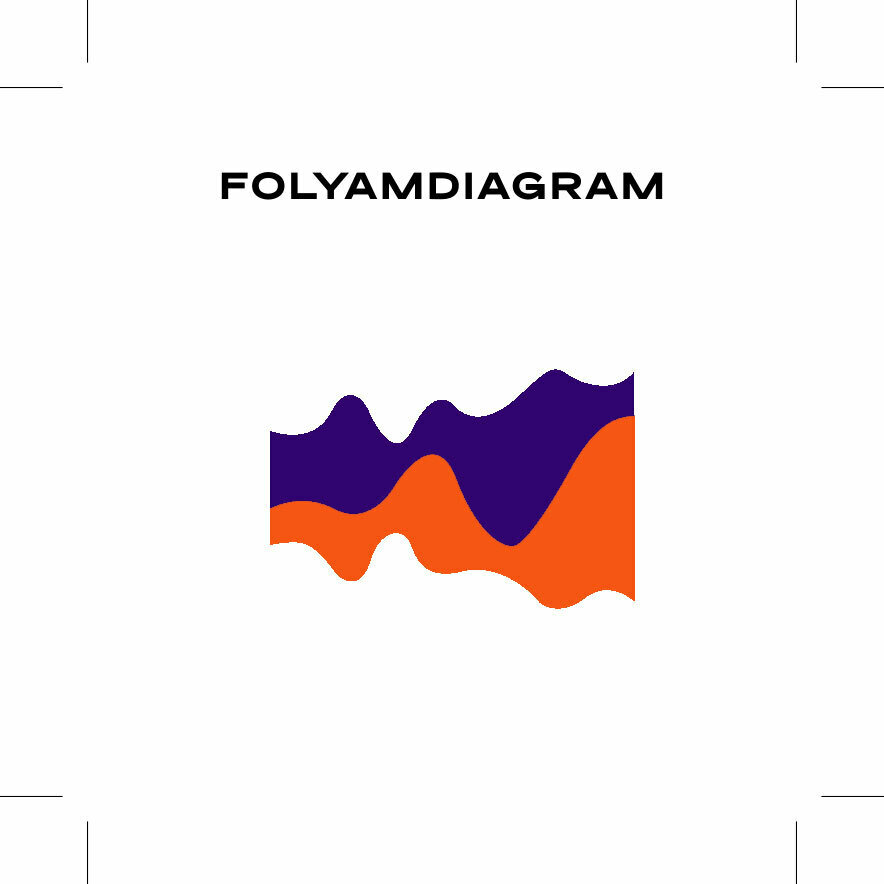
1786
William Playfair
folyamdiagram

i.e. 3100k.
Mezopotámia
piktogramok
1782
Charles de Fourcroy
négyzetosztás
1770
Philippe Buache
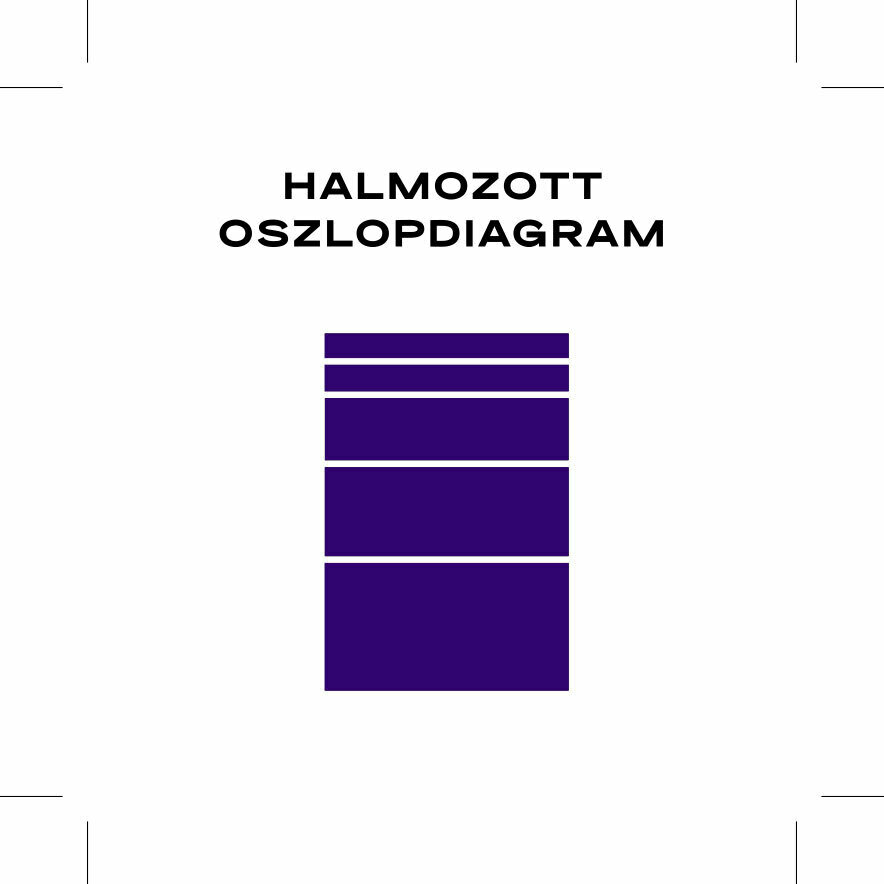
halmozott oszlop

1844
Charles-Joseph Minard
Marimekko-diagram
1877
Georg von Mayr
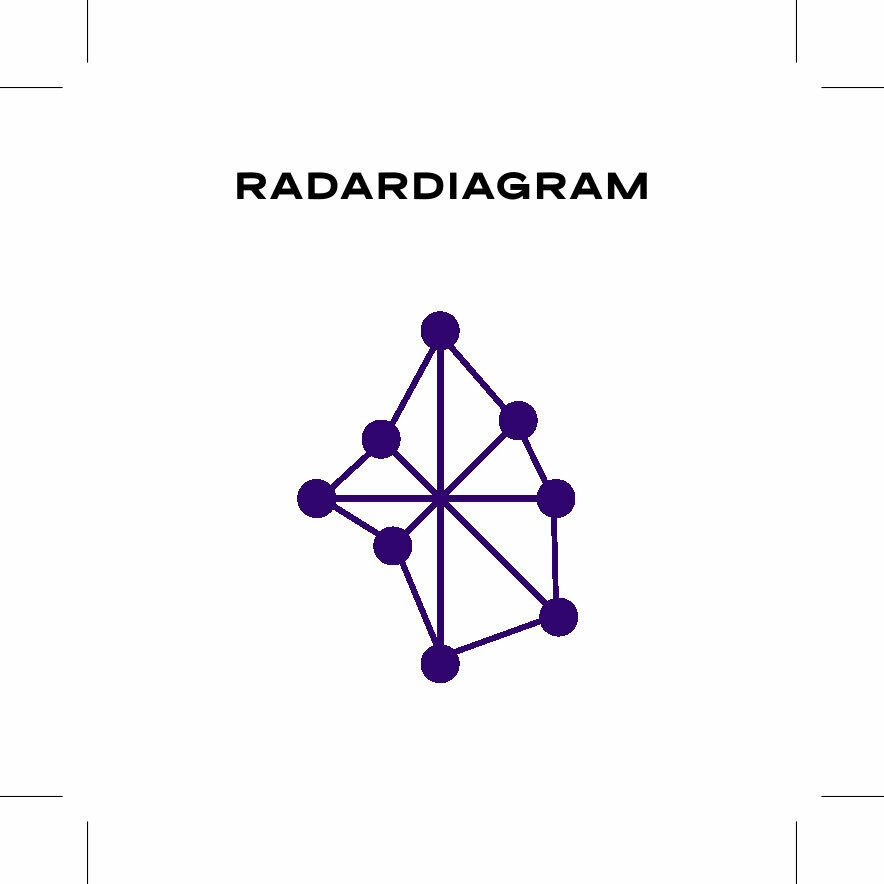
radardiagram
1886
Francis Galton
pontdiagram
1889
Matthey Henry Sankey
Sankey-diagram
1877
Georg von Mayr
területdiagram
1873
Touissant Loua
hőtérkép
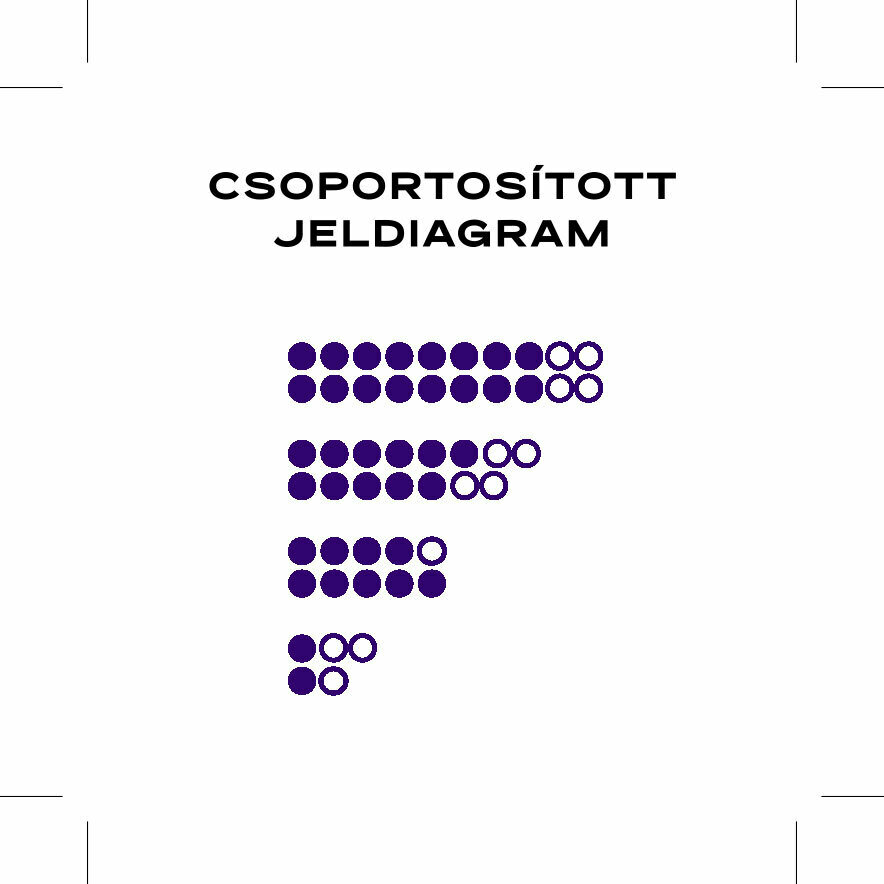
1914
Willard C. Brinton
jeldiagram
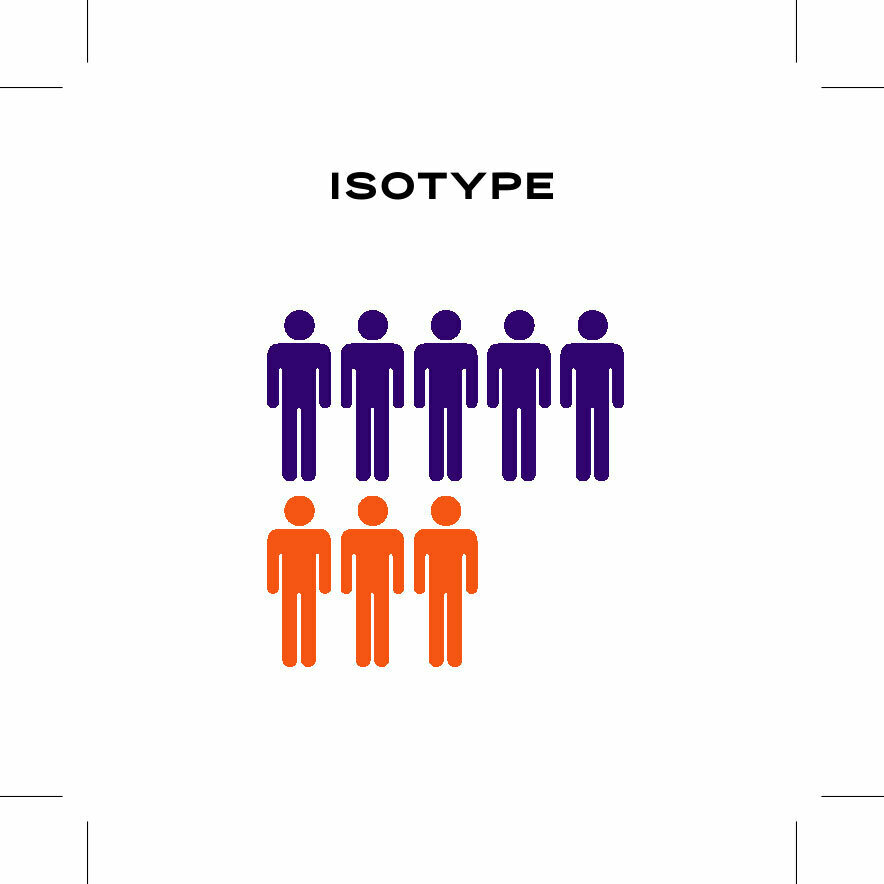
1925
Otto és Marie Neurath
ISOTYPE

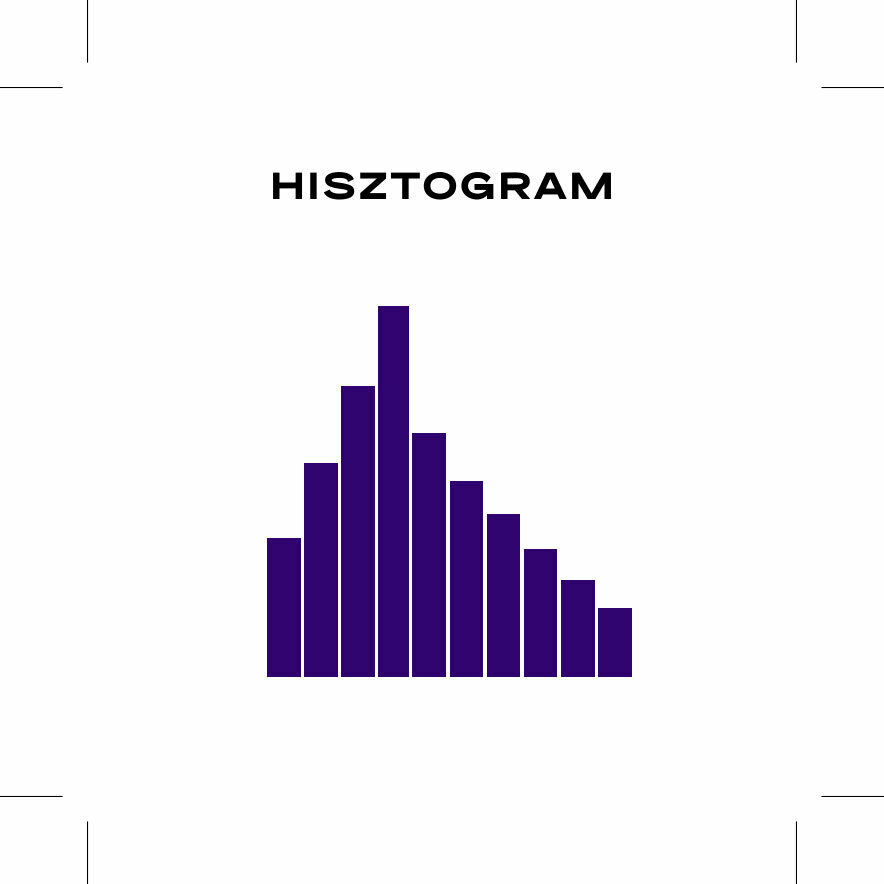
1895
Karl Pearson
hisztogram
1934
Jacob Moreno
szociogram
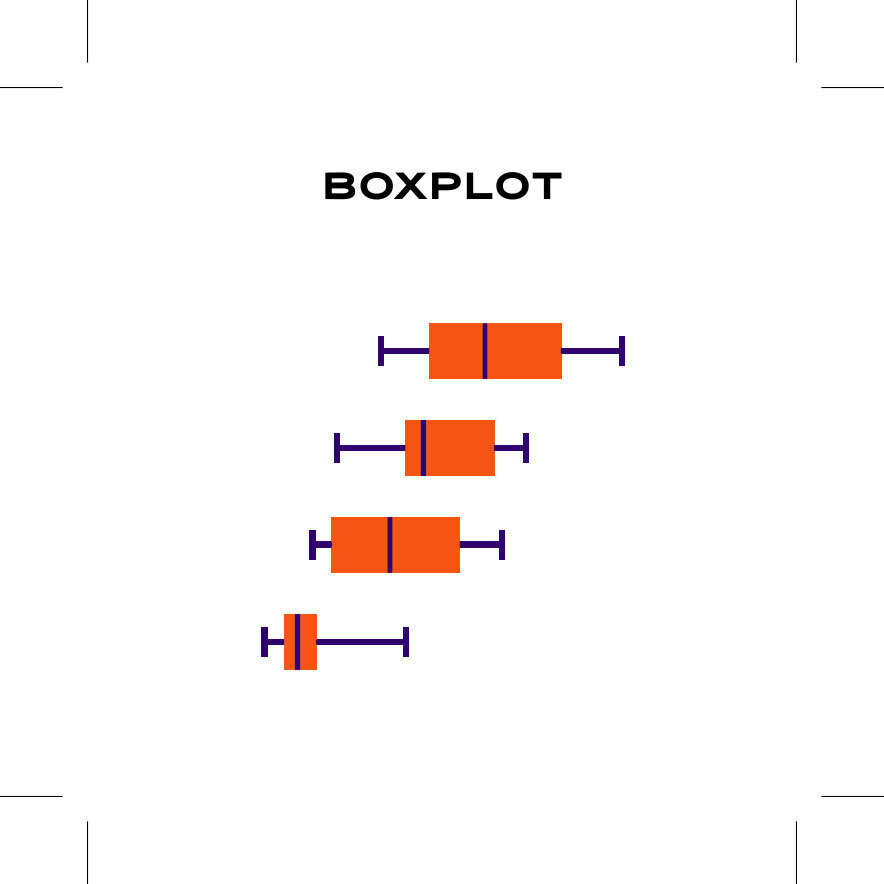
1970
John W. Tukey
box plot
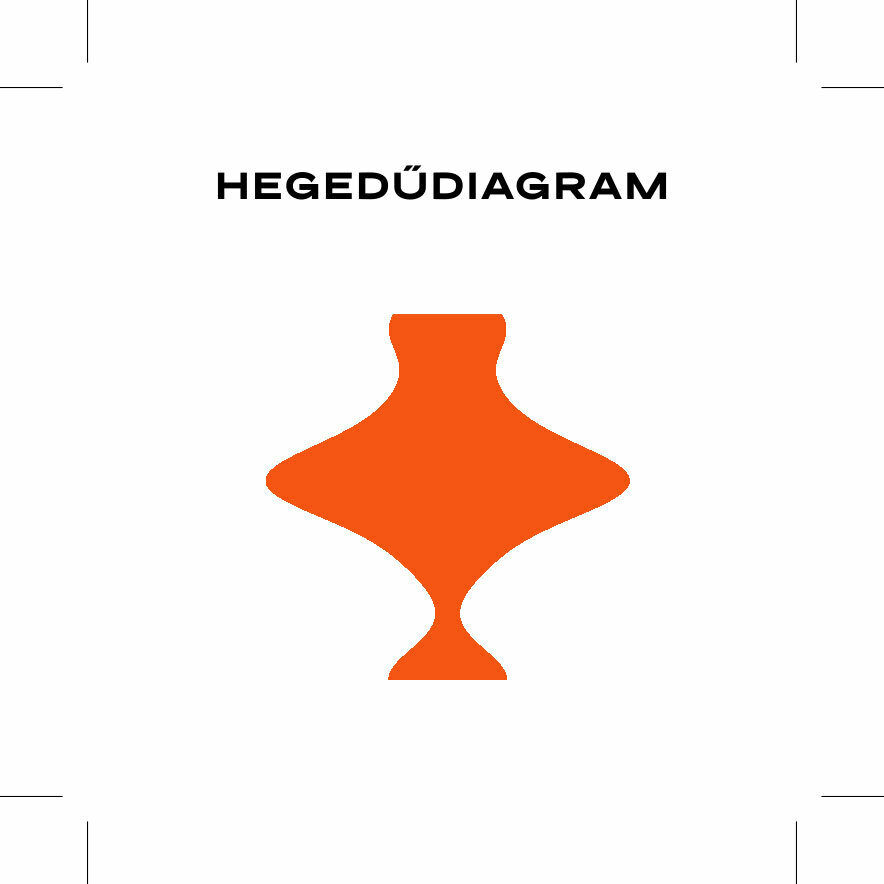
1997
Jerry Hintze és Ray Nelson
hegedűdiagram
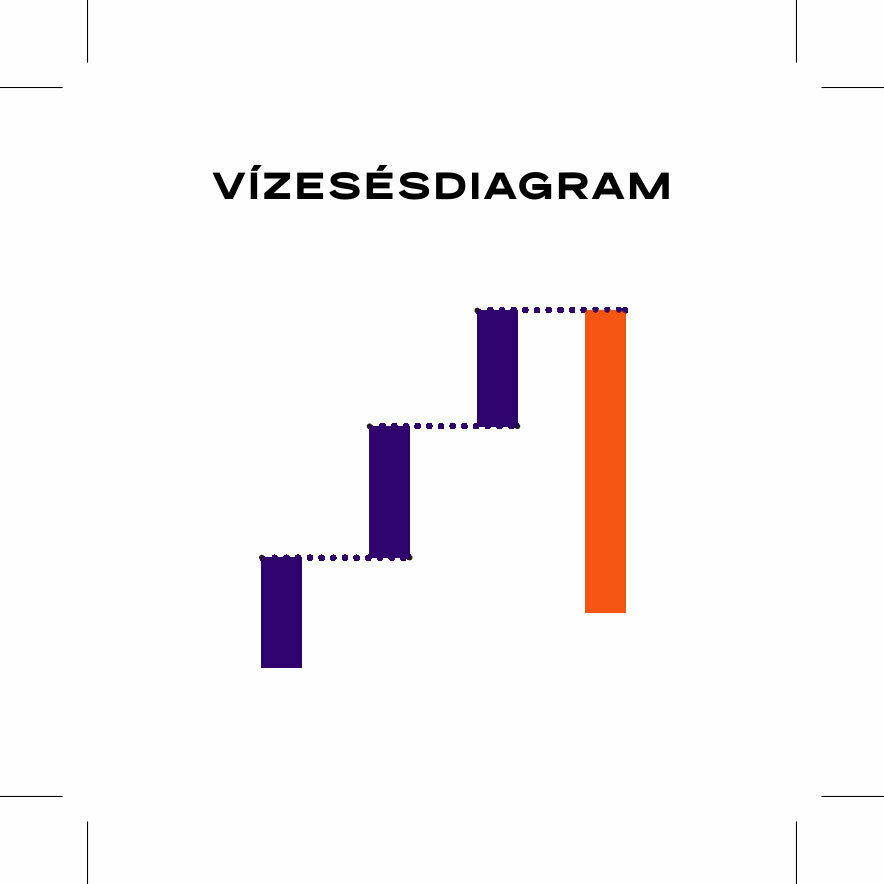
1999
Ethan Rasiel
vízesésdiagram
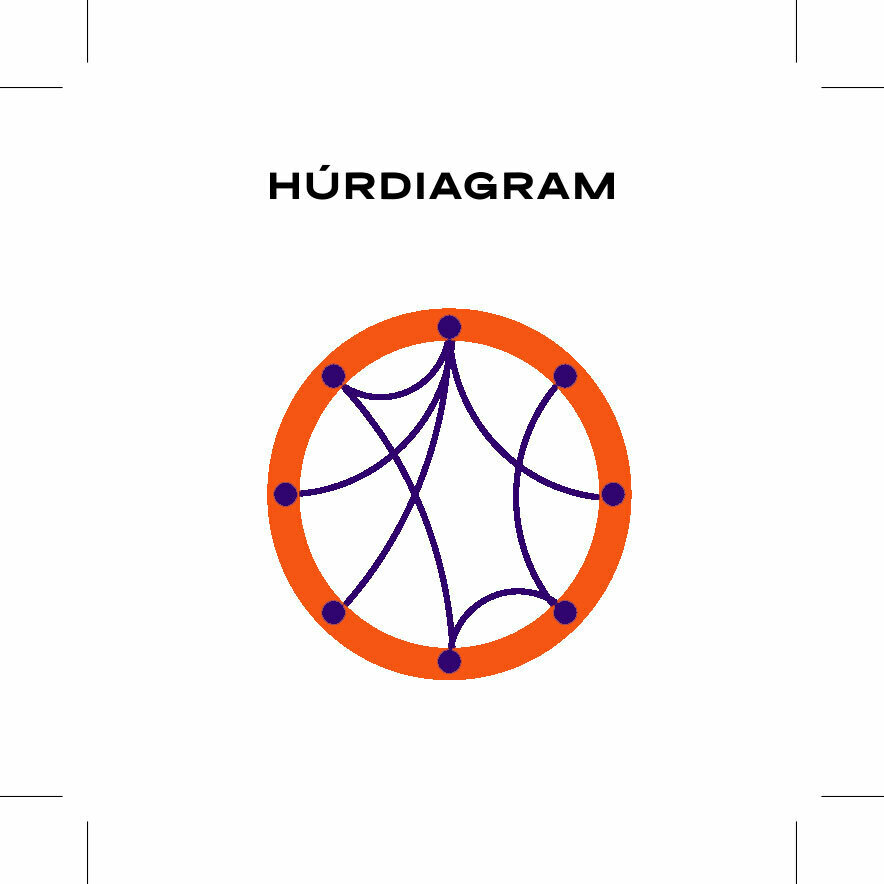
2004
Martin Krzwinsky
húrdiagram

1916
Henry Gantt
Gantt chart
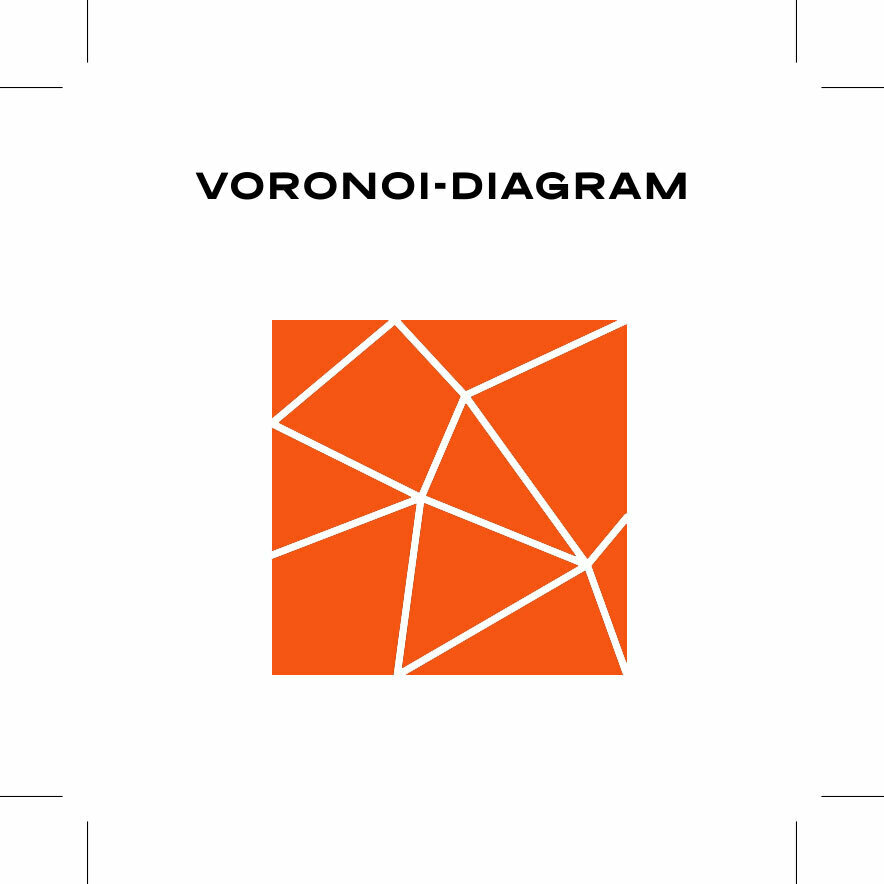
1908
Georgi Voronoi
Voronoi-diagram

1897
WD Bancroft
ternary-plot
1991
Ben Shneiderman
treemap
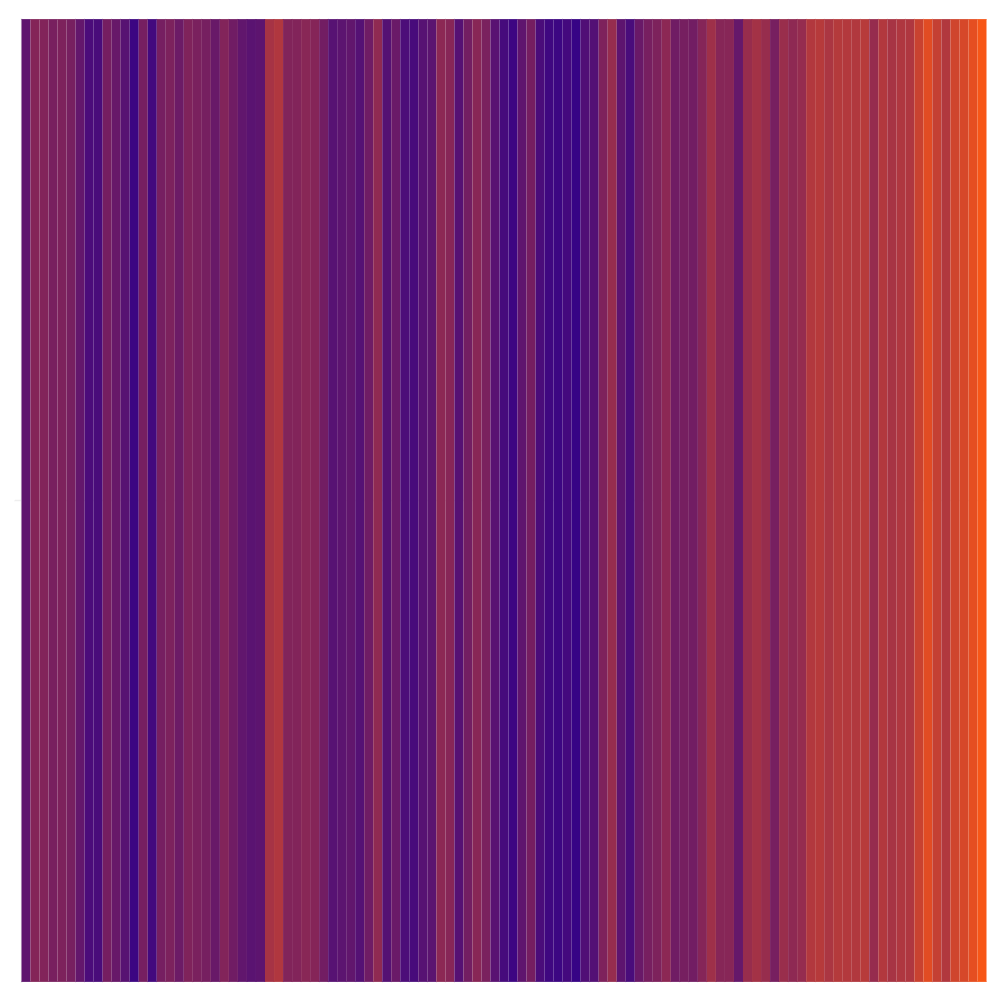
2017
Ellie Highwood
vonalkód chart
diagrams as images of knowledge
diagrams and knowledge
Aristotle: "visual proof" of mathematical theorems
Ramón Llull: "visual evidence of the "science" of God"
Charles S. Peirce: "reasoning and proving is based on diagrammatic thinking"
Bruno Latour: "diagrams make facts harder"
Howard Wainer: "visual revelations"
Johanna Drucker: "our knowledge exists mostly through diagrams"
diagrams as data graphics as images of knowledge
Gottfried Boehm (iconic turn): useful images
Horst Bredekamp (Bildwissenschaft): epistemic images
James Elkins: informational images
Sybille Kramer: operative images
critical problems
over the last twenty years, more and more people have been questioning this interpretation based on cognitive psychology, epistemology, ideology and representation
how do we use diagrams?
exploration
explanation
- to discover
- to understand
- to analyse
- to test
- to prove or disprove
- to find insights
- to find new questions
- to show
- to enlighten
- to explain
- to persuade
- to manipulate
some classics

William Playfair: The Commercial and Political Atlas, 1786
- The first book containing dozens of data graphics
- The first use of data graphics for statistical data
- Charts as we know them
- "standard"
- explanations of "how to read" them
- essay on the value of graphics
- area chart, bar chart, pie chart
Valentine Seaman's yellow fever map

- 1795–96, New York
- 1798
- the first disease map

"Snow's" cholera map
correlation:
S=waste
x=case
Seaman's
wrong conclusion because of miasma theory:
waste causes fever
=mosquitos
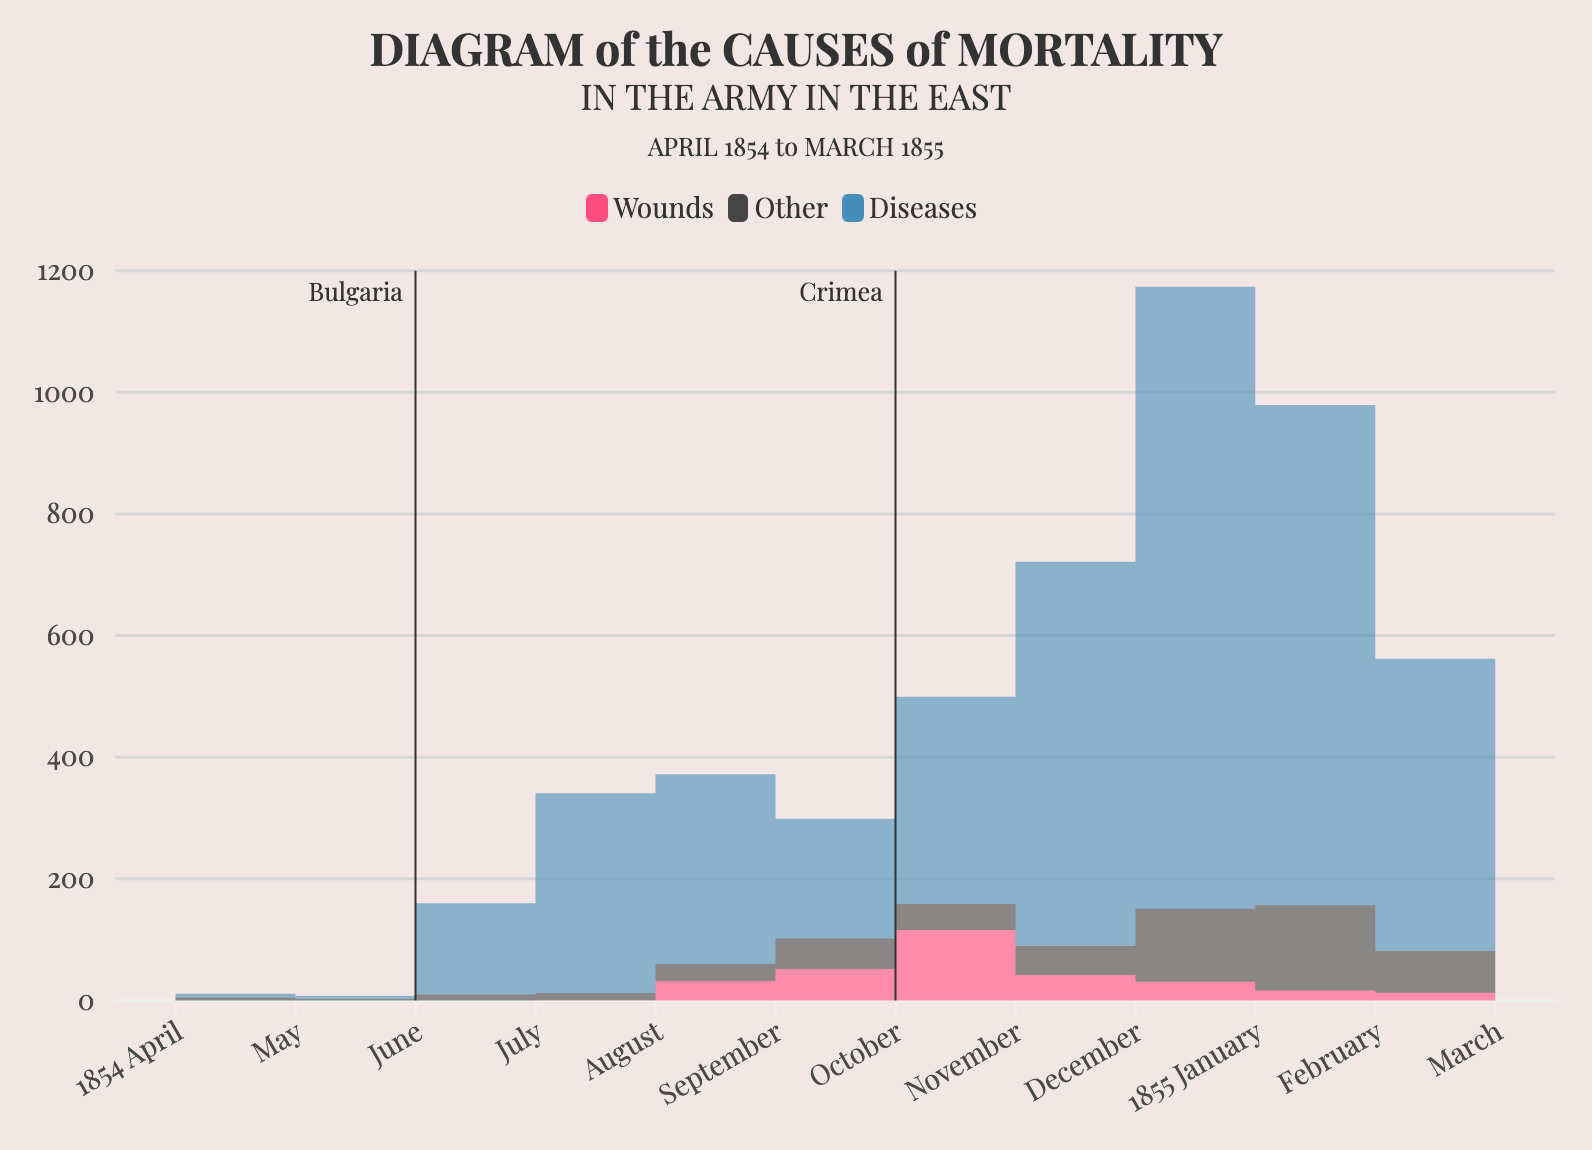
Florence Nightingale: Causes of Mortality, 1863
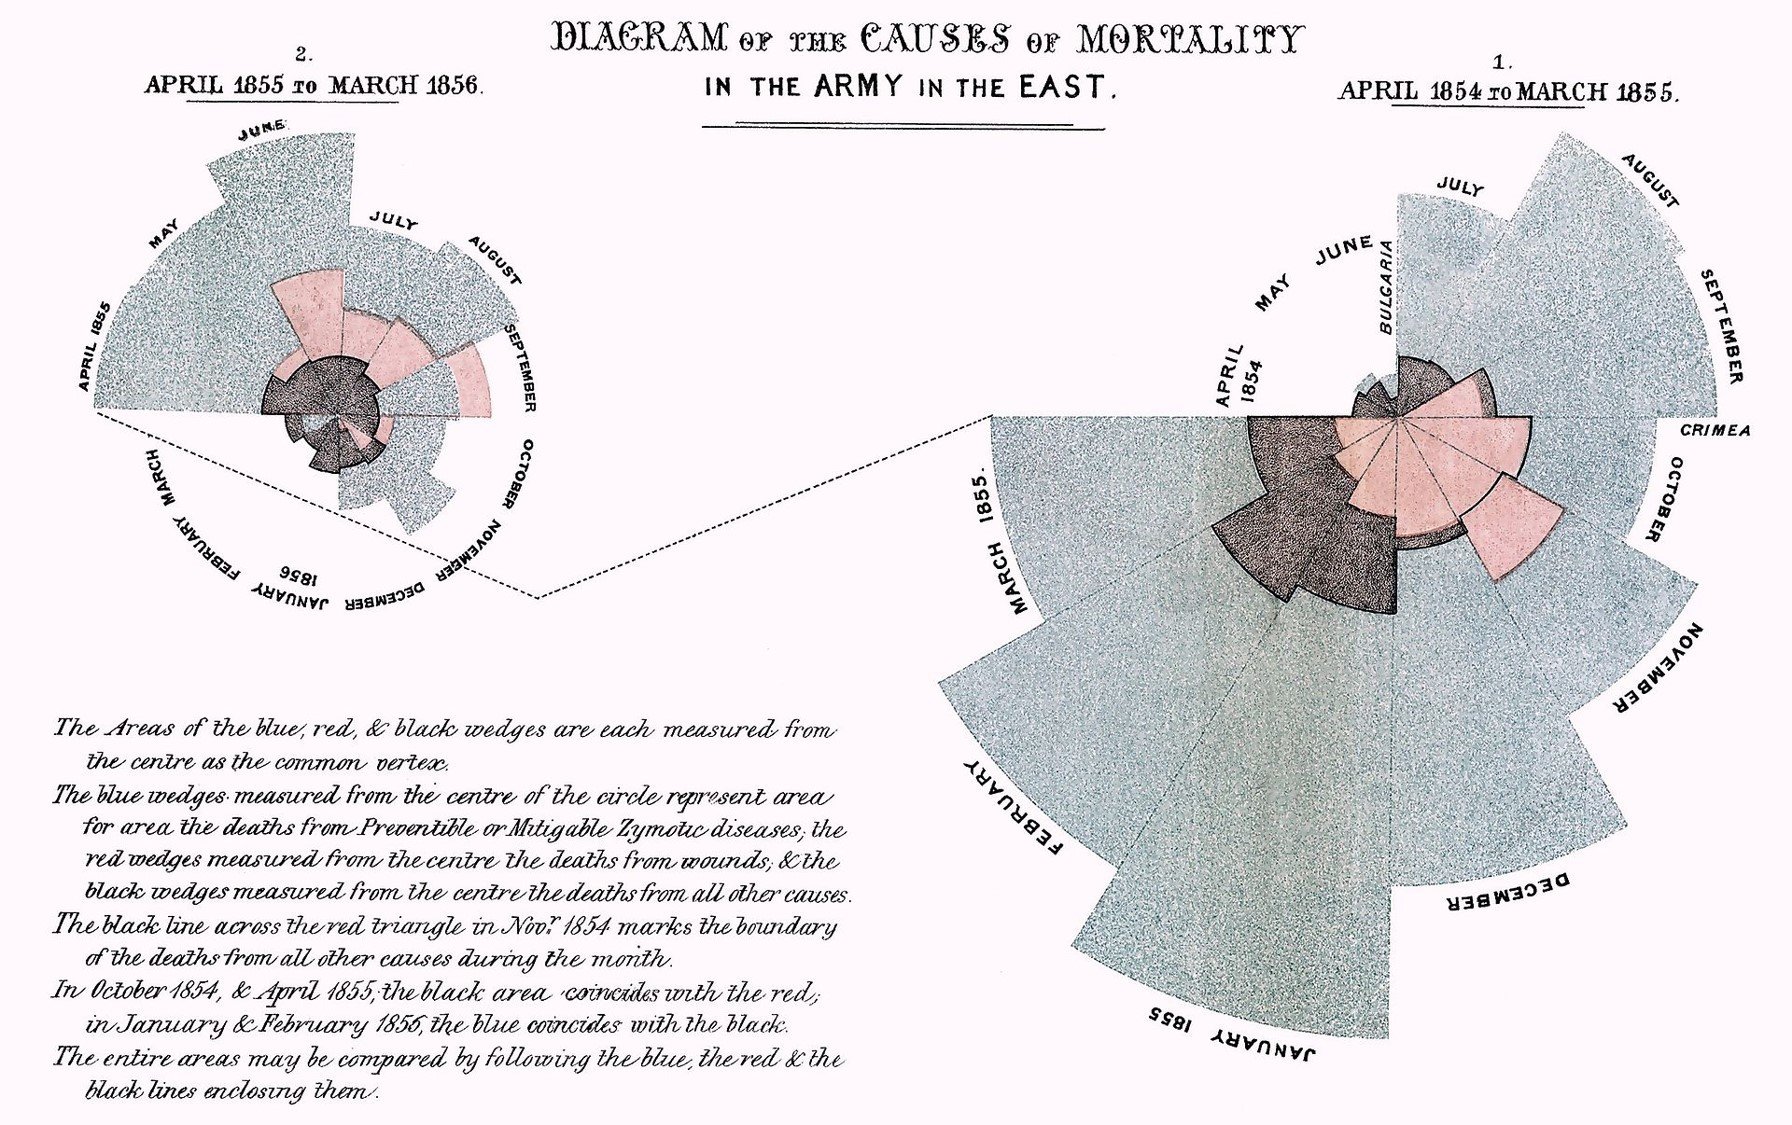
AM Guerry, 1829
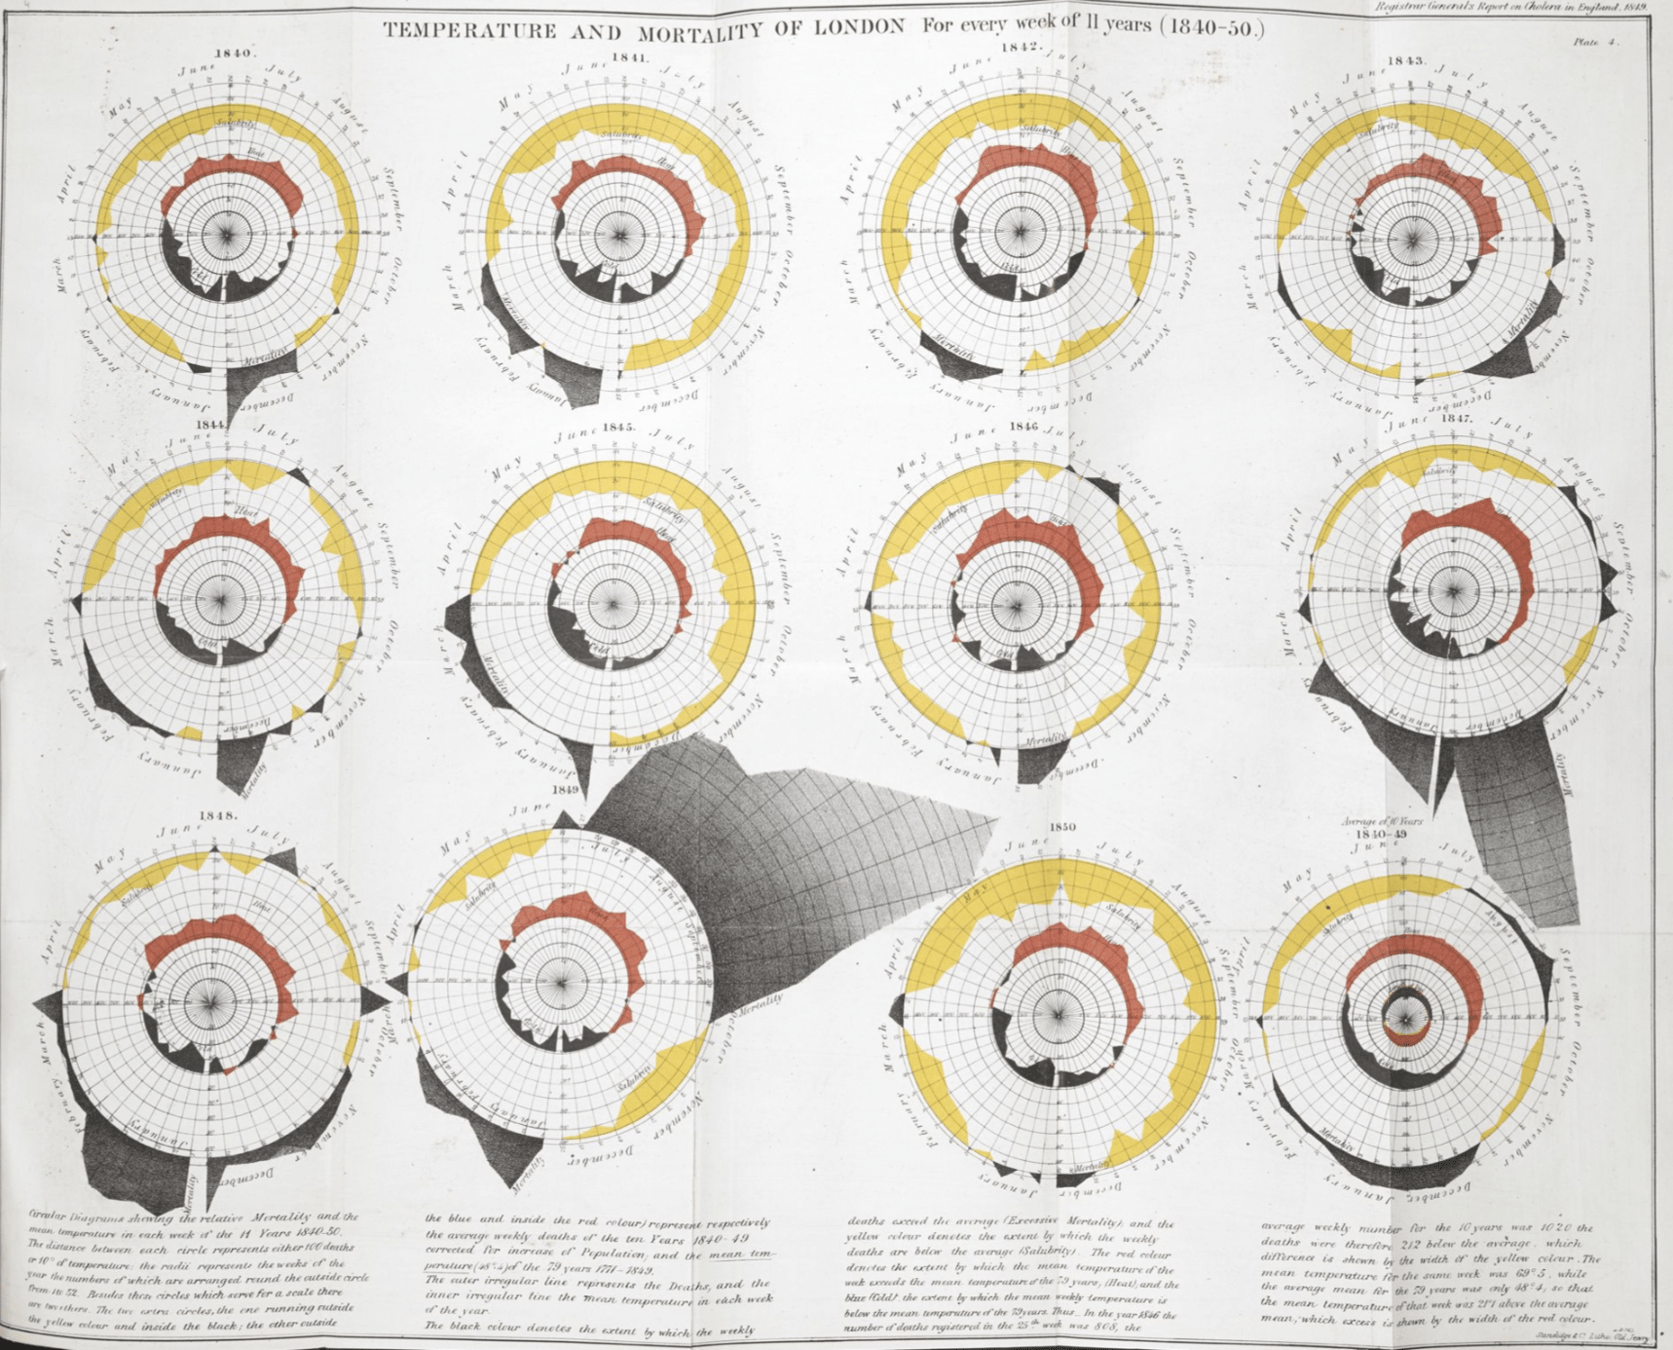
William Farr, 1852
Charles-Joseph Minard: Napoleon's Russian campaign of 1812-13, 1869

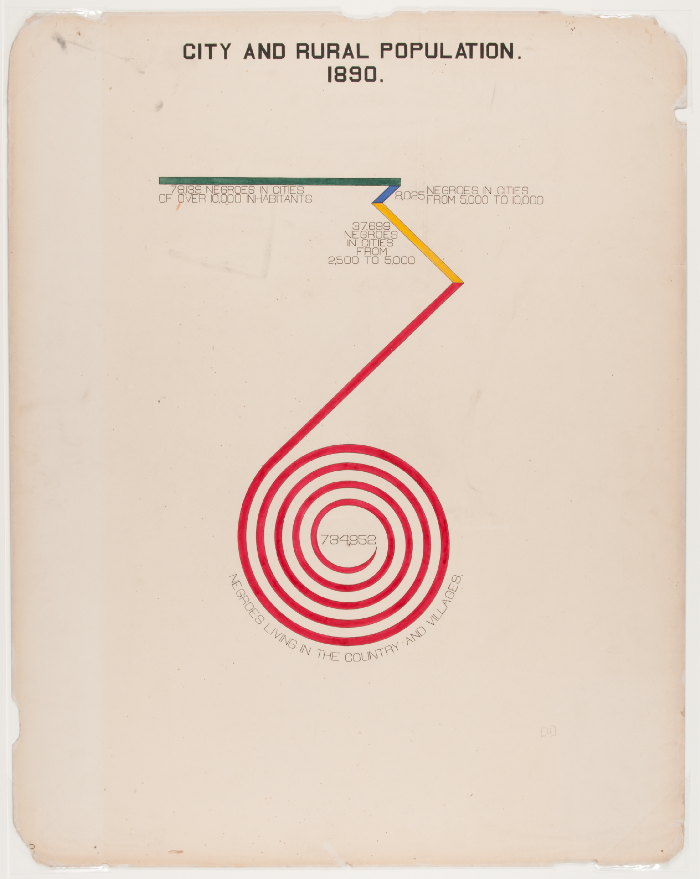
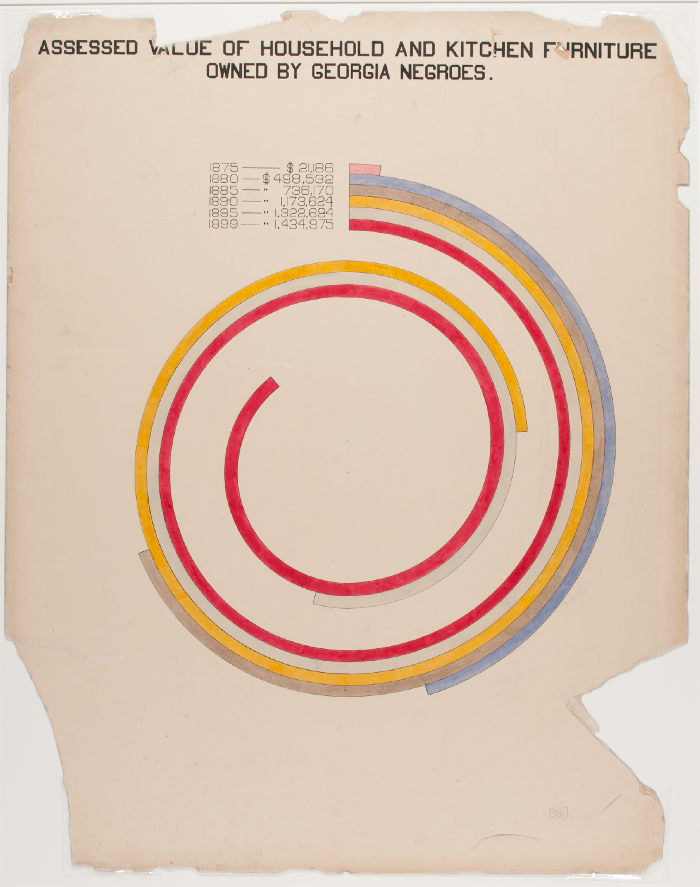
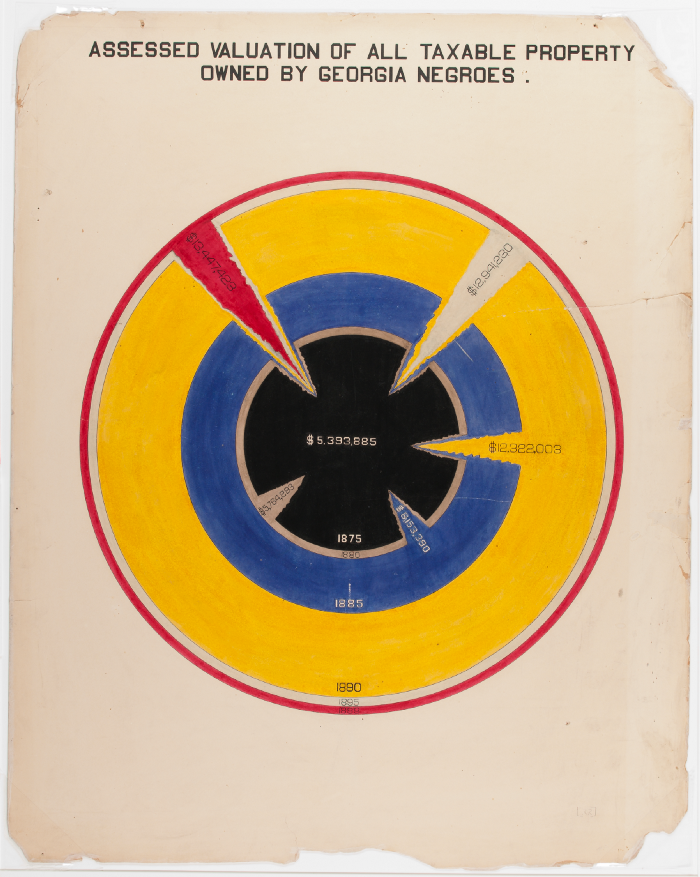
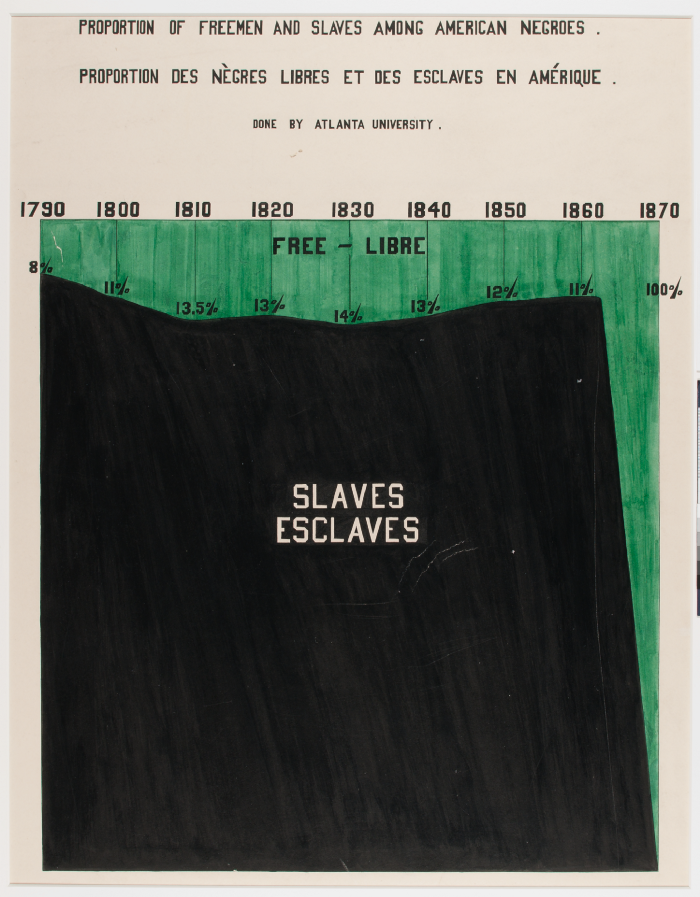
W.E.B Du Bois: The American Negro, 1900


W.E.B Du Bois: The American Negro, 1900


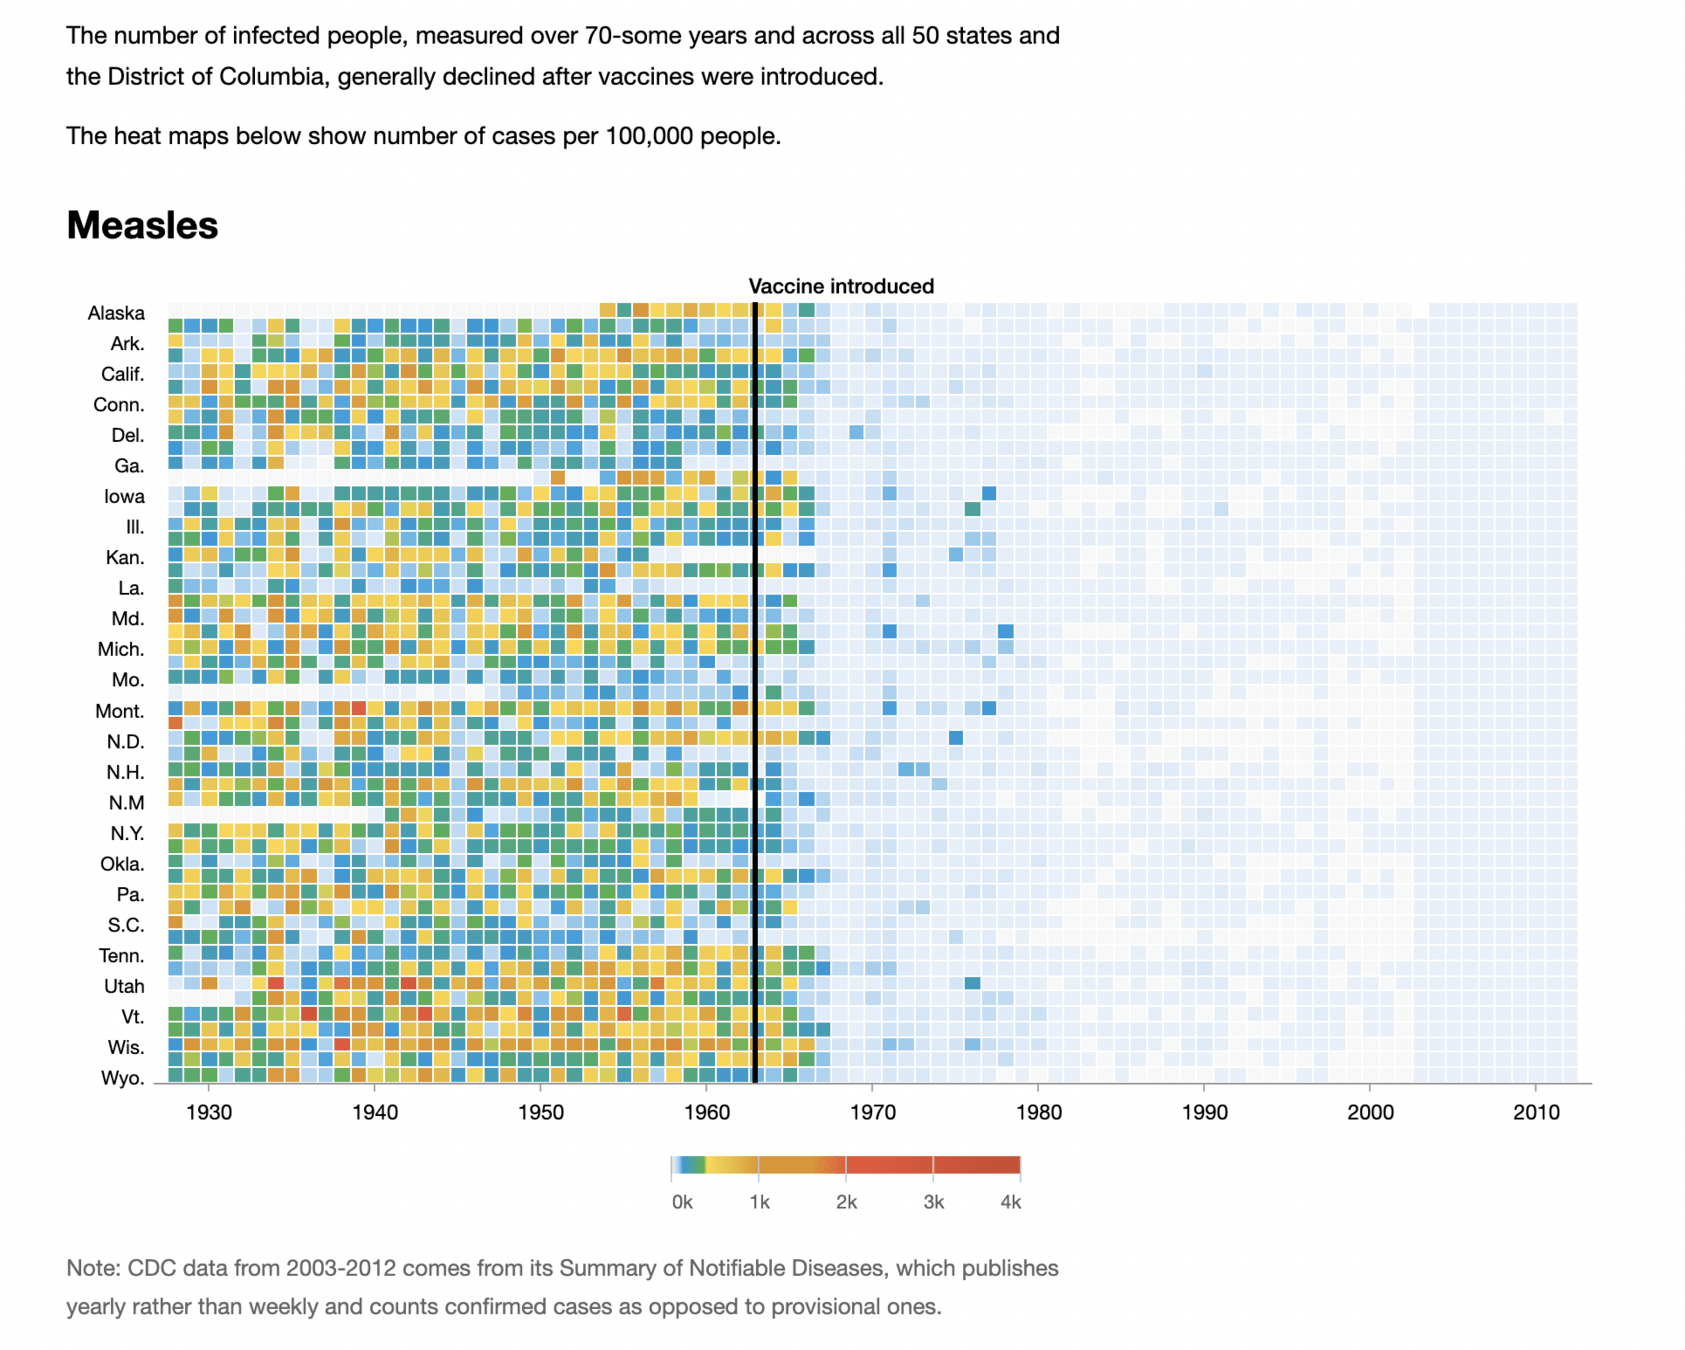
Tynan DeBold and Dov Friedman: Battling Infectious Diseases, WSJ, 2015
https://graphics.wsj.com/infectious-diseases-and-vaccines/


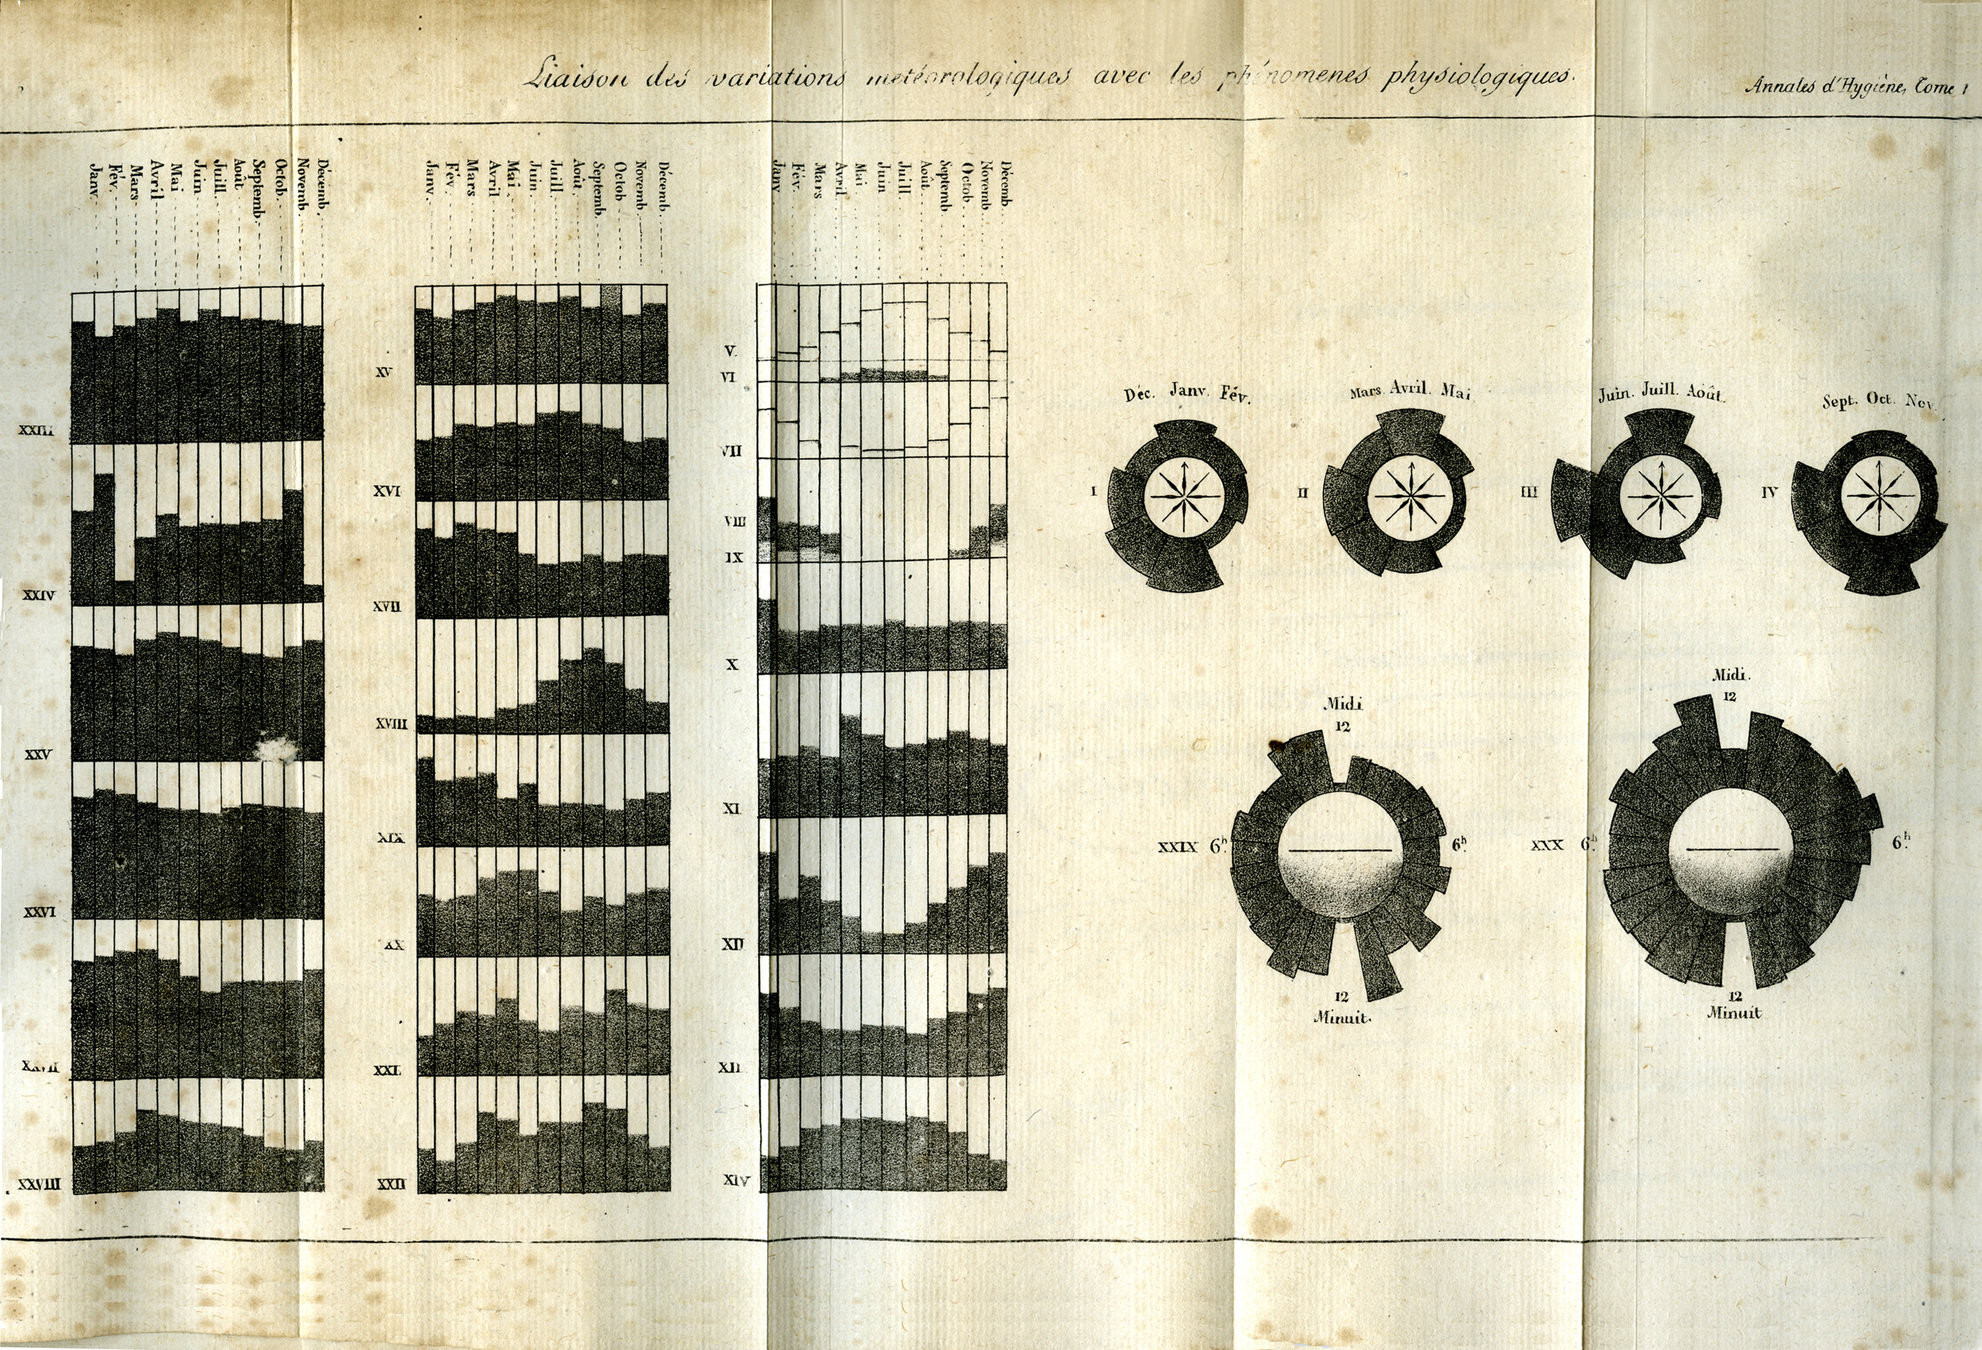
Étienne-Jules Marey, 1878
Howard G. Funkhouser, 1937
Michael Friendly, 2005–

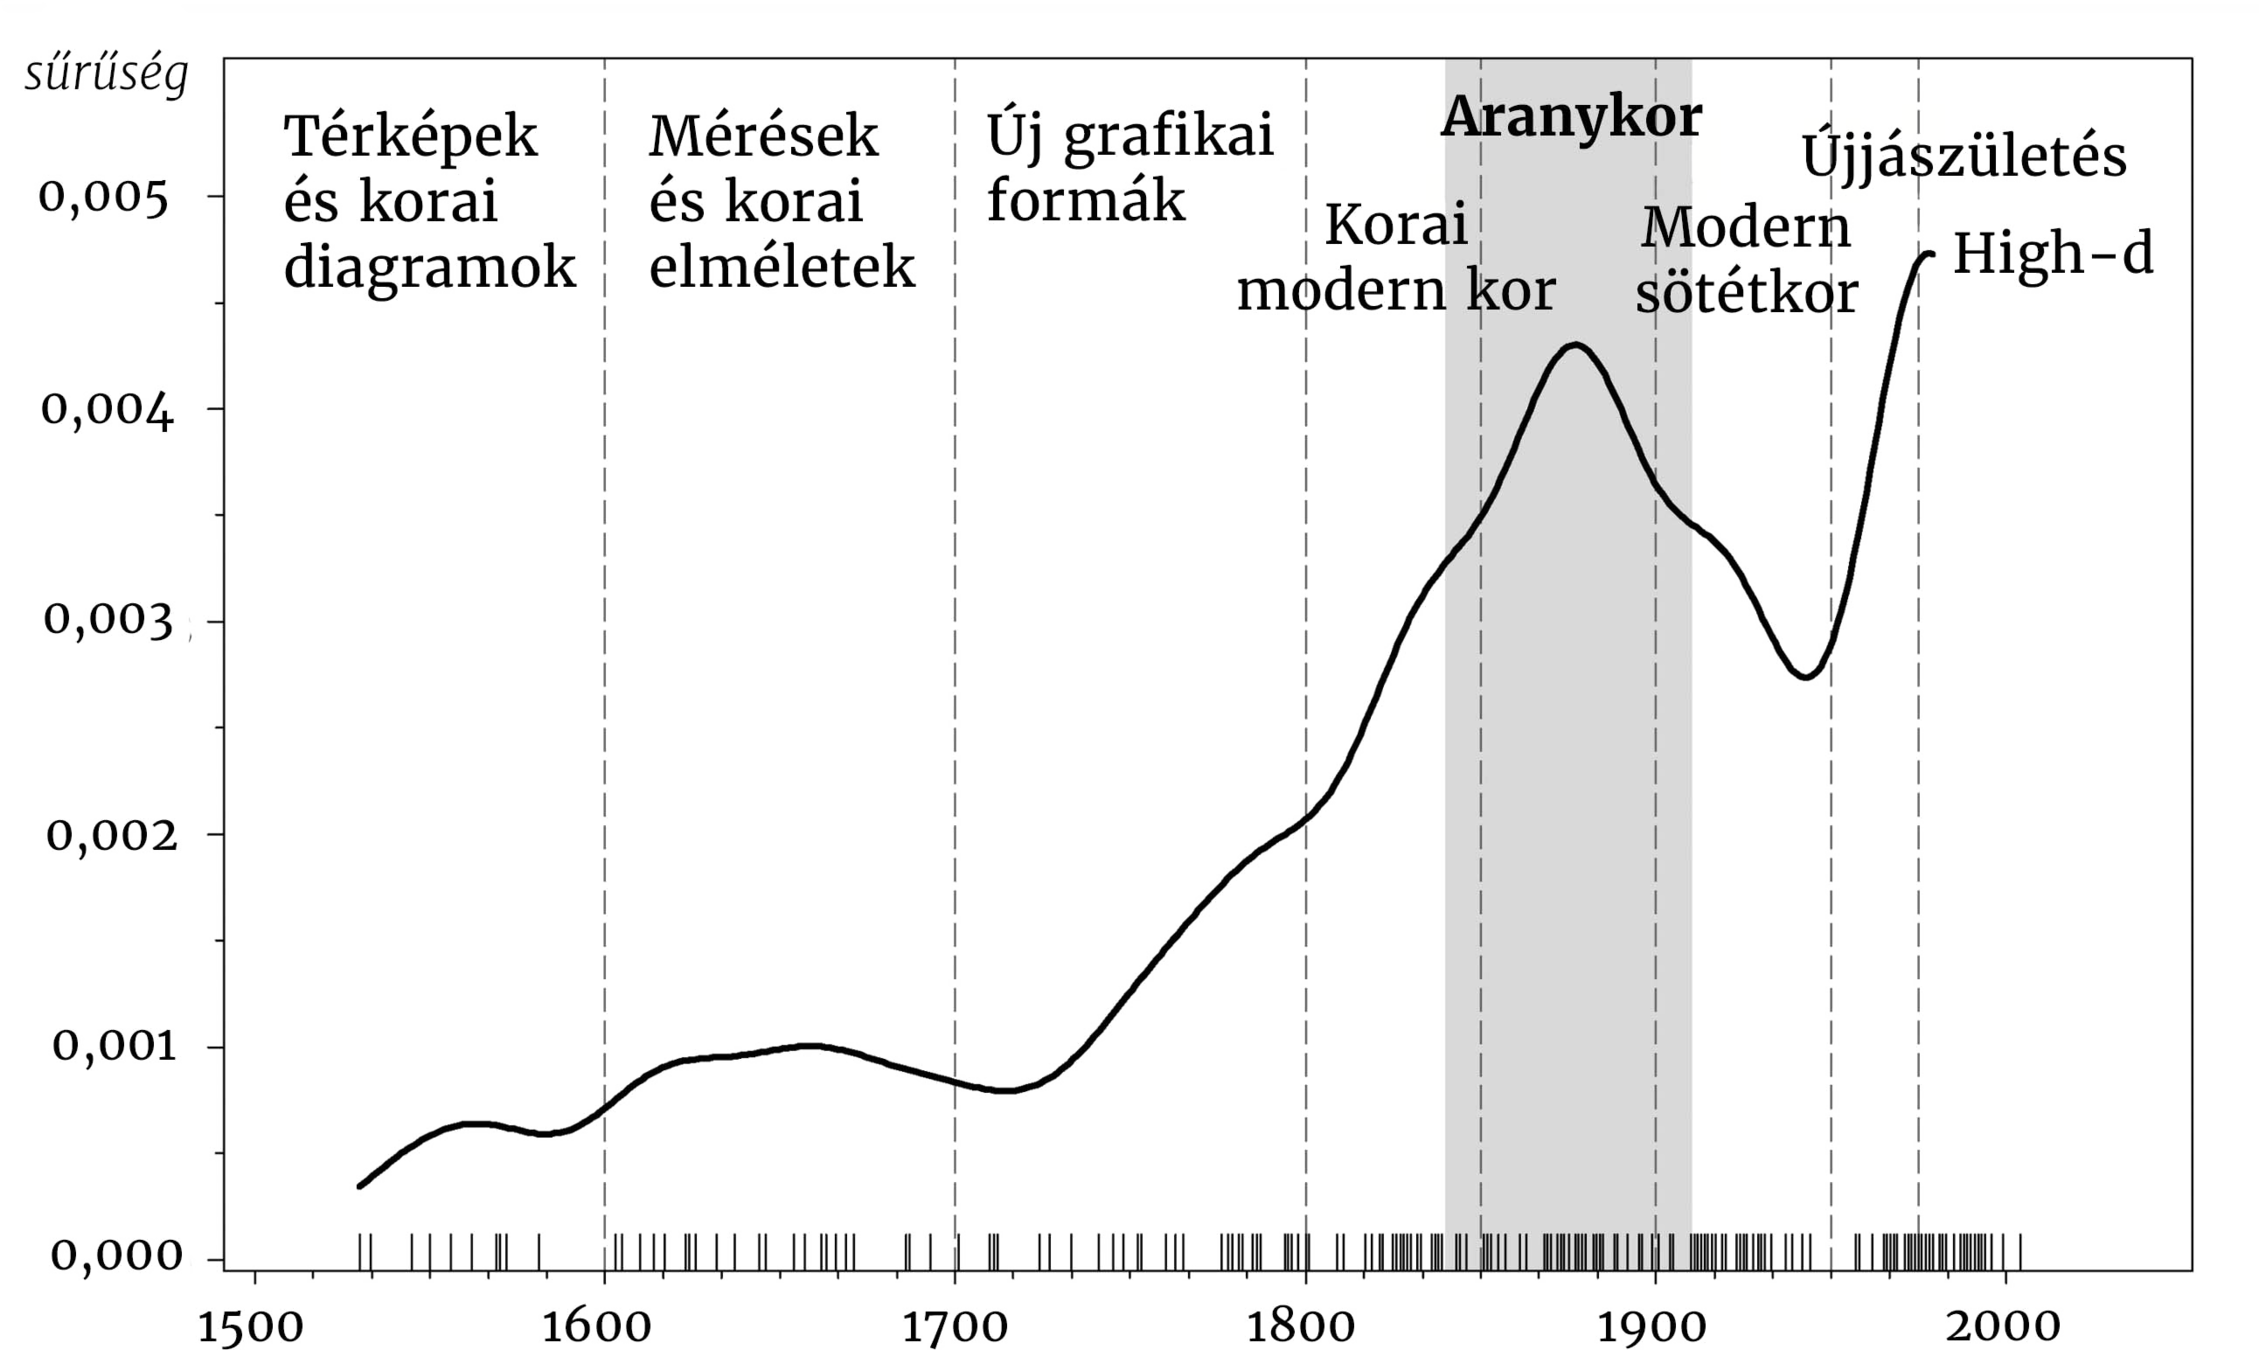
Michael Friendly: The Milestones Project, 2001–
Something is missing: the entire world outside the West


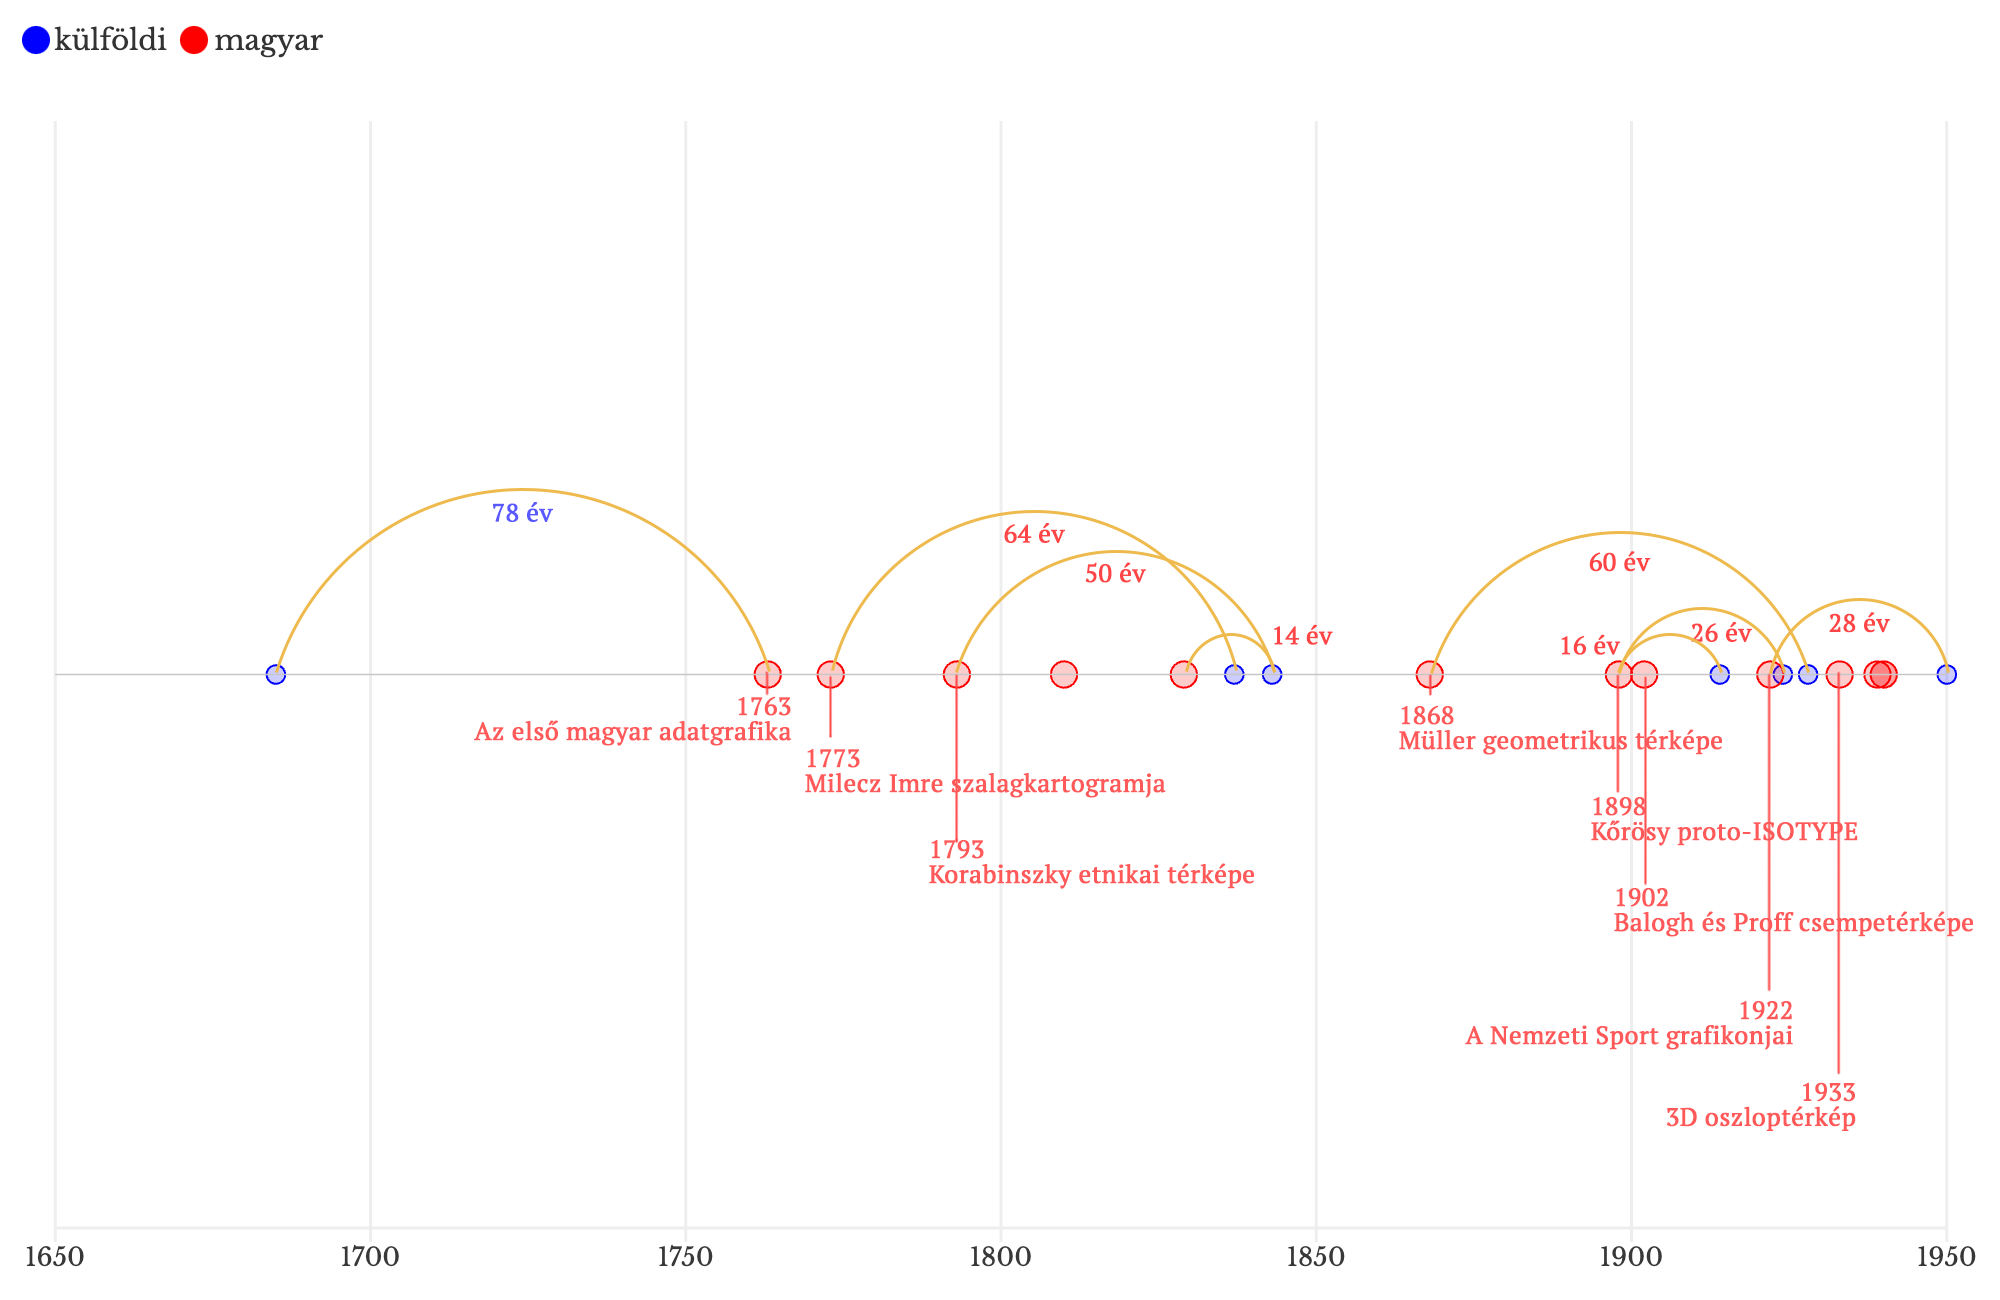
my incorrect observation: low production, poor quality
after the research: high quality, many innovation but 50 years later
Michael Friendly:A Brief History of Data Visualization. In Chun-houn Chen, Wolfgang Karl Hardle, Anthony Unwin (szerk.): Handbook of Data Visualization. Springer Verlag, 2006, p. 16.
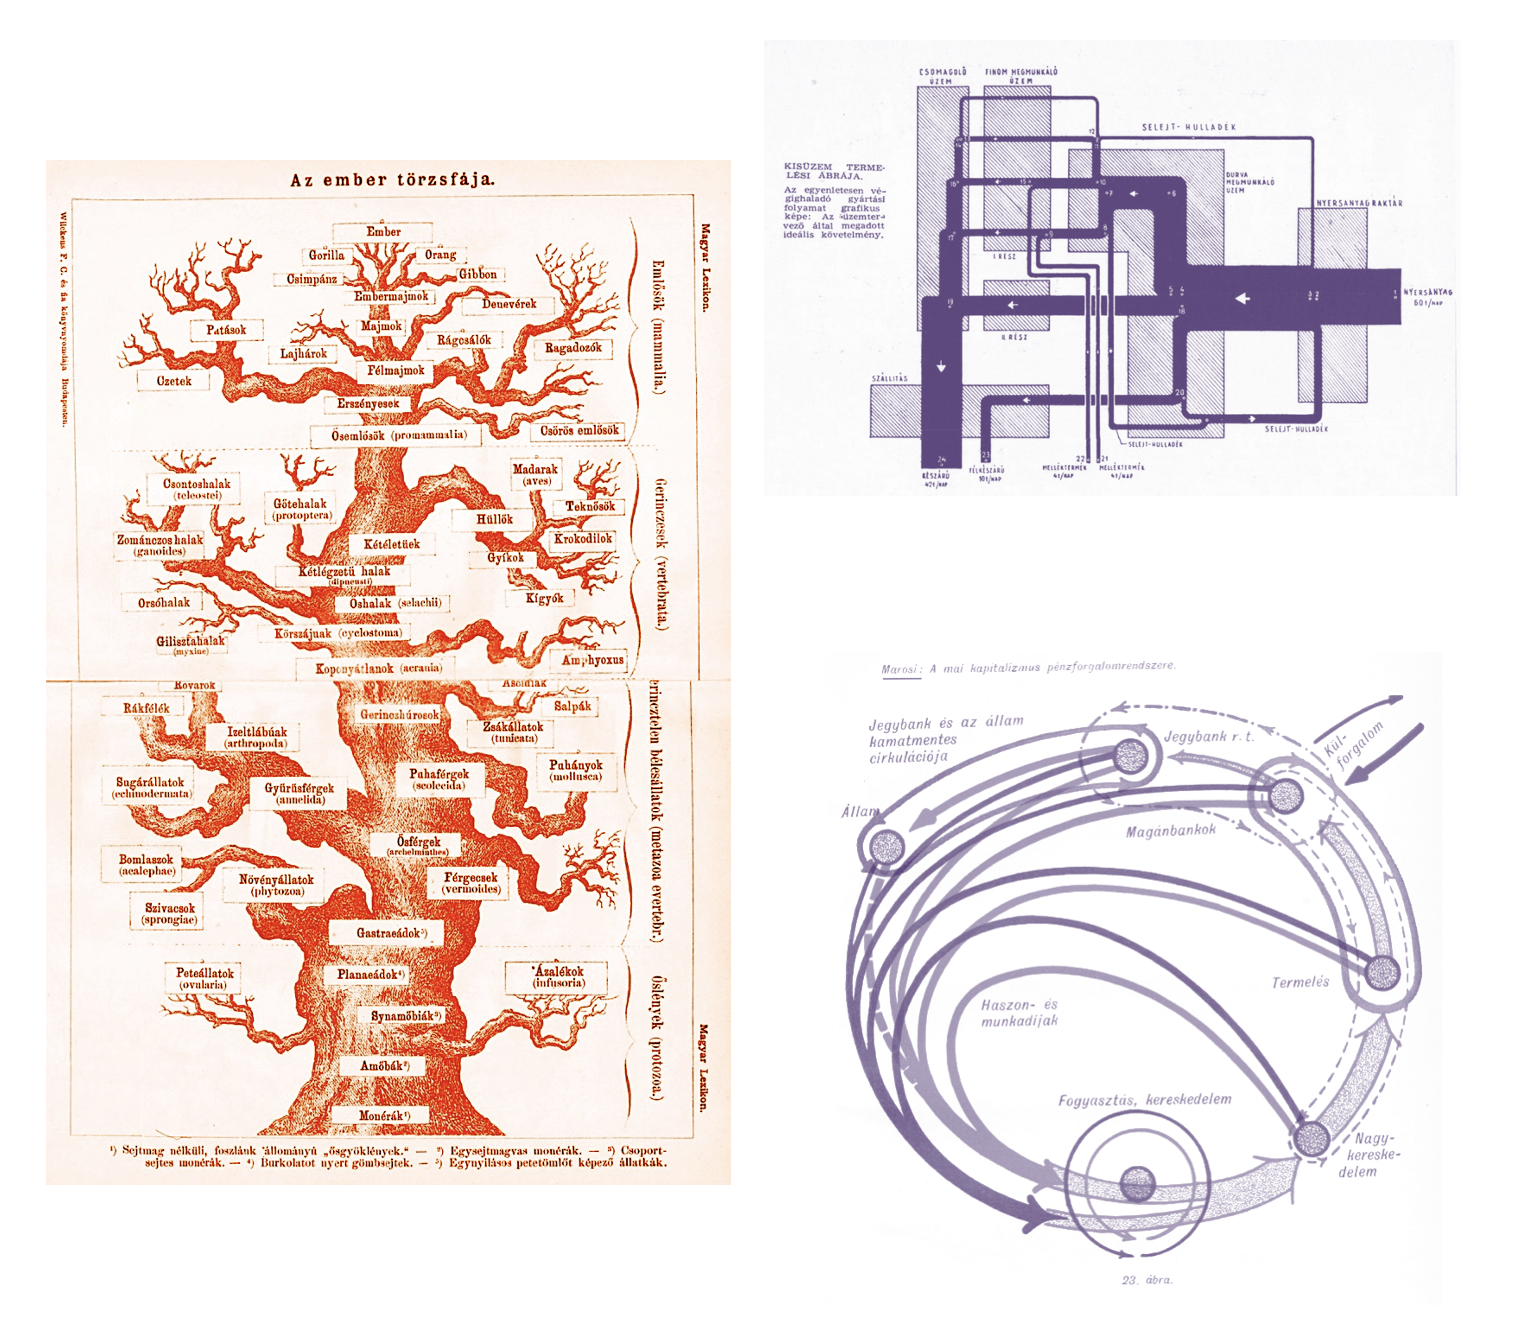
az első ismert magyar adatgrafika
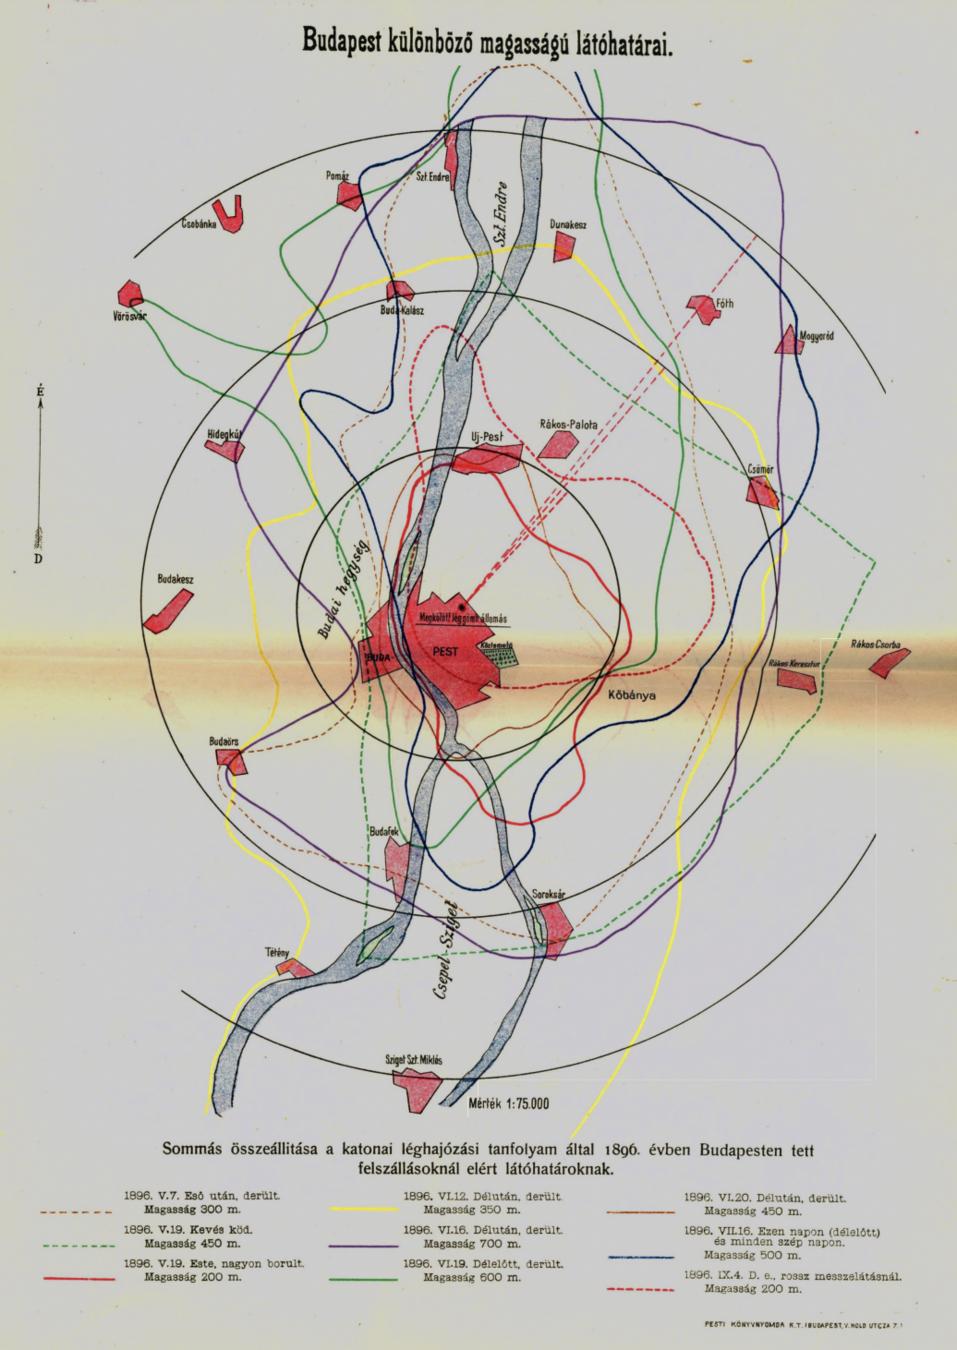
magyar "aranykor"
magyar "aranykor"


Weiss Ferenc - Ephemerides Meteorologicae Tyrnavienses, 1763, 1766, Budapest, ELTE Egyetemi Könyvtár és Archívum
Első közlés: Réthly Ferenc: Időjárási események és elemi csapások Magyarországon 1701–1800. Budapest, 1970 p. 207, 222
The first Hungarian data graphic


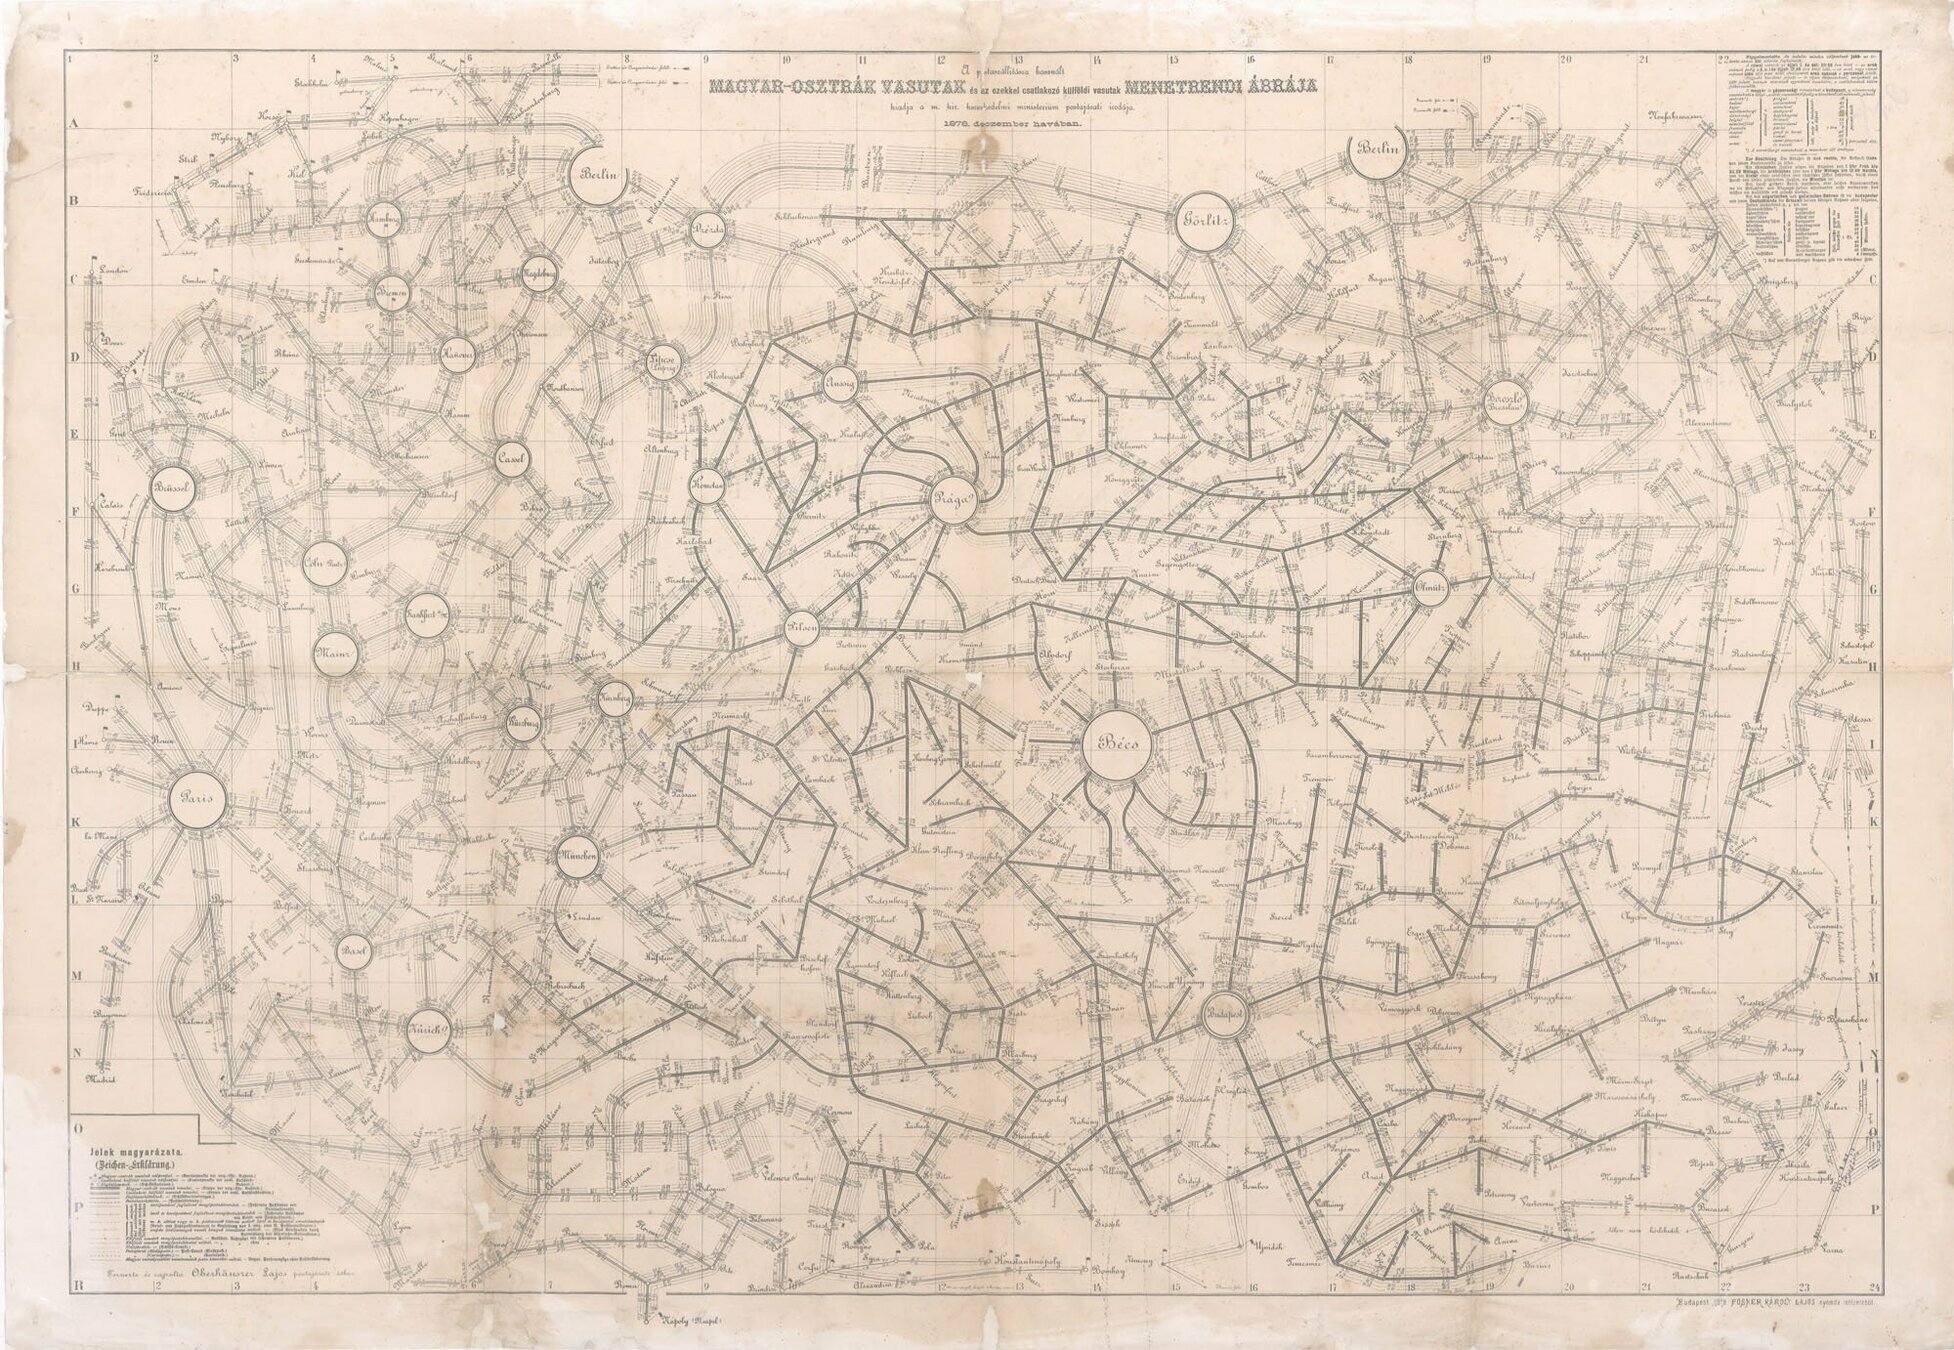
The first flow map. Imre Milecz, 1773
Milecz Imre (Emericus): Mappa Regni Hungariae demonstrans universas caesareo regias salis stationes. Regis Hungariae, Croatiae, Schlavonia, magni item Principatui Transilvaniae ingremiatas, Posonii, 1773. OSZK
Azonosította: Papp-Váry Árpád, Klinghammer Ferenc


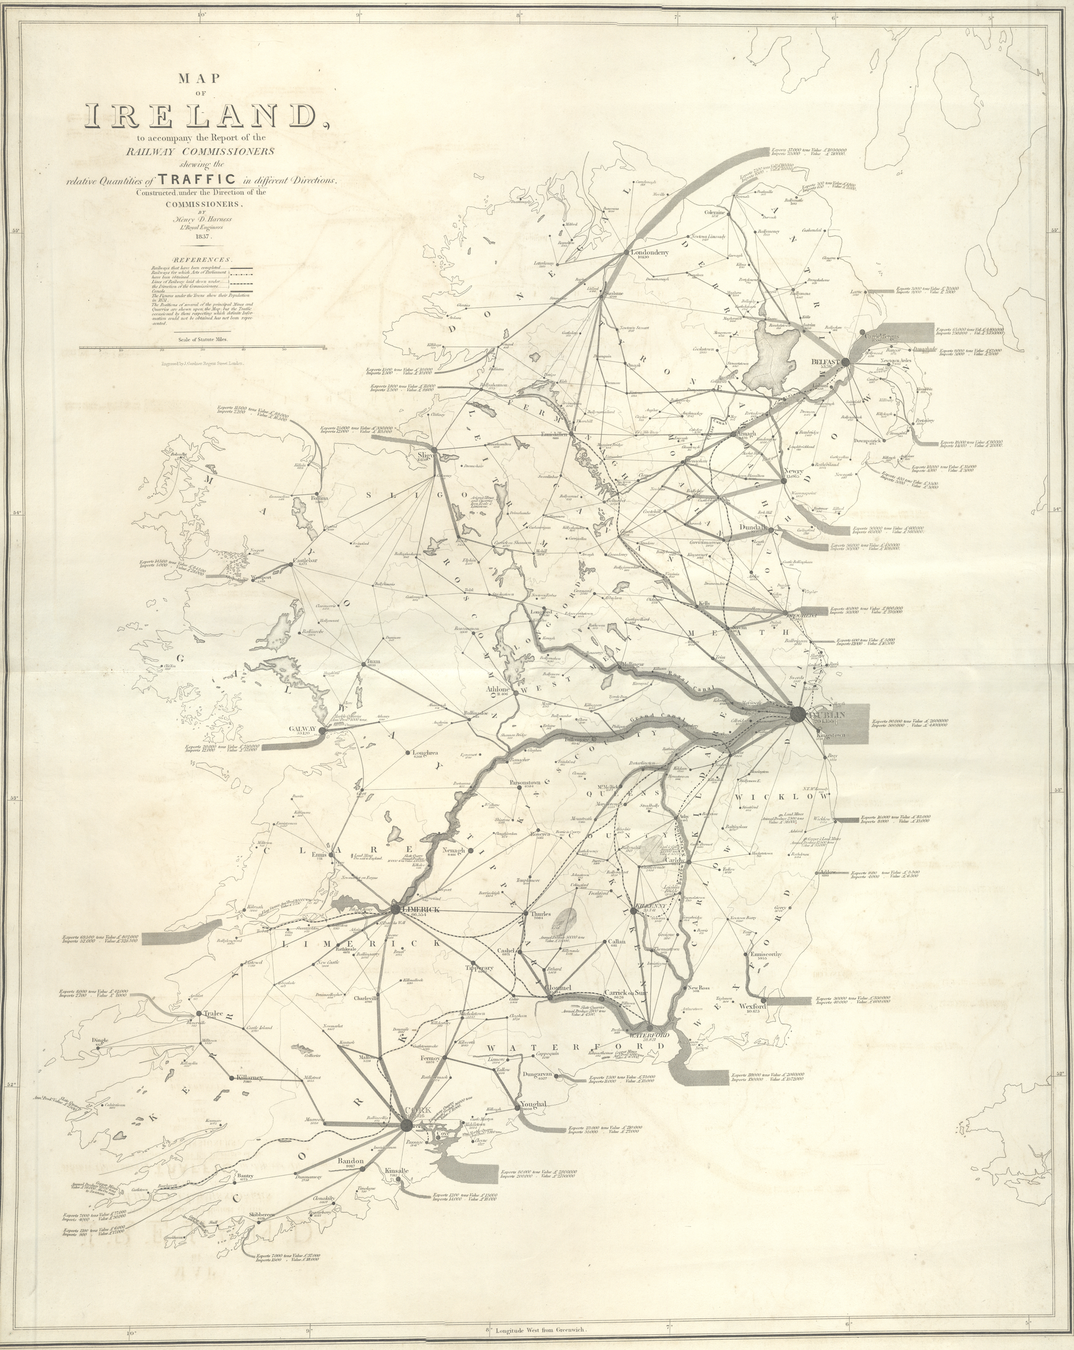
Henry Drury Harness, 1837

Charles-Joseph Minard, 1869
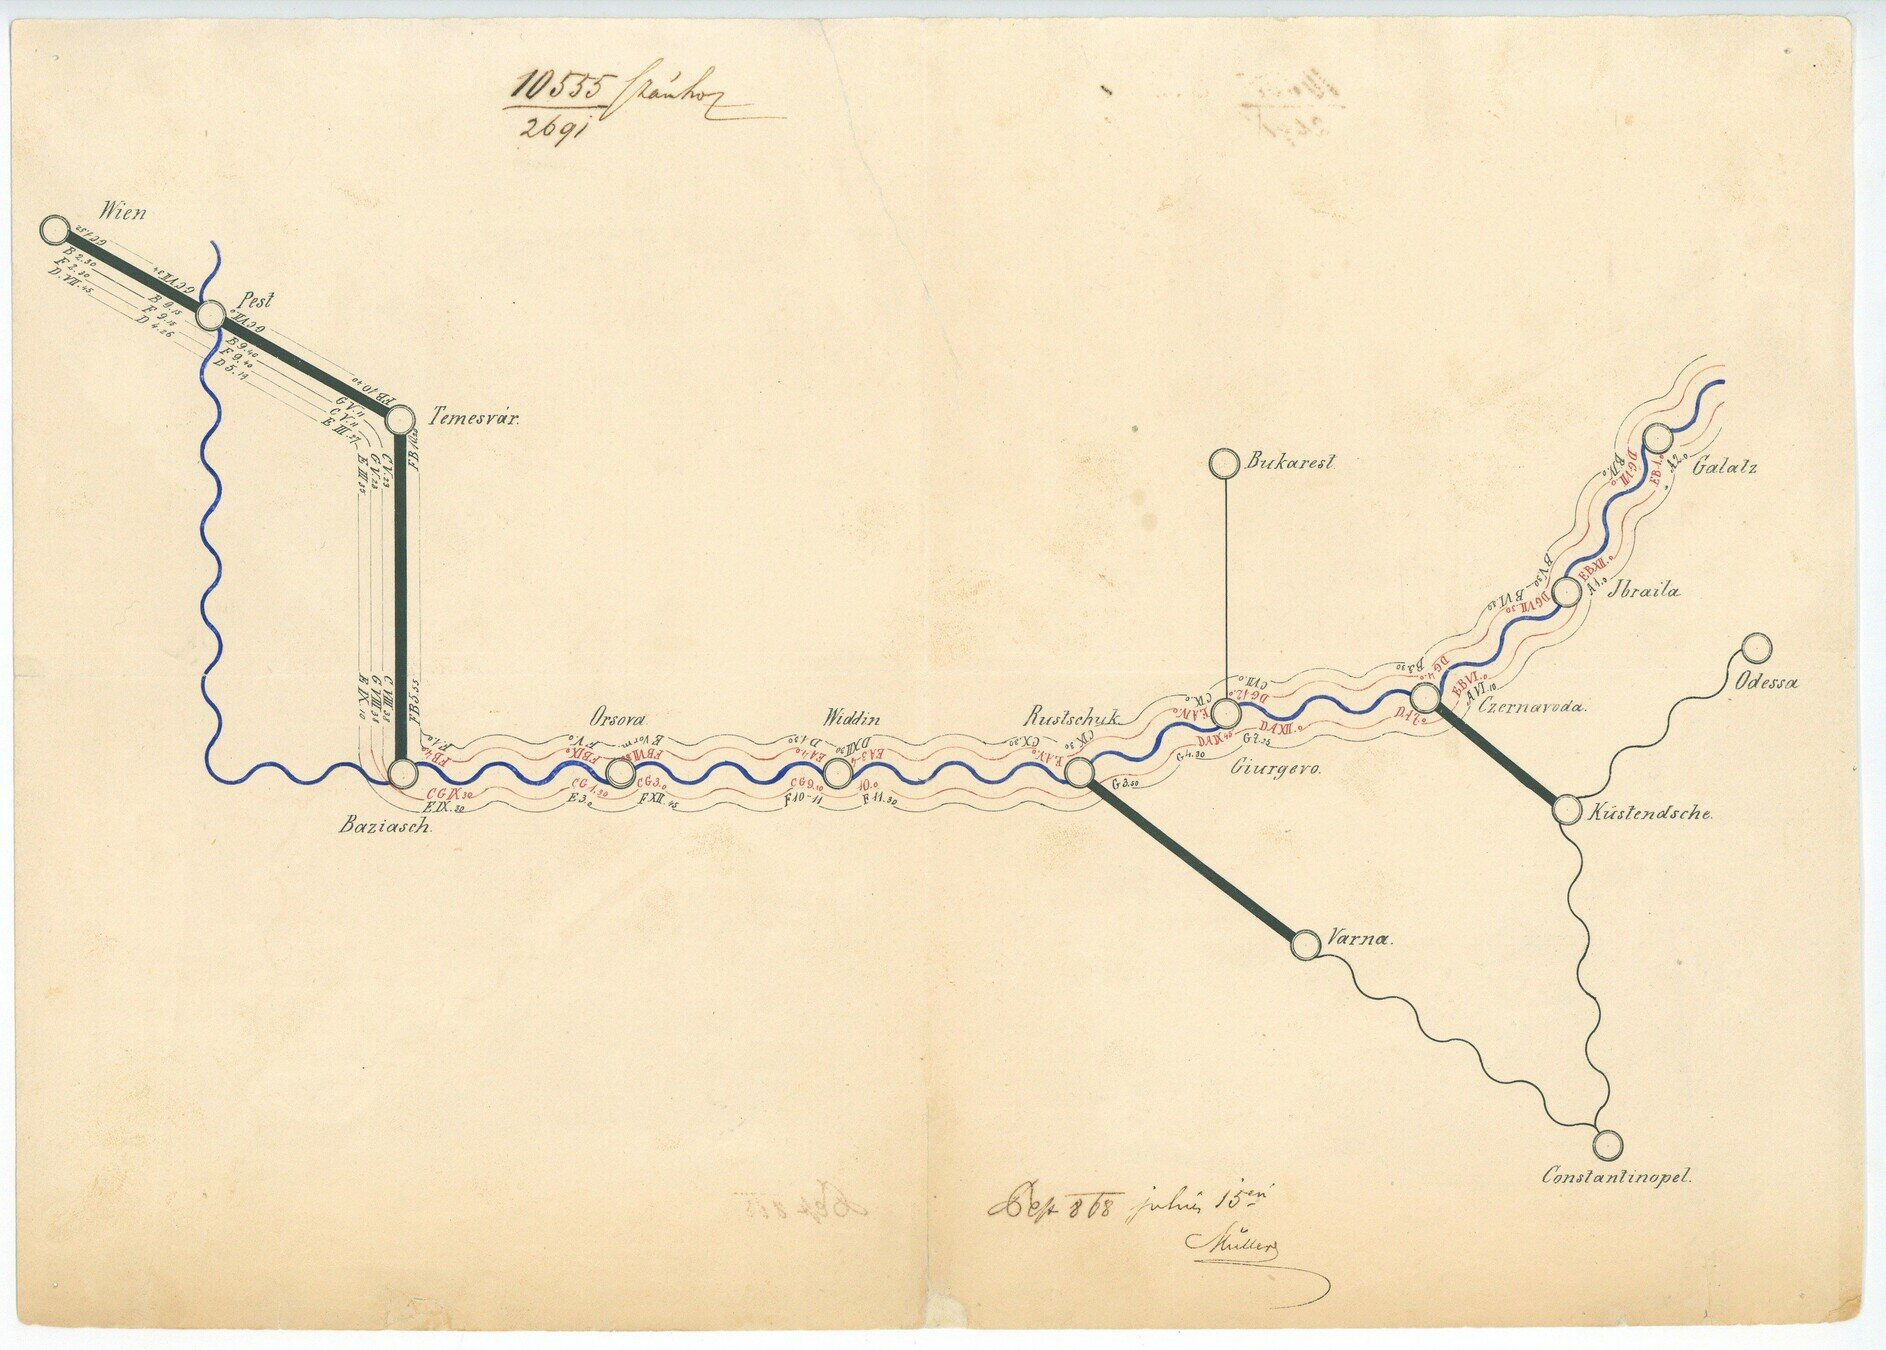
? Müller - Postal routes between WIen and Galac, 1868, Postamúzeum
Müller's geometric map, 1868
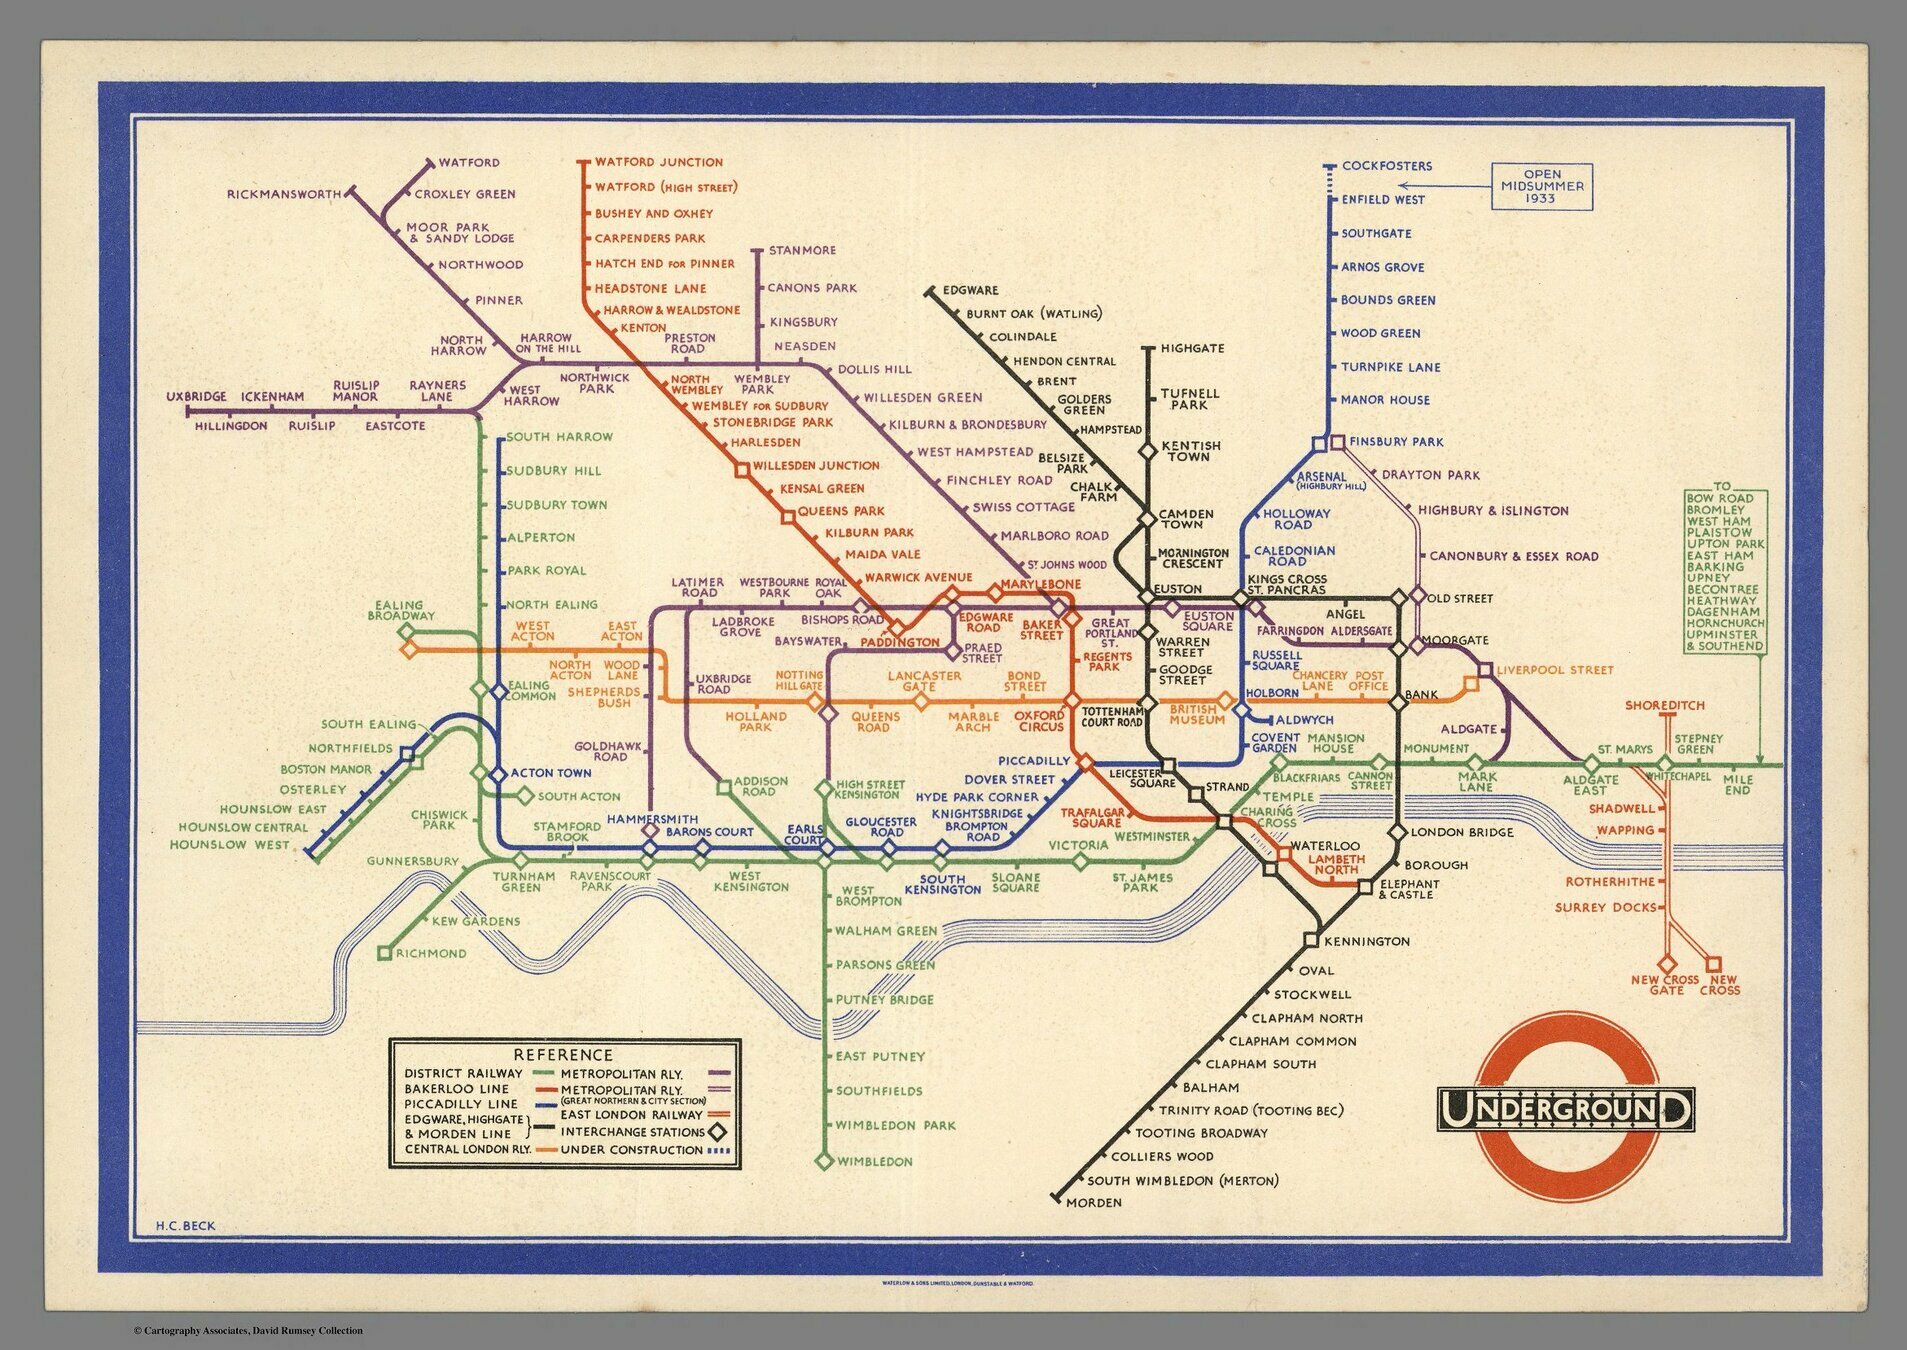
Harry Beck - Map of London's Underground Railway Network, 1933, David Rumsey Map Collection

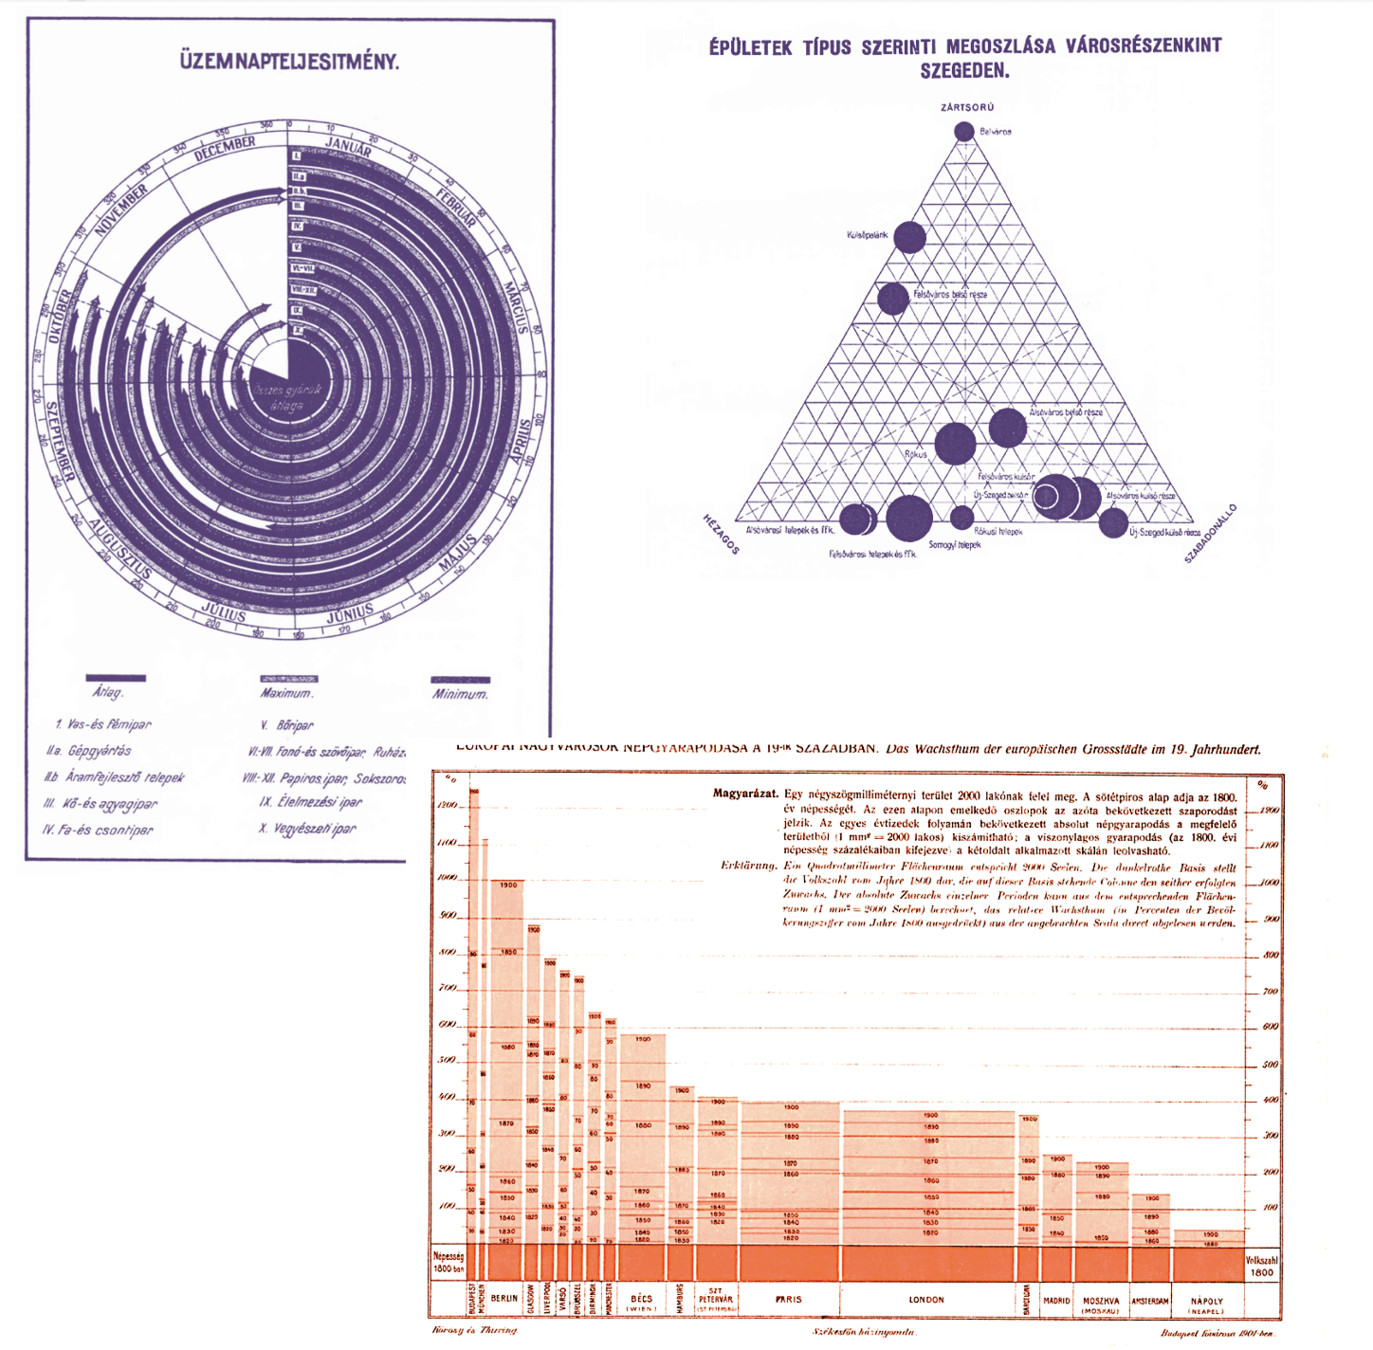
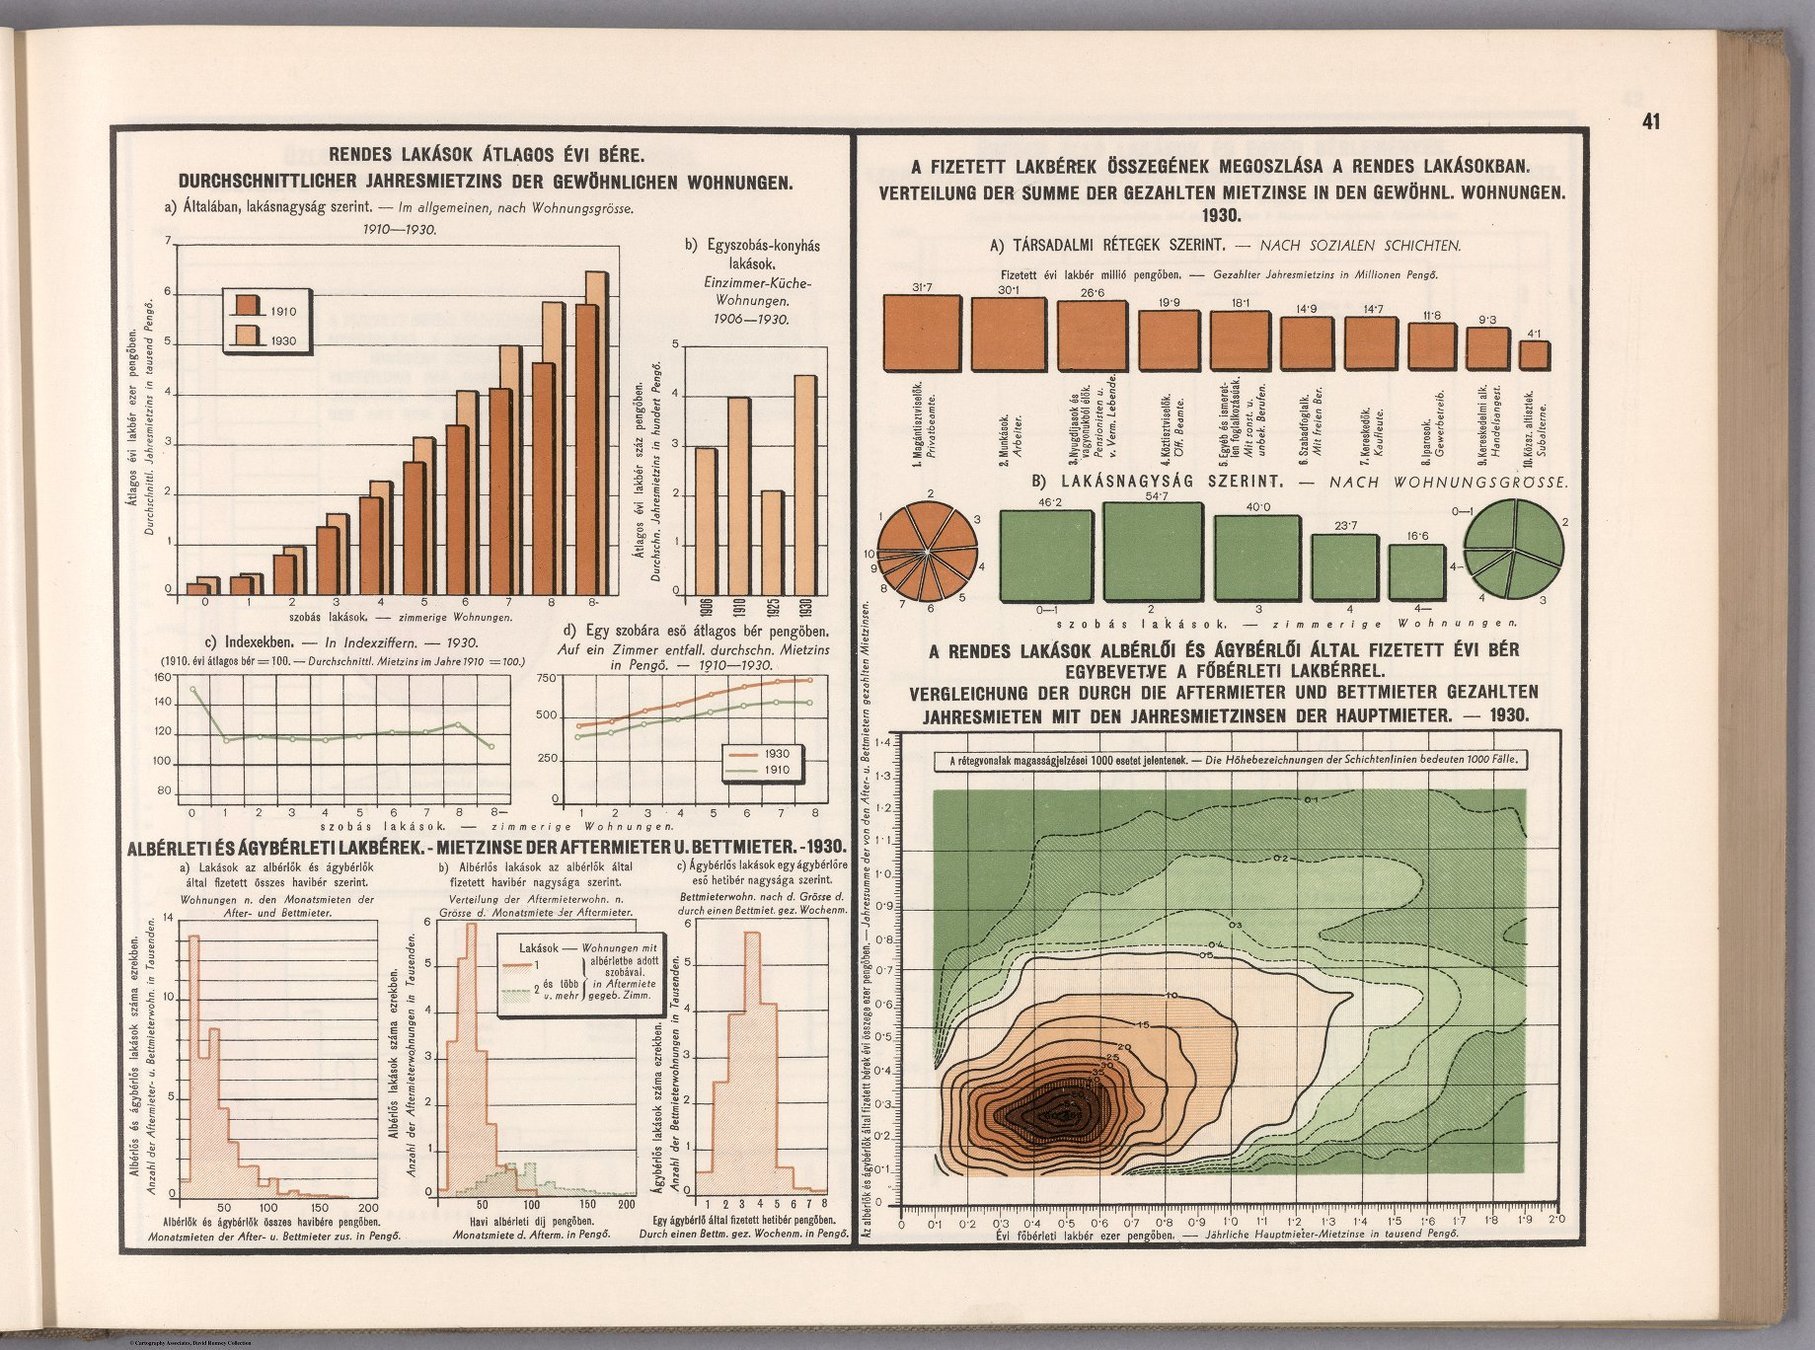
Az 1885–1895. évi budapesti építkezések. Budapesti Statisztikai Közlemények 28. Budapest: Grill Károly
József Kőrösy and the missing link towards Isotype, 1898

Willard Brinton: Graphic Methods for Presenting Facts, 1914/19


Otto és Marie Neurath, Gerd Arntz:
Gesellschaft und Wirtschaft, 1930
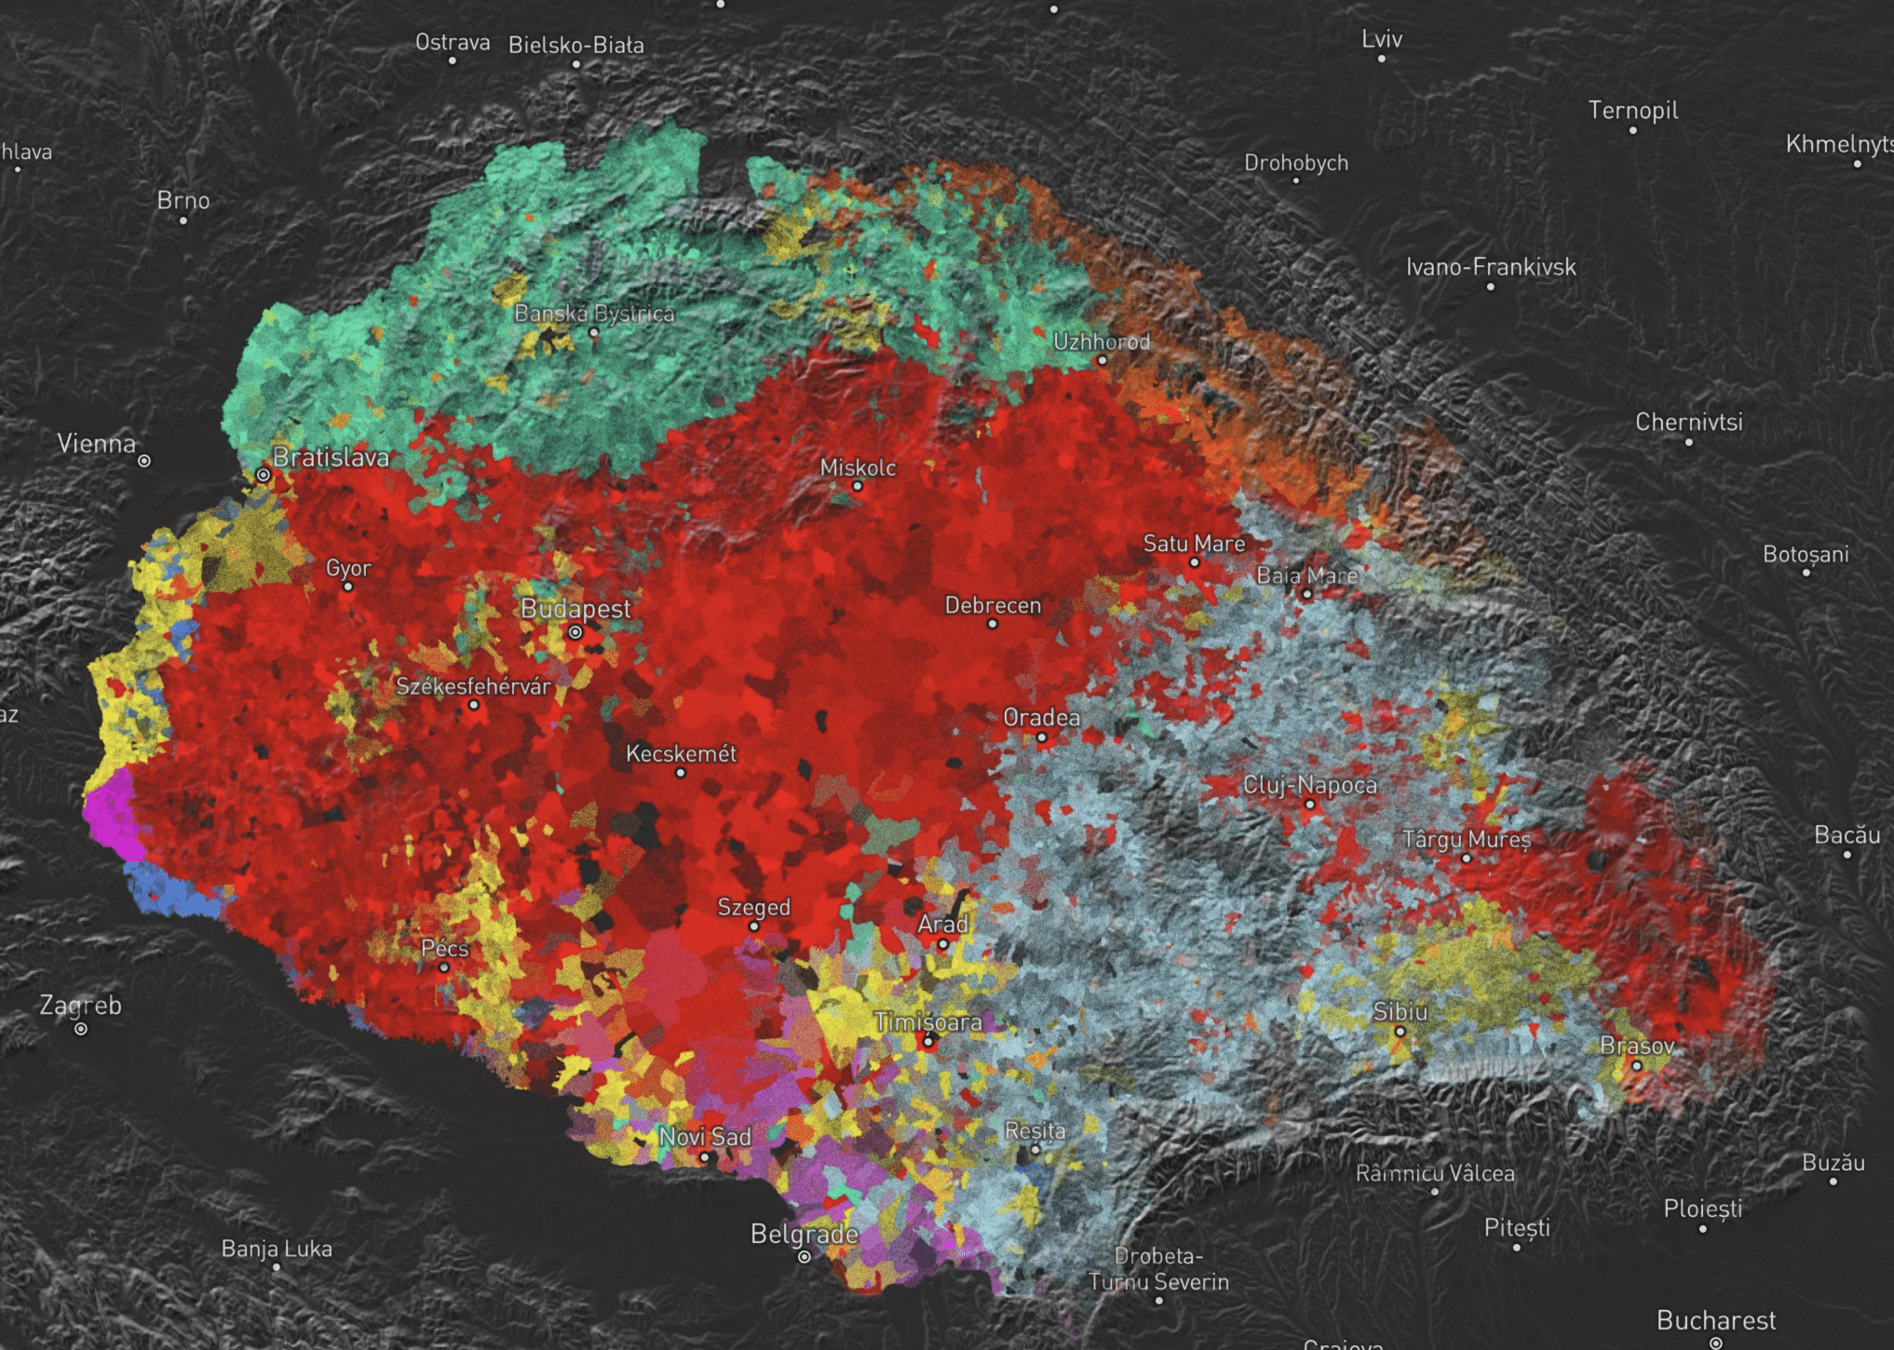
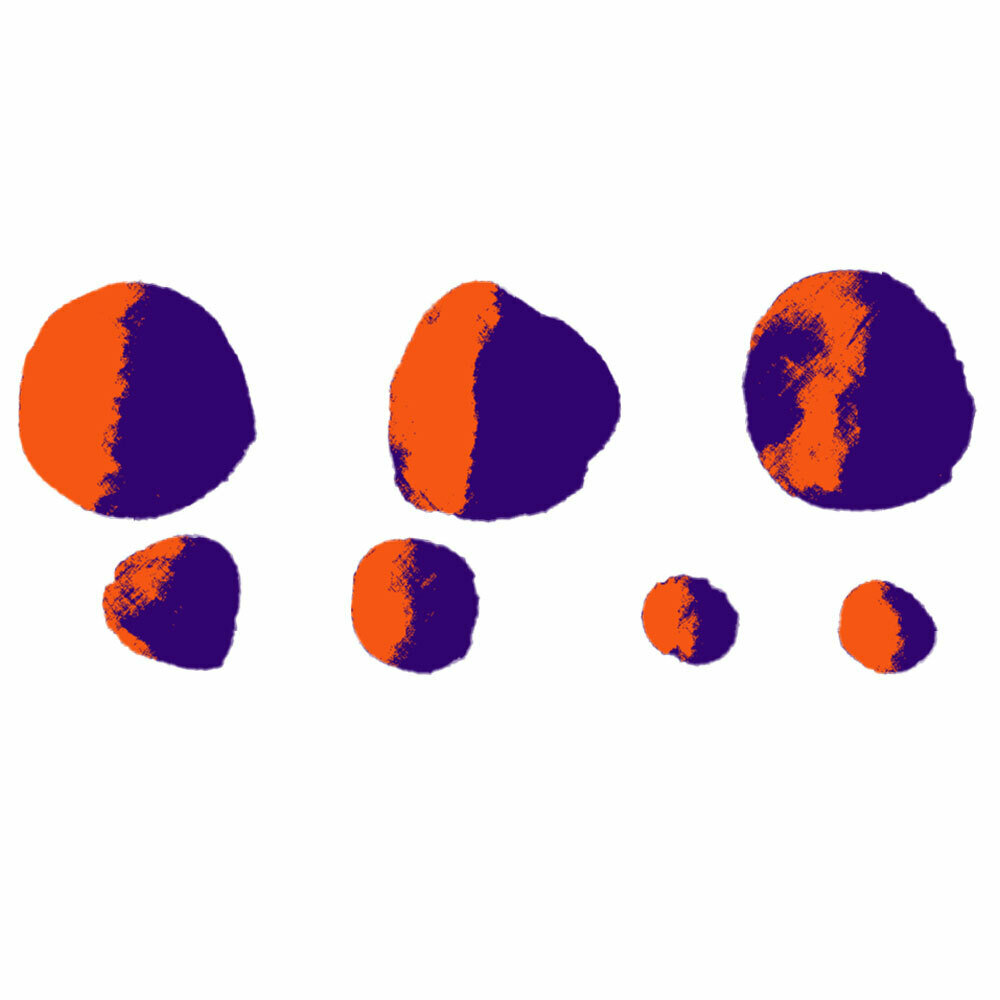
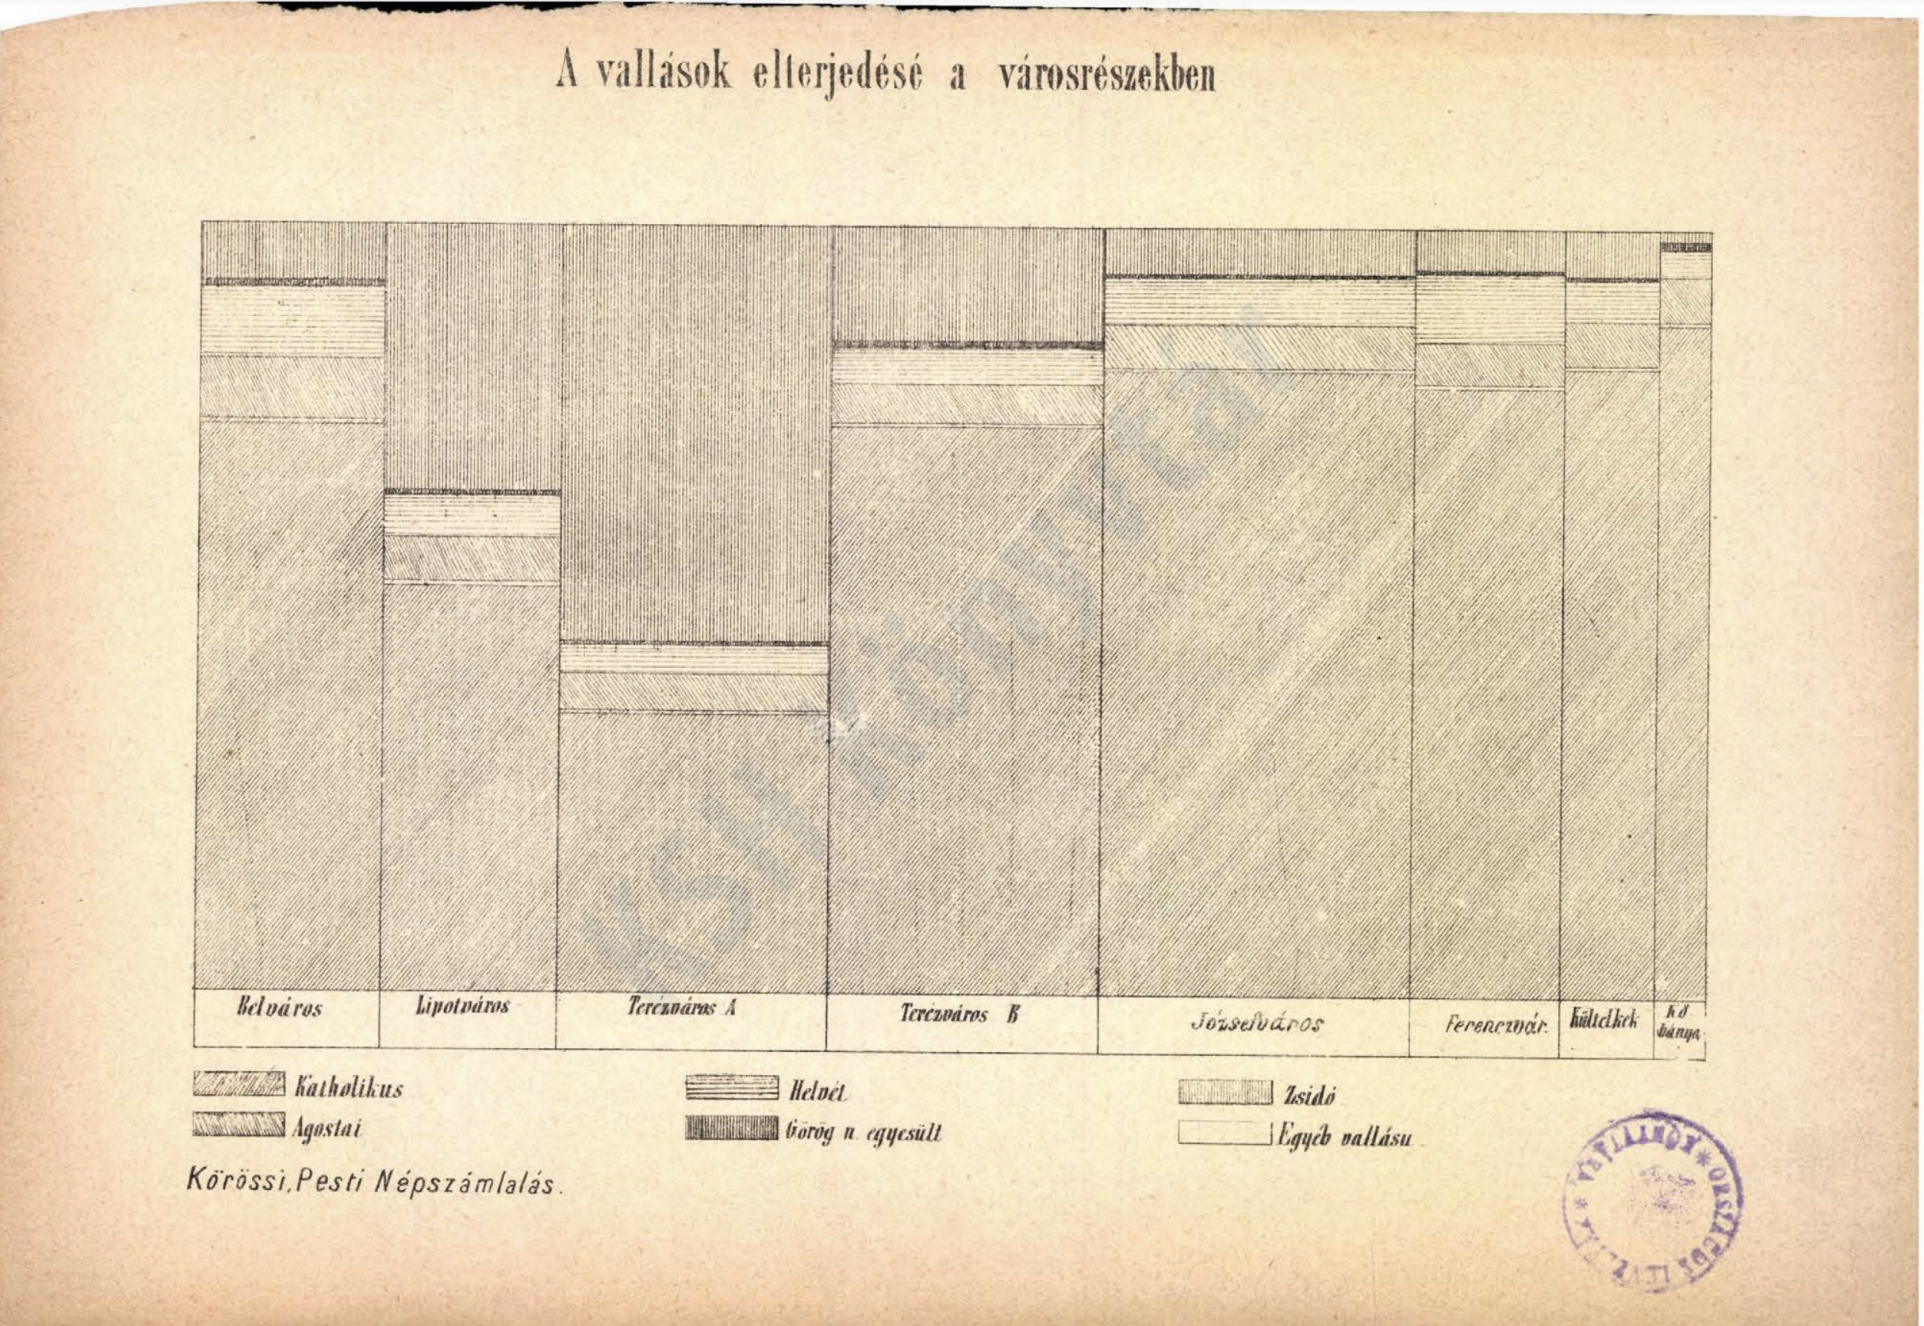
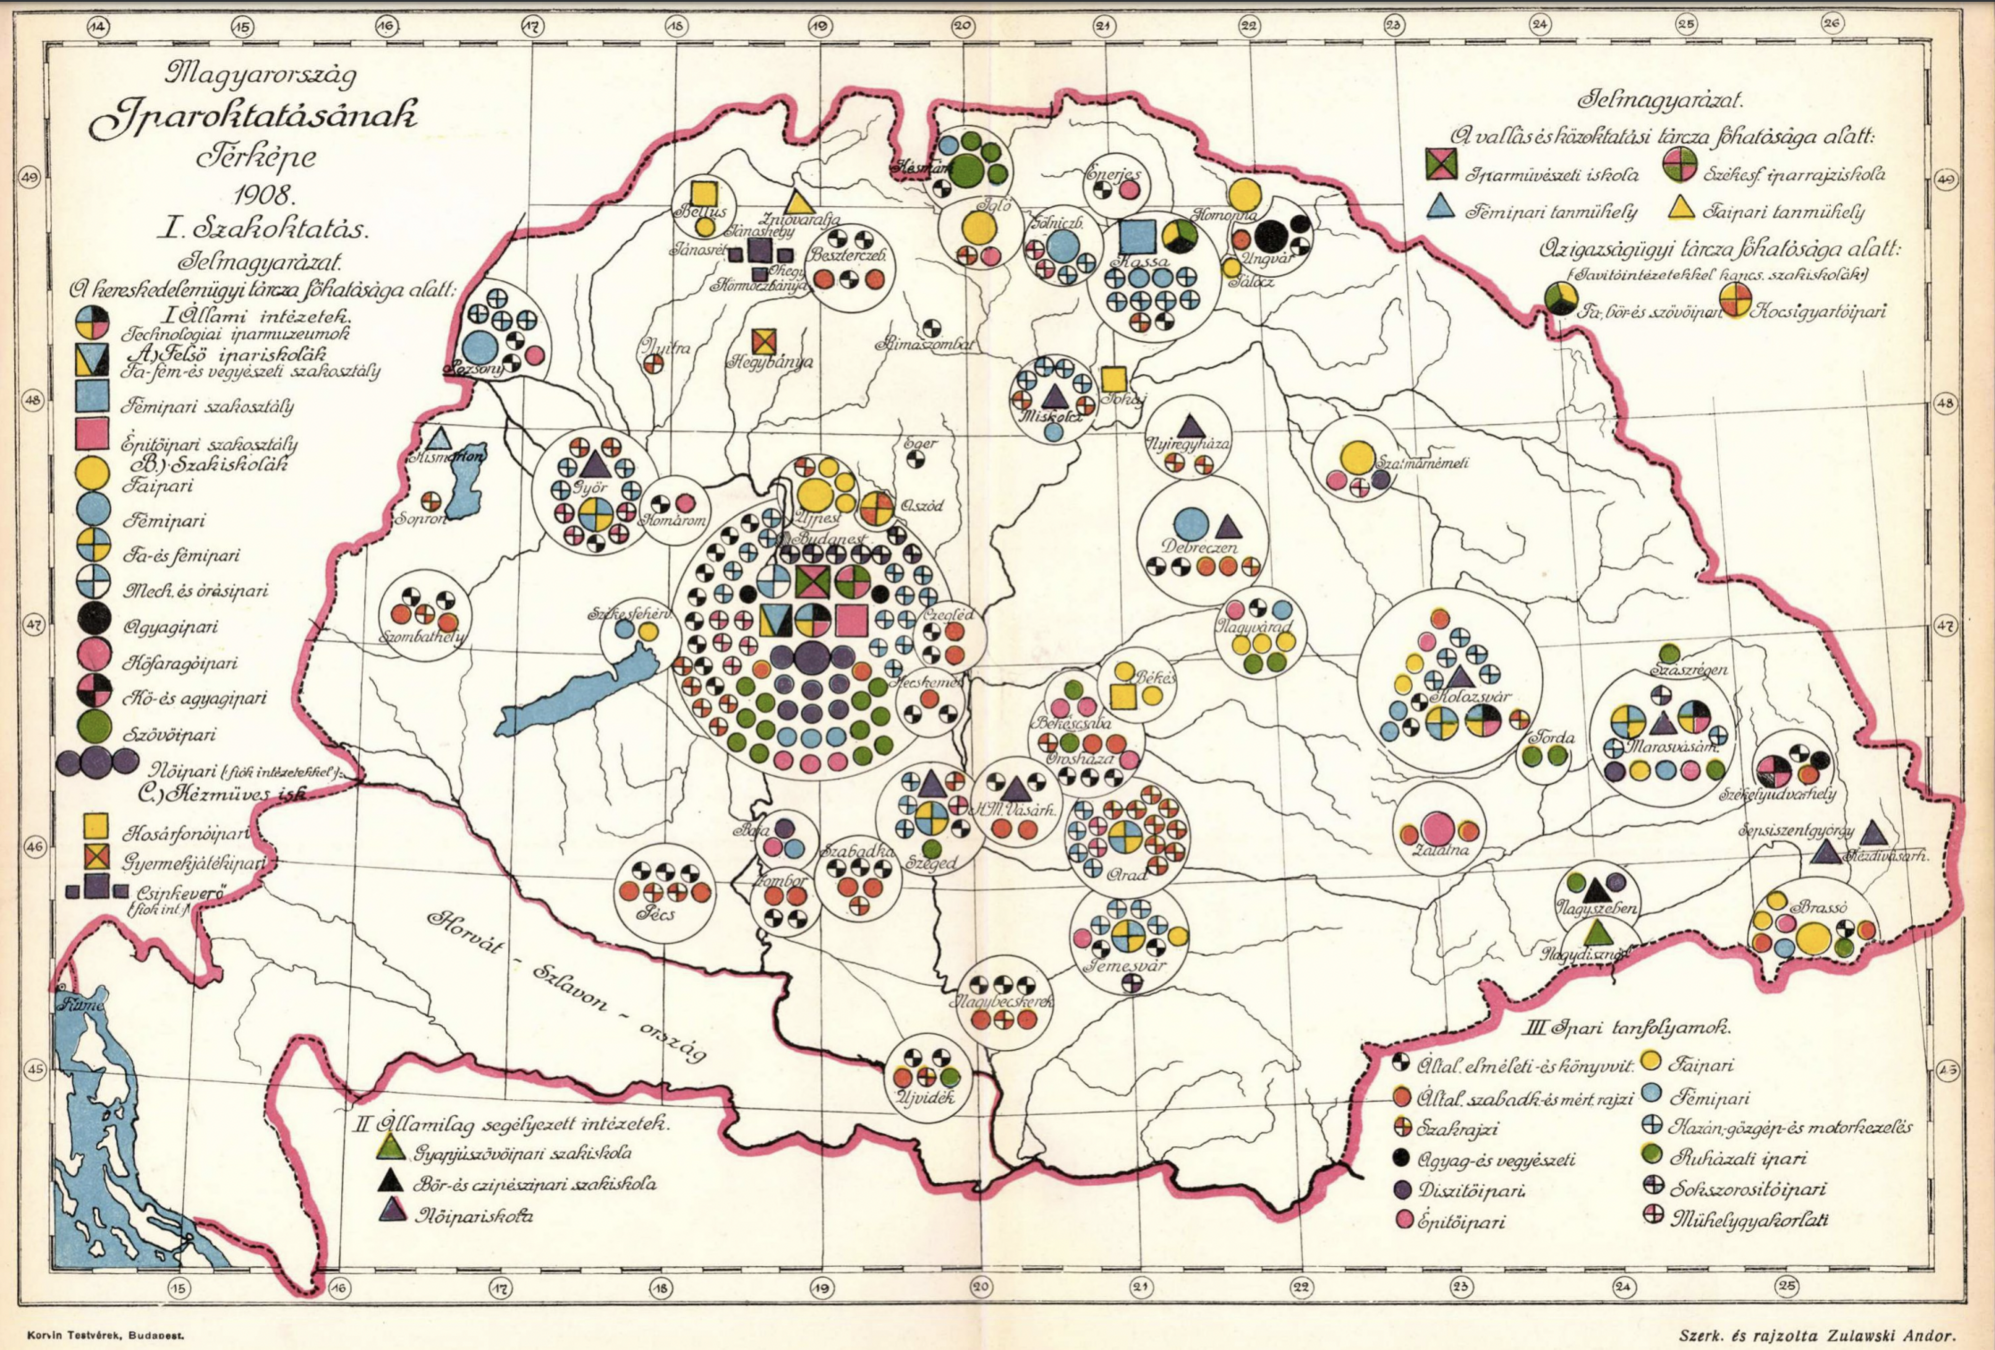
Balogh Pál – Proff Kocsárd: Magyarország fajnépei a vármegyék járásaiban, 1902

The first mosaic map, 1902
Balogh Pál – Proff Kocsárd: Magyarország fajnépei a vármegyék járásaiban, 1902
The first mosaic map, 1902

The first football-analytics, 1922-


1933
1937
1940
The first urban-statistics albums


György Markos, the first data journalist
Markos (May)? - Les trusts contre le France, 1936–37


Régards, 1938
Magyar Nemzet, 1939–41


A magyar ipar száz éve, 1941


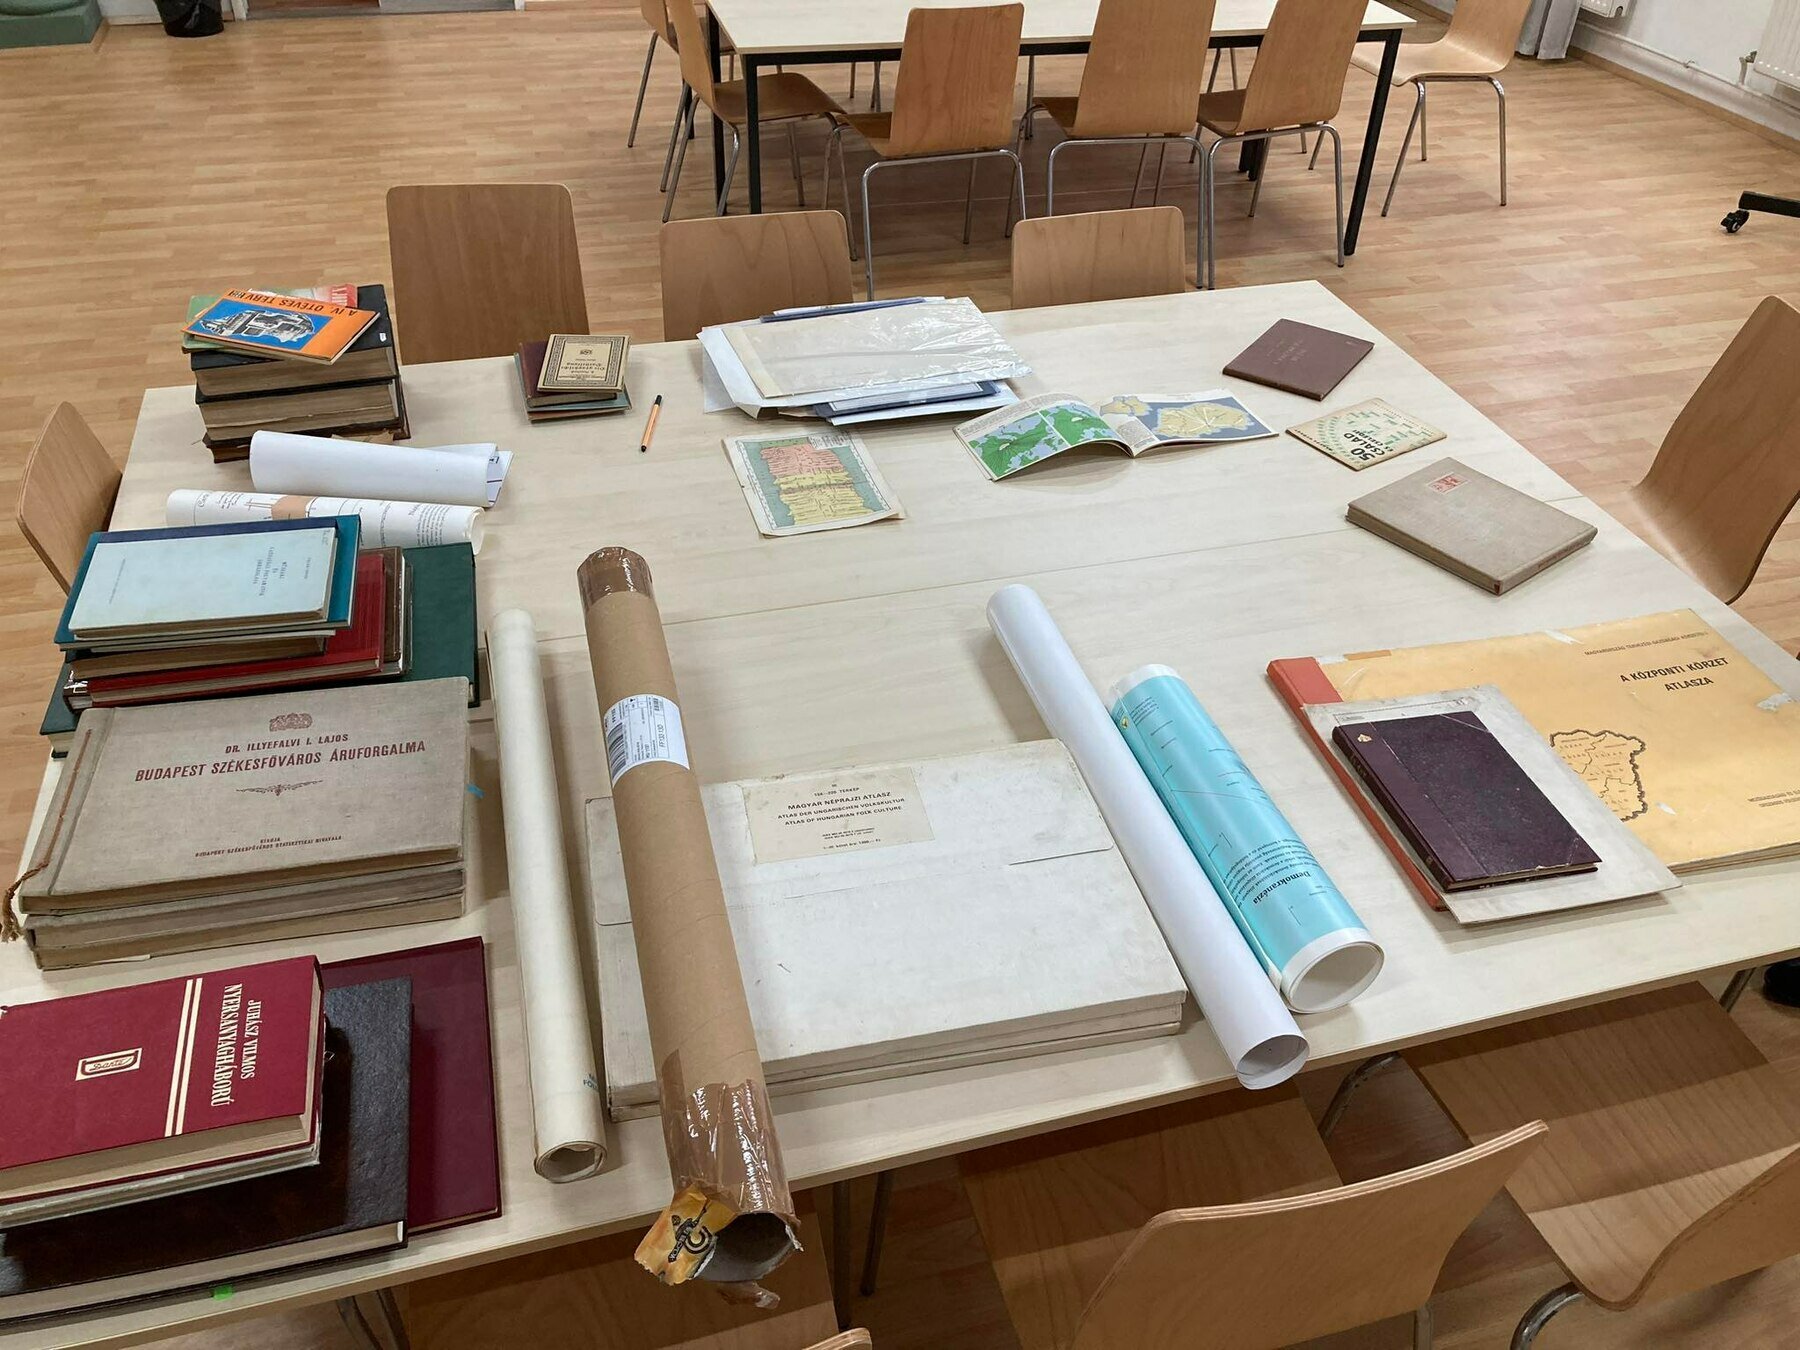
Archiving, digitization
Archiving, digitization

thank you!
batorfy.attila@btk.elte.hu
Images of Knowledge
By Attila Bátorfy


