Intro to Ganglia
Why metrics collection is important
What is a metric
- Anything quantifiable that helps understanding your system
- Its a measure of a system resource
- It may or may not have a unit
top
iostat -dmx 1
df -h
Why Collect Metrics?
Scenario 1
You feel that your systems are not performing optimally. You need to convince your manager to get new hardware. What will you do?
Scenario 2
You are bumping up density, but your DC expert warns that it can impact power utilization.
It can even cause the power supply to trip.
Why Collect Metrics
- It complements monitoring/alerting
- It allows to analyse historical trends, issues
- Identify problems (at times before they happen)
- Analyse Targets
- Decide/Define Future Goals
- Better decisions
What is Ganglia
- Its a scalable/distributed system for monitoring grids/clusters
- Allows for viewing historical statistics via a web interface
Why Use Ganglia
- Its very light on resources
- Has an interesting scalable/distributed architecture
- It comes with a set of modules/plugin which collect common metrics for linux servers, making easy to collect lot of metrices without putting lot of effort
Ganglia Architecture
Different Components used in ganglia
- gmond (ganglia monitoring daemon)
- gmetad (ganglia meta daemon)
- RRDs ( a binary timeseries db format for storing a single metric)
- Ganglia web frontend (interface to visualize the data)
- gmetric utility for submitting random metrics
Ganglia Architecture
Gmond
- Lightweight threaded daemon
- Collects metrics periodically on system
- Listens to udp channel and writes collected metrics in-memory hash table
- Gmond can unicast/multicast data over to other gmond nodes in XDR format
- The data is only pushed, if there is a change in value or it crosses a time threshold
- Gmond nodes can also announce this data when queried as an xml output to trusted hosts (gmetad)
- 16+ 136*n_nodes +364*n_metrics bytes total memory utilization
Gmond Architecture

Gmetad
- Gmetad is the daemon which polls the xml which gmond/gmetad announces
telnet <master_gmond_ip> 8649 - It can do so only if it is in the trusted_host list
- Gmetad writes this data to a RRD database
- Ganglia frontend queries gmetad to find relevant metrics
Gmetric
- Simple utility to submit metric to gmond on the server
- You can also write modules for gmond in python/c
- Using gmetric can be slow but its simpler
- To simply collect a metric write a cronjob for a gmetric script depending upon the frequency
#!/bin/bash
#metric to get count of total entries in the tables app
value=`mysql --database=demo -BNe "select count(*) from tbl_msg;"`
/usr/bin/gmetric --name "Message count" --value $value --type "uint16" --unit "entries" --group "messageboard app"
RRDTool
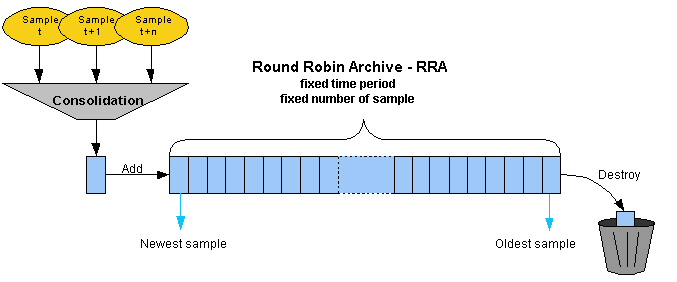
- RRDTool writes metrics submitted to a round robin database, which ensures a constant footprint of a metrics
- It is used by many metric collection utilities like cacti, ganglia etc. , since it has bindings in most of the languages
- It also provides tools to generate graphs
- RRD use multiple RRAs to store the data of different time periods, it uses a consolidating function to consolidate data for one RRA to another.
- gmetad uses rrdcached to cache the input data before flushing it to disk to optimize io
RRDtool

Ganglia Frontend
- Visualize your collected metrices
- Aggregates data trends from gmetad
- You can search/consolidate various graphs using various RRD sources
- Compare values between different nodes
ab -n 4000 -c 24 http:///<load_balancer_ip>/ Resources
- Architecture: http://www.msg.ucsf.edu/local/ganglia/ganglia_docs/introduction.html
- Gmetric: http://www.msg.ucsf.edu/local/ganglia/ganglia_docs/usage.html#GMETRIC-USAGE
- rrdtool : http://oss.oetiker.ch/rrdtool/tut/rrd-beginners.en.html
Intro to Ganglia
By Ayush Goyal
Intro to Ganglia
- 2,080


