Ice/ocean interaction
Ben Galton-Fenzi
Australian Antarctic Division
Ben.Galton-Fenzi@aad.gov.au
overview
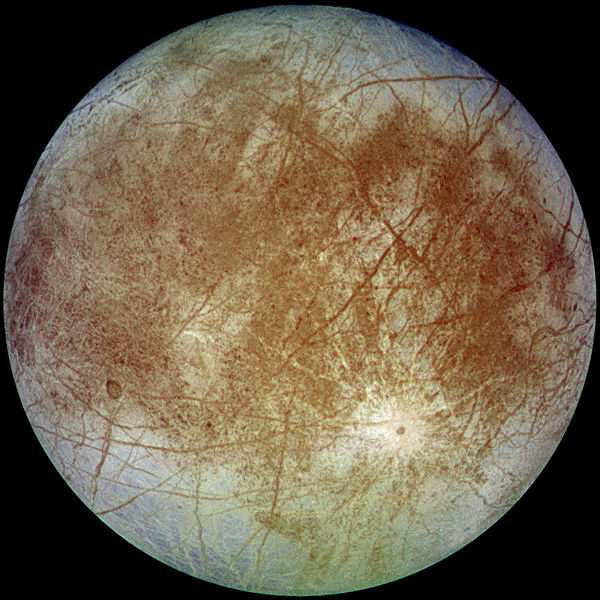
- Motivation
- Calculating basal melt rates
- Large-scale: insights into East Antarctica
- Small-scale: melting and freezing
- Practical
MOTIVATION
Sea level projections and observations
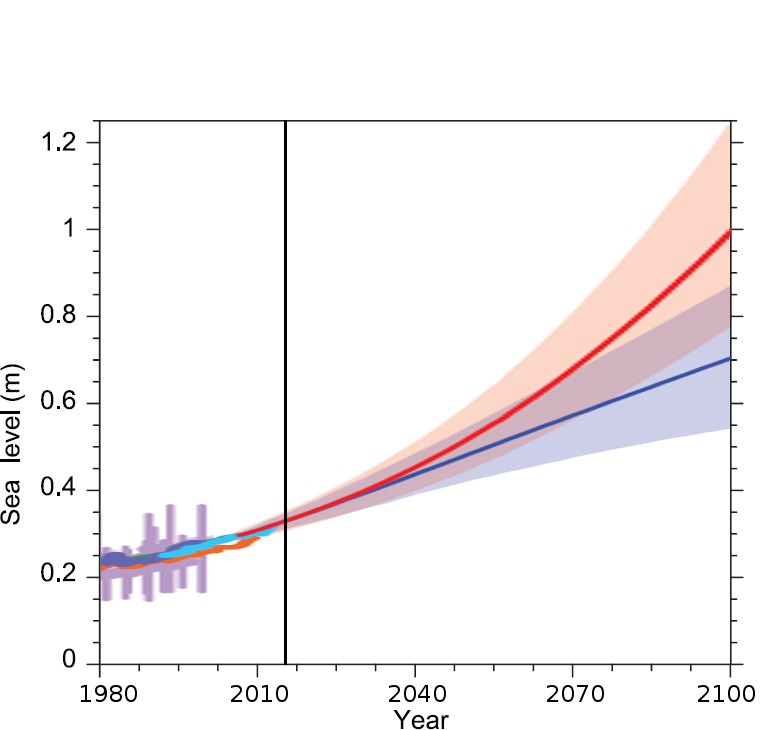
IPCC, AR5, 2013
"Larger sea level rise could result from sustained mass loss by ice sheets, and some part of the mass loss might be irreversible."
"Current evidence and understanding do not allow a quantification of either the timing of its onset or of the magnitude of its multi-century contribution."
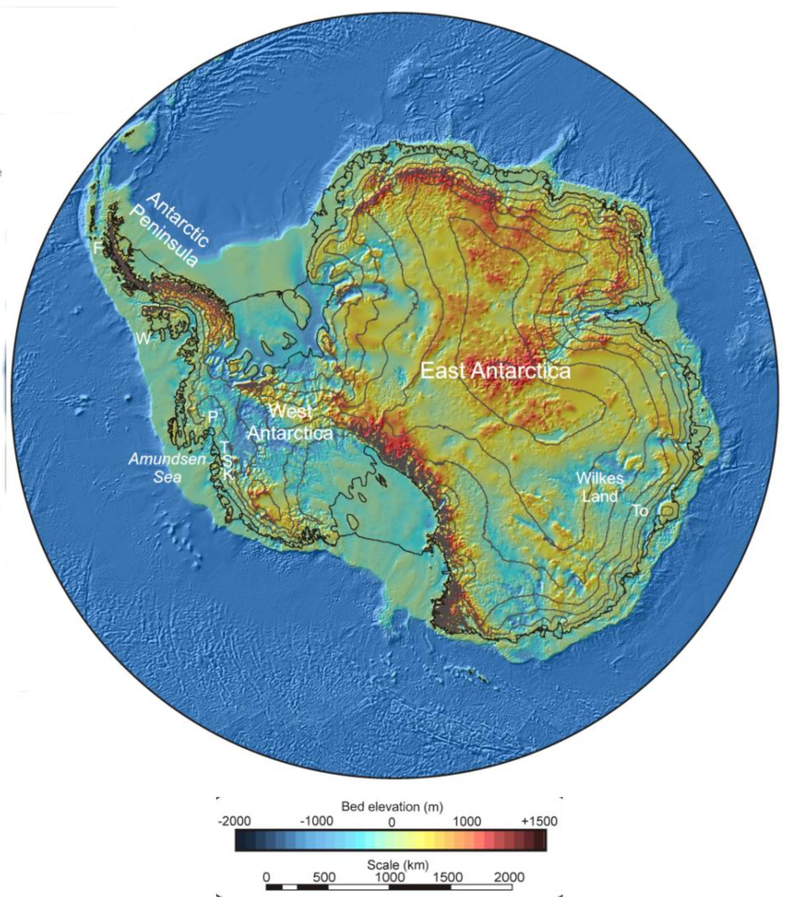
Ocean impact
- Sea level 58.3 m
- Marine based ice sheet
- EAIS sle 19.2 m
- WAIS sle 3.4 m
- Cooling of 1.4 °C
- Freshening of 0.7 g kg-1
marine ice sheet instability
Fretwell et al. 2014
WAIS: Pine island glacier
-
+ve feedback due to depth dependence on freezing point
-
Favier et al. 2014
East antarctic ice plug
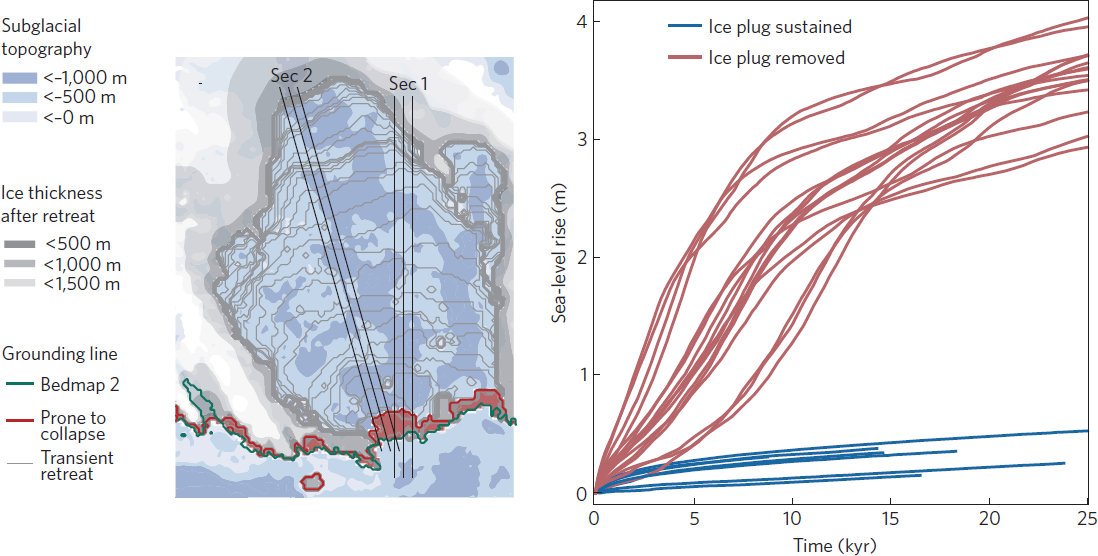
-
Different retreat mechanism related to calving
-
Mengel & Levermann 2014
ice shelf mass budget
observations of mass budget
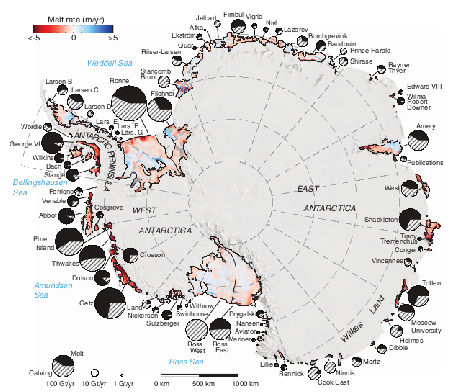
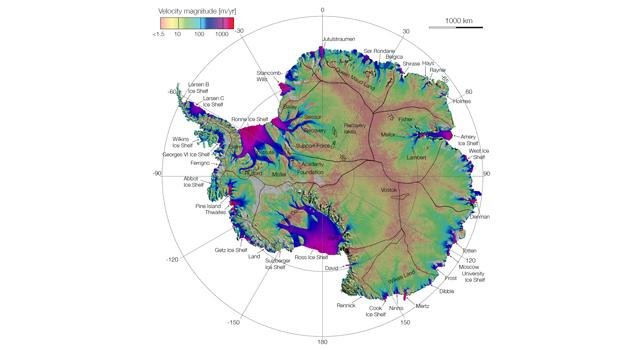
Rignot et al. (2013)
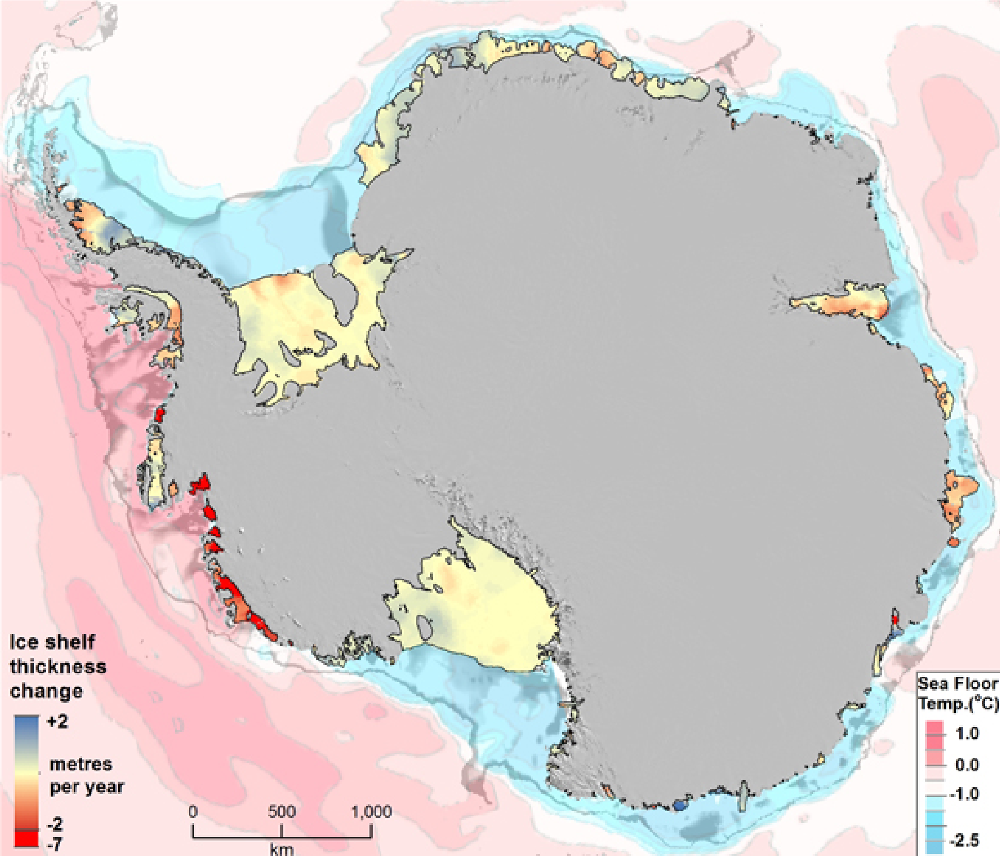
- Pritchard et al. 2012
Many ice shelves are thinning (2003-2009)
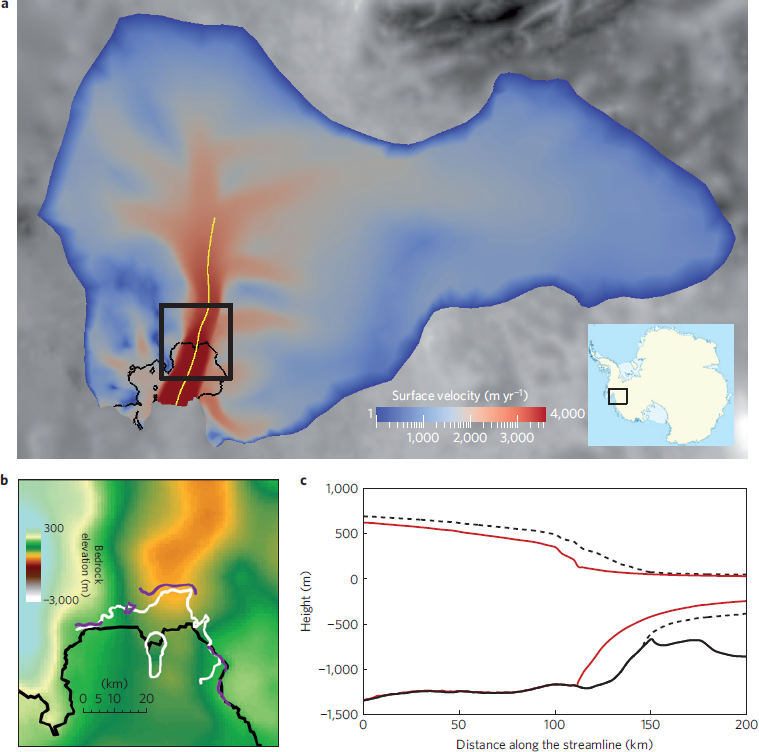
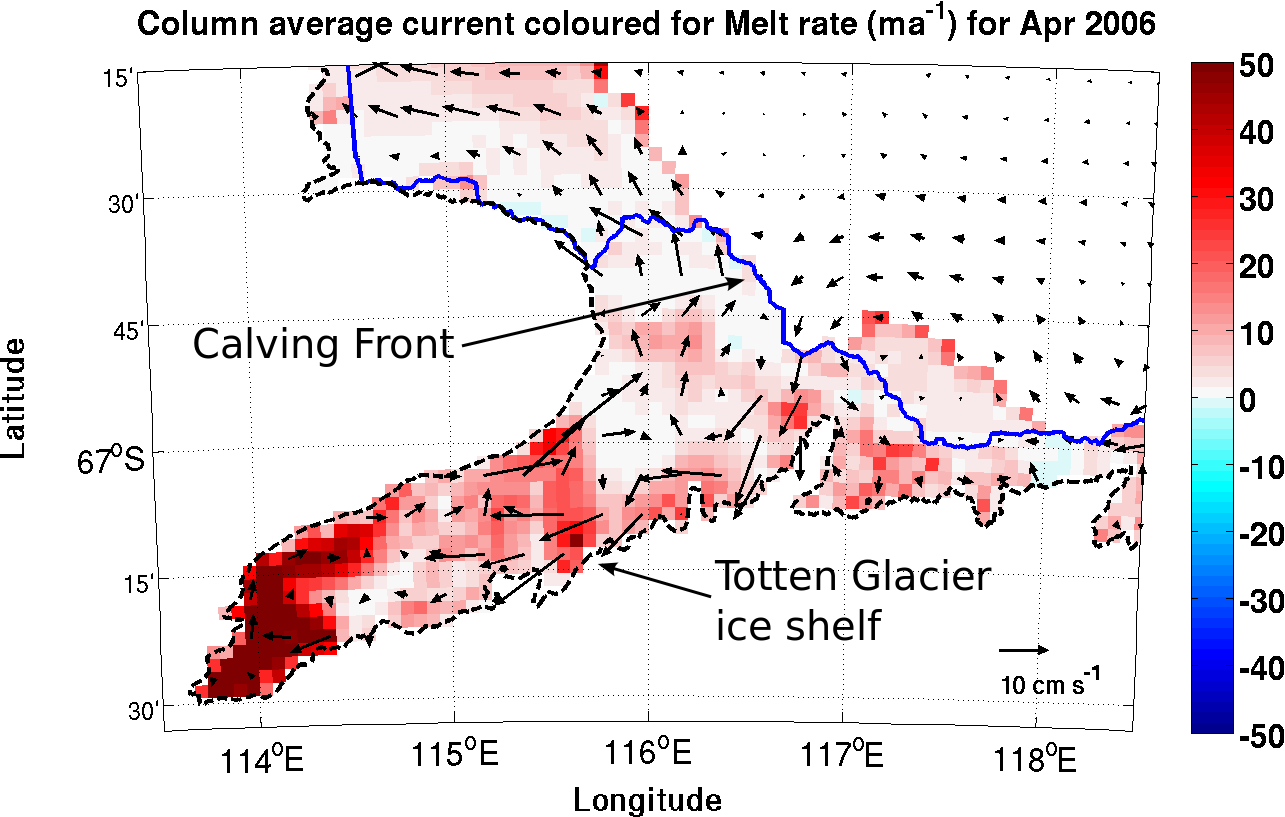
rapid thinning of totten

Totten Model results
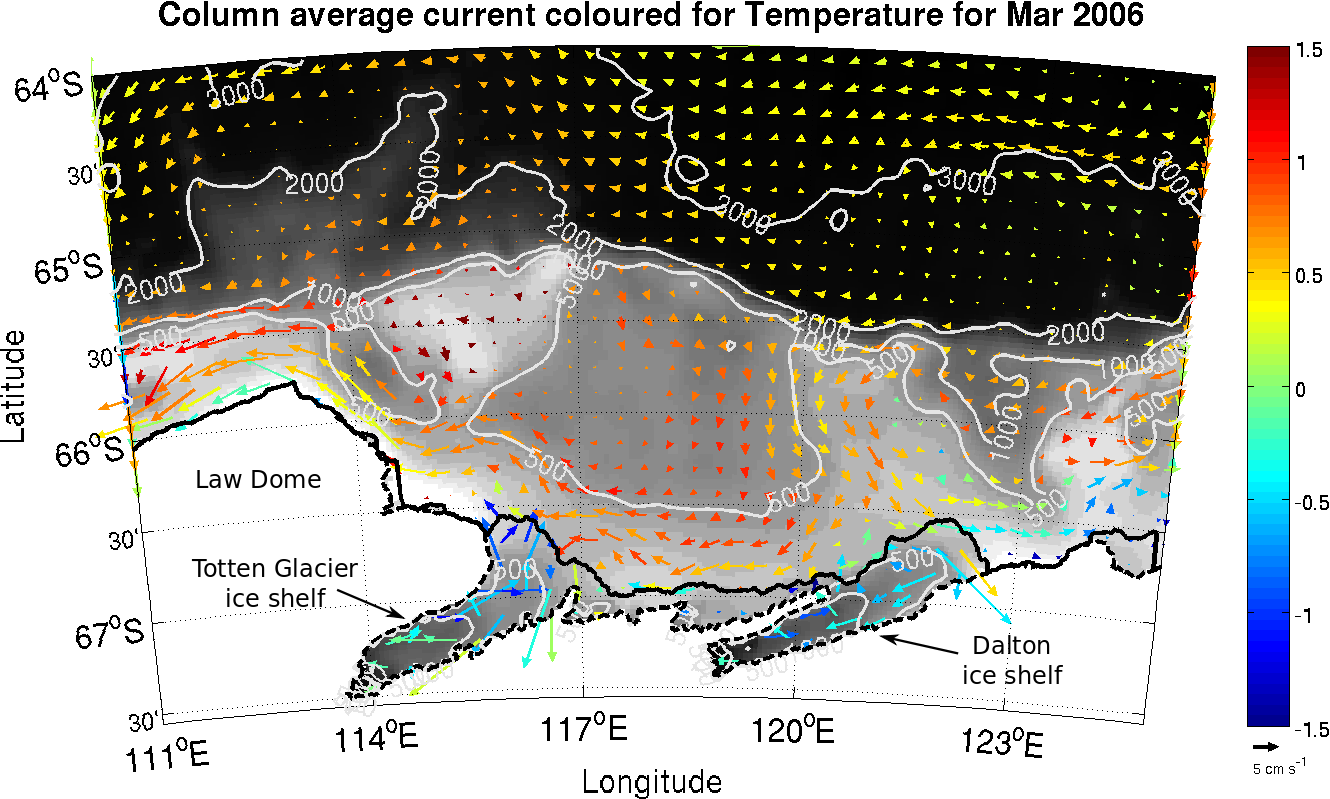
- Warm water drives high melting of deep ice (~2000 m below MSL)
- Mean melt rates ~60 % of glacier flux
- Gwyther et al. 2014. Ocean Sci.
calculation of basal melt rate
calculation of basal melt rate
where,
H = thickness
u = velocity
a = accumulation rate
m = basal melt rate
\frac{\partial H}{\partial t} + \bigtriangledown(H u) = a + m
- Many ice shelves are thinning (2003-2009)
- Pritchard et al. 2012
\frac{\partial H}{\partial t}
http://www.jpl.nasa.gov/video/details.php?id=1015
Rignot et al. (2013)
u
H
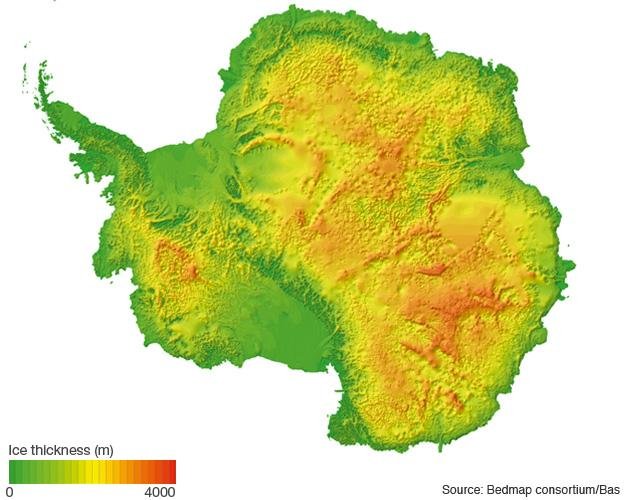
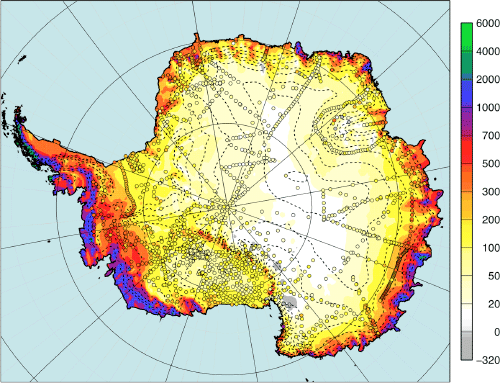
BEDMAP consortium (Fretwell et al. 2013)
a
- RACMO atmospheric model
- van den Berg et al. (2008)
calculation of basal melt rate
where,
H = thickness
u = velocity
a = accumulation rate
m = basal melt rate
m = \frac{\partial H}{\partial t} + \bigtriangledown(H u) - a
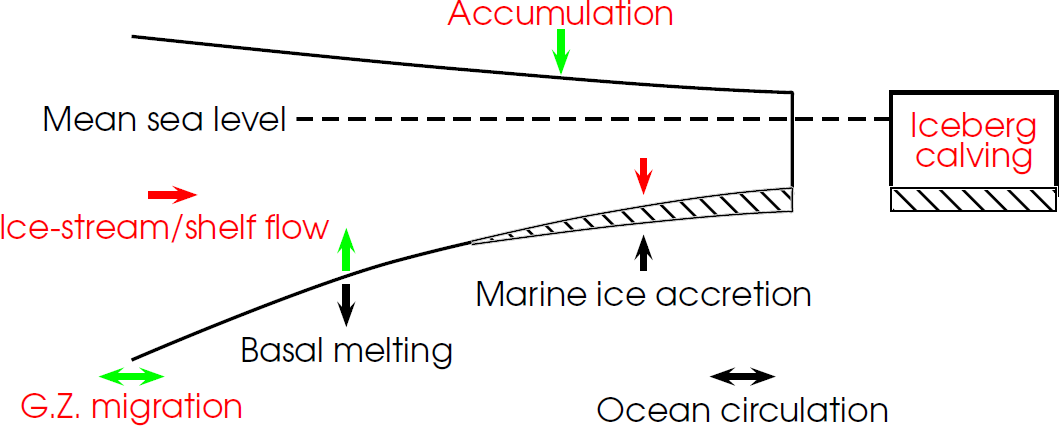
lARGE-SCALE
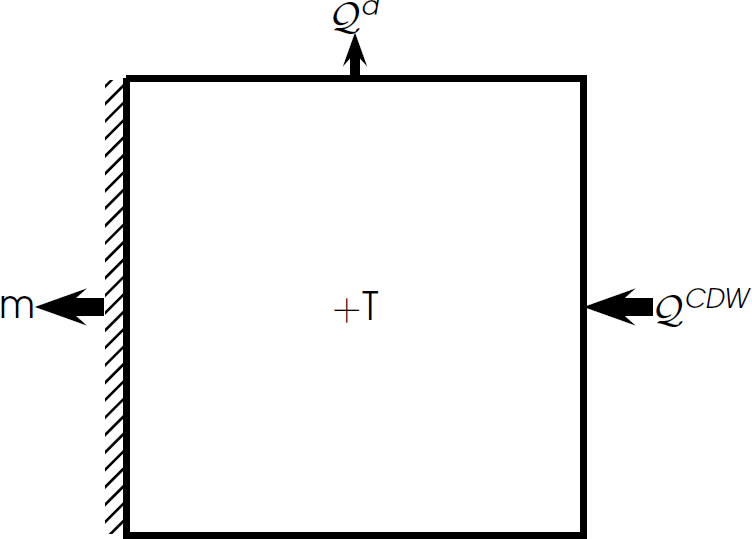
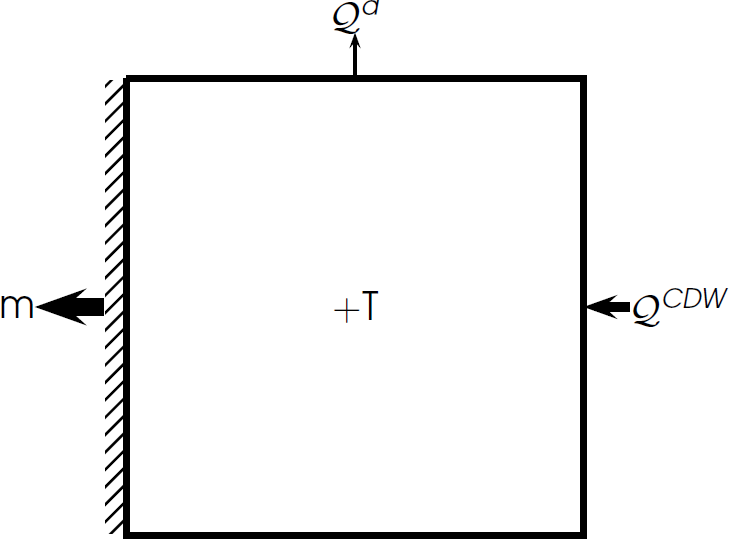
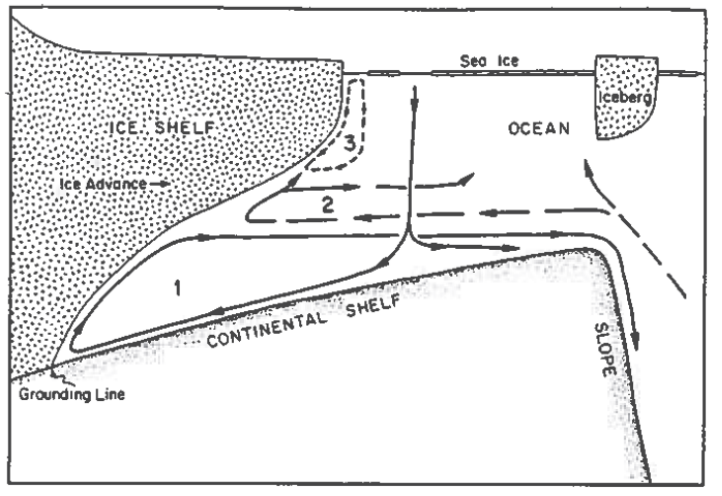
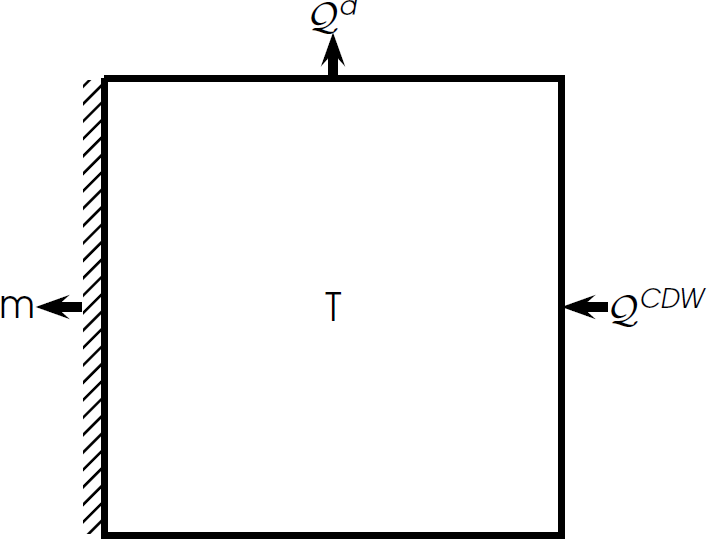
SKETCH OF HEAT FLUX DRIVING ICE SHELF MELT

increased ocean heat = increased melt
e.g. Pine Island Glacier (Jacobs et al., 2011)
SENSITIVITY to winds and mixing
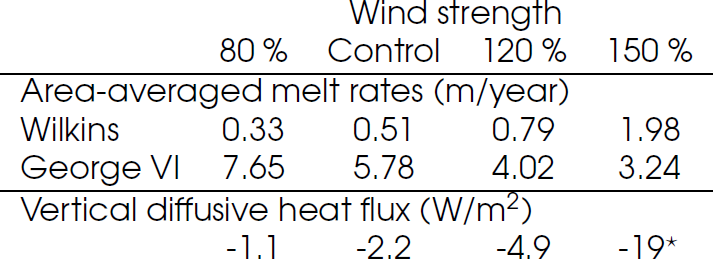
- Range of measured estimates (1–5 W/m2)
- ⋆ model blowup
- Dinniman et al. 2012. J. Clim.
Sensitivity to wind: Fimbul ice shelf model results
- Weaker winds = increased melting of deep ice
- Hattermann et al. 2013. Ocean Mod.
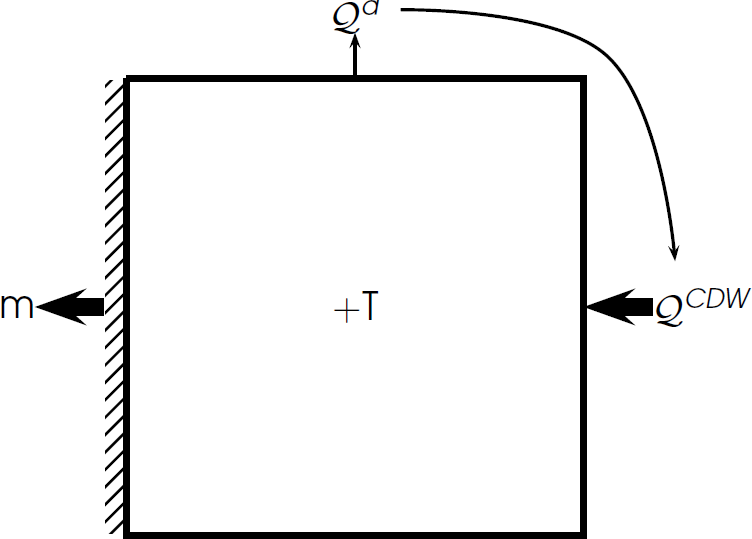
Increased winds = increased ocean heat flux

Increased flux of CDW onshelf
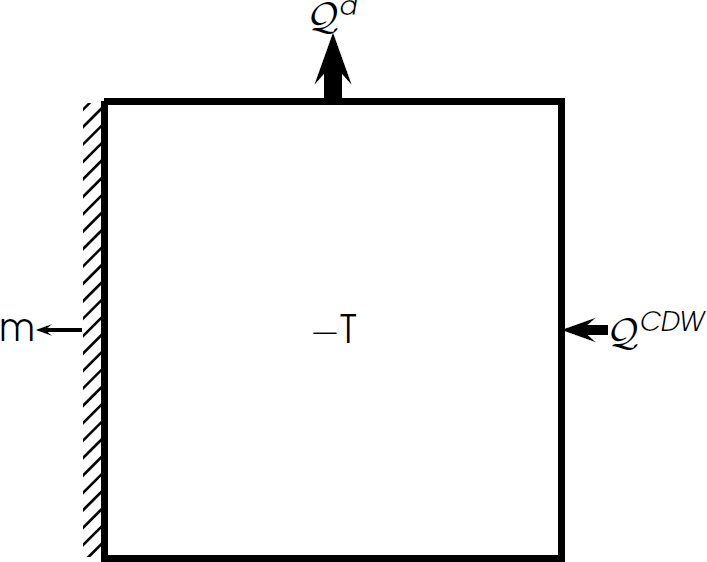
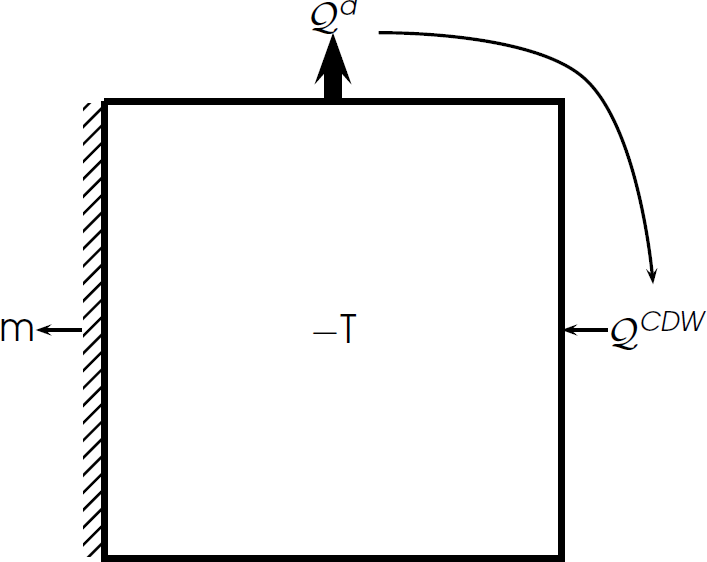
Decreased winds = increased ocean heat flux

Decreased mixing leads to warmer CDW
Decreased atmos. heat loss = increased melt
increased ATMOS. HEAT LOSS = INCREASED MELT
- Mertz Glacier Tongue (Cougnon et al., Oct 2013)
- Totten Glacier (Khazendar et al., Dec 2013)
Mertz polynya-melt relationship
Cougnon et a. 2013. JGR – Oceans
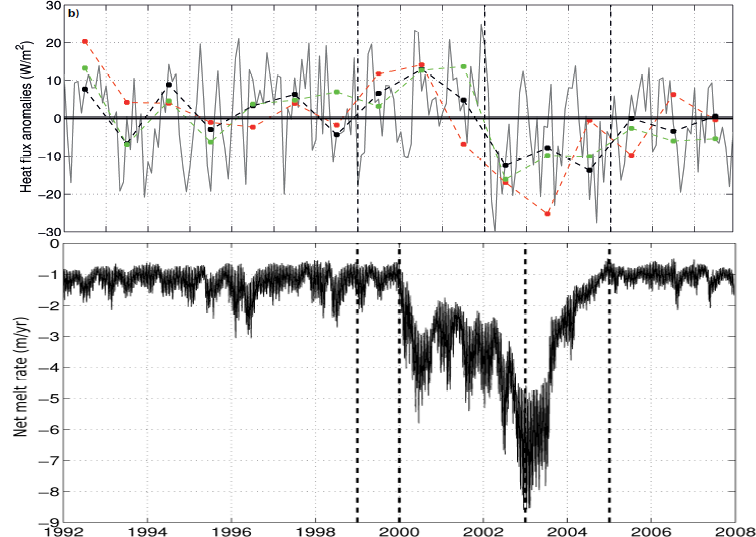
Totten thinning possibly due to polynya change
Khazendar et al. (2013)
modes of melting: jacobs (1992)
Decreased polynya = decreased melt?
Ronne-Filchner (Nicholls, 1997)
filchner-ronne observations
Decreased polynya = cooler sub-ice-shelf ocean
In absence of additional forcing
Redirection of warm water inflow
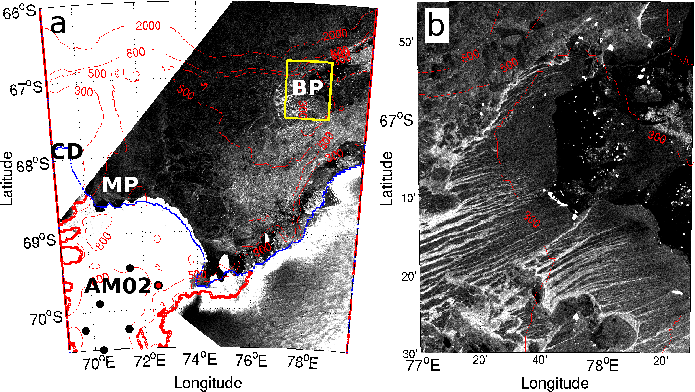
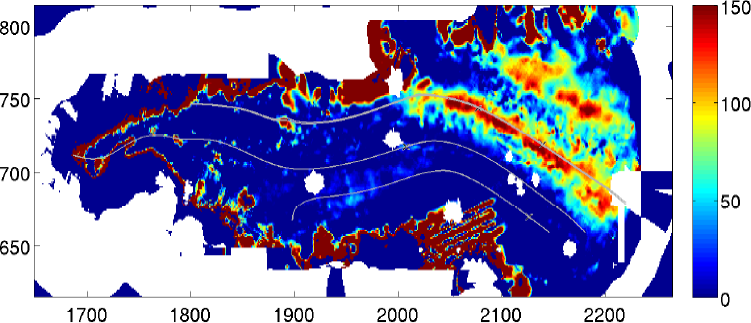
150 m grid spacing Envisat Advanced Synthetic Aperture Radar (ASAR) image from 28 August 2009 and the approximate location of the Barrier Polynya (BP), enlarged (b) and MacKenzie Polynya (MP)
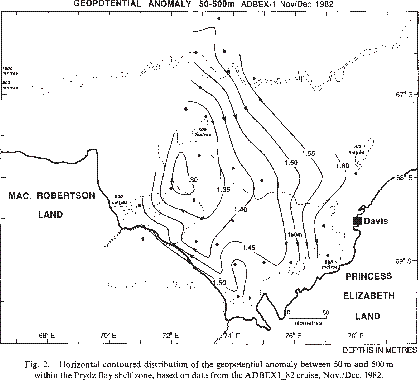
Prydz Bay Gyre (e.g. Nunes Vaz and Lennon, 1996)
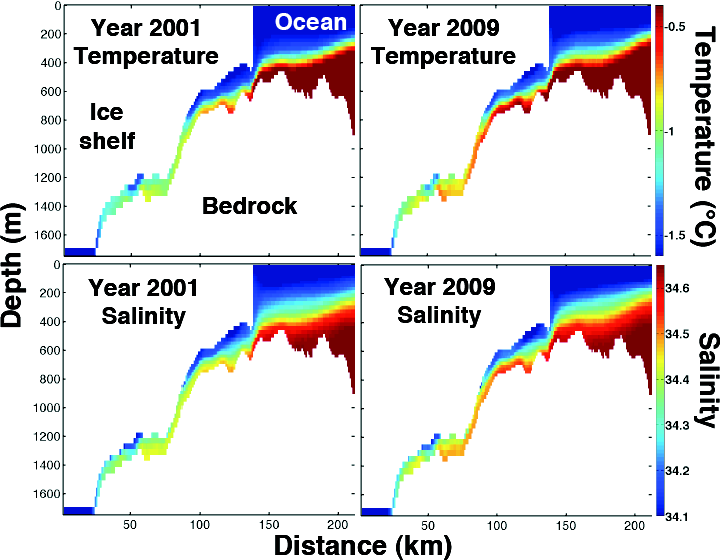
model results
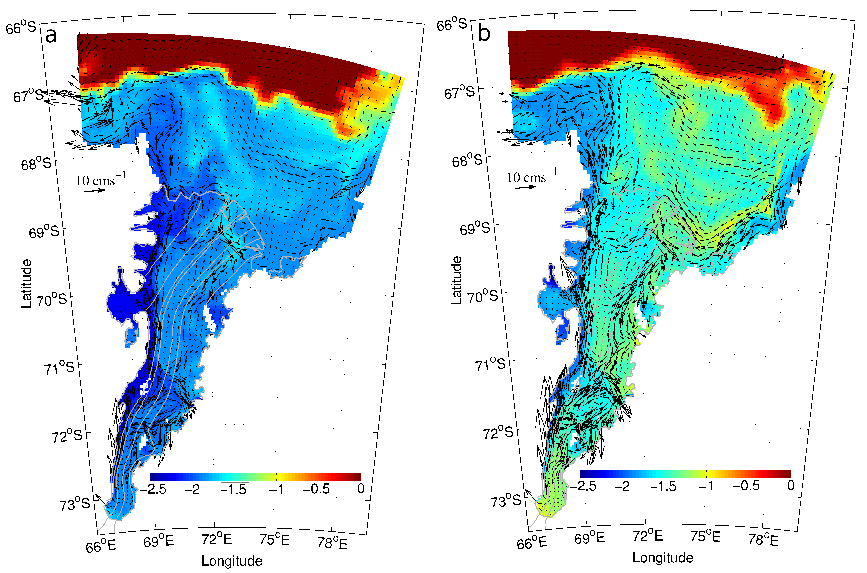
- Left (0.74 m/year) mid-winter snapshot
- Right (1.35 m/year) BP intensity reduced by 90%
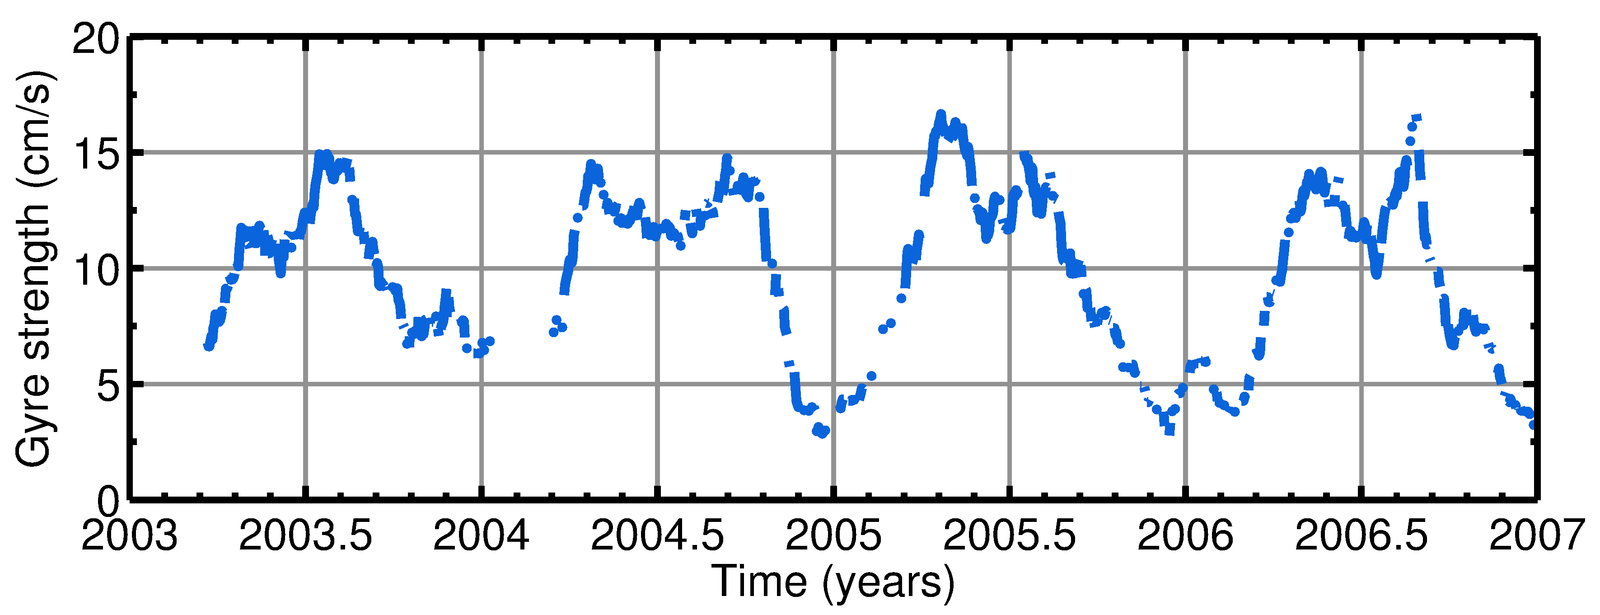
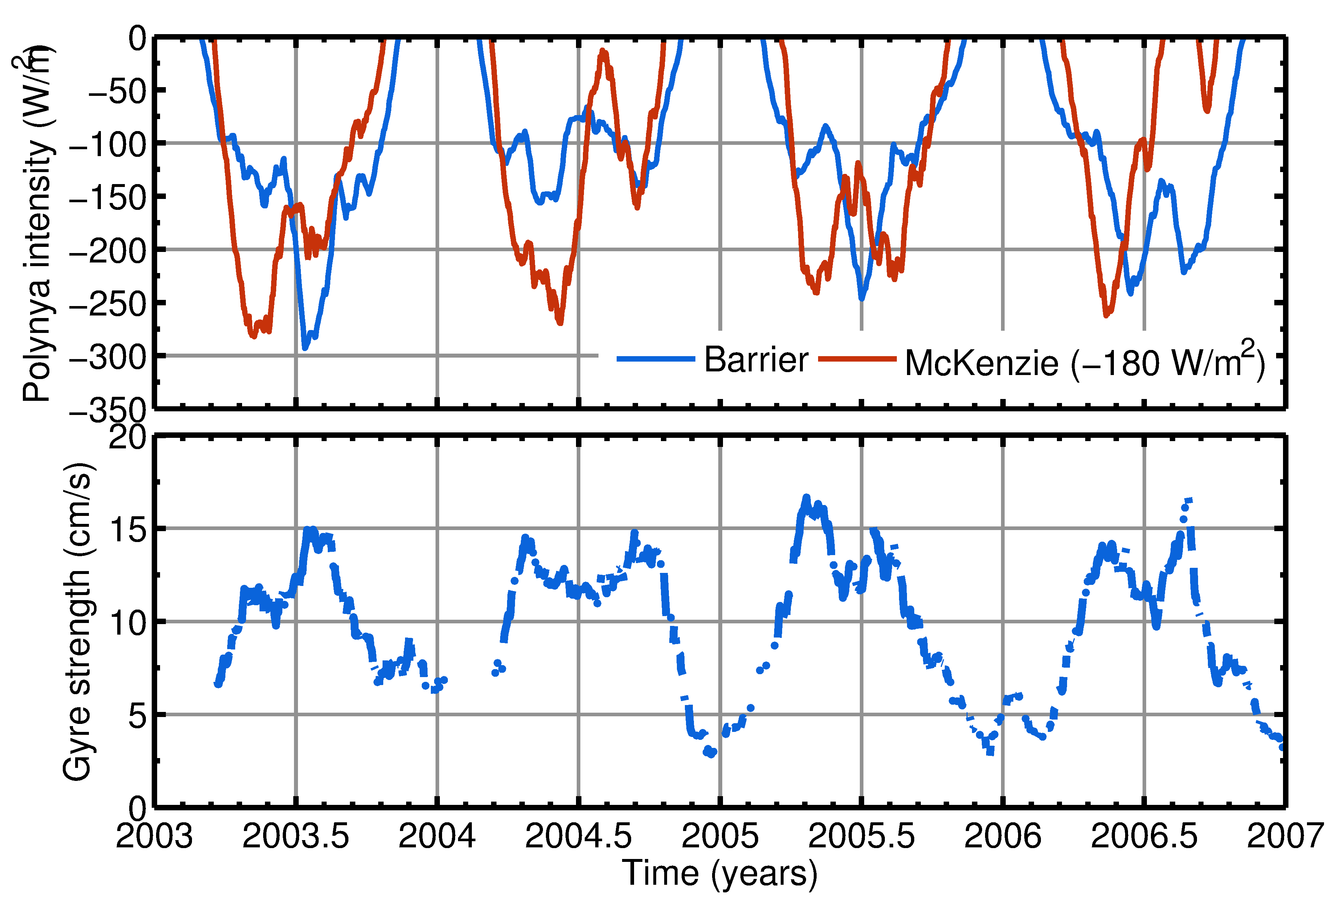
Sea ice motion proxy for ocean circulation
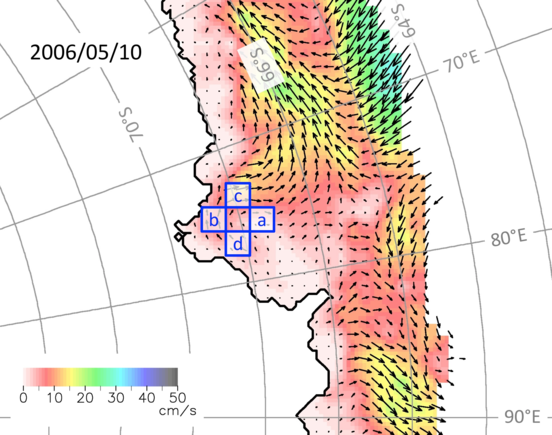
- Ice motion primarily due to ocean circulation (Heil & Allison, 1999; Holland & Kwok 2012)
- 37.5 km grid AMSR-E-derived daily sea ice velocities (Kimura & Wakatsuchi, 2011)
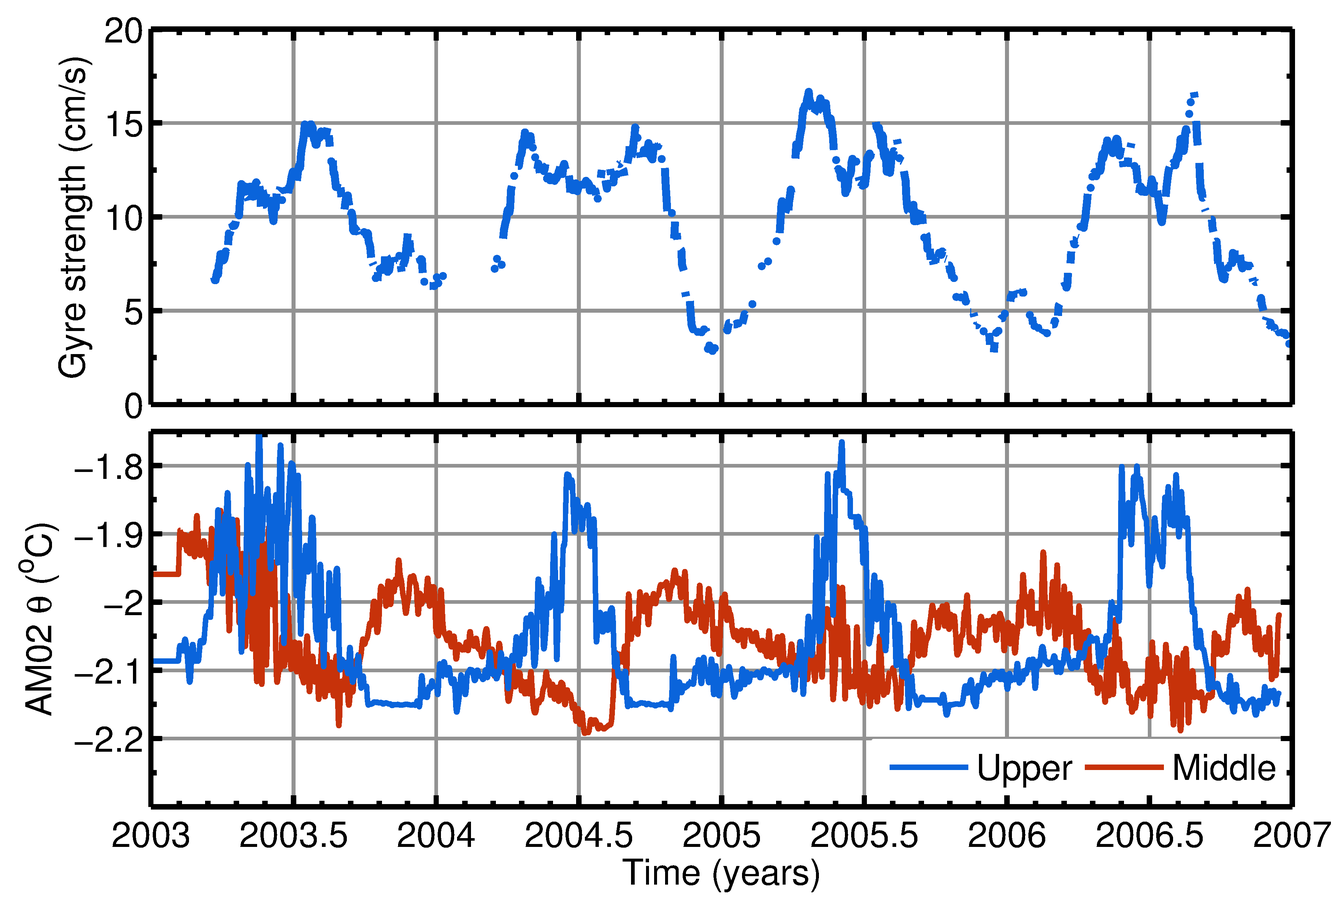
Gyre strength
Polynya intensity (Top panel; Tamura et al., 2008)
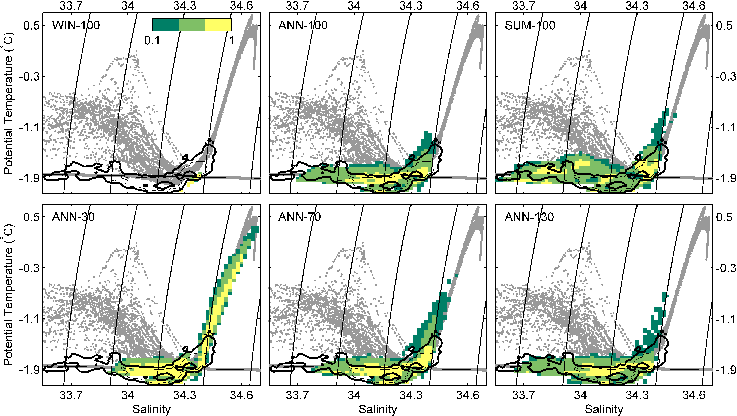
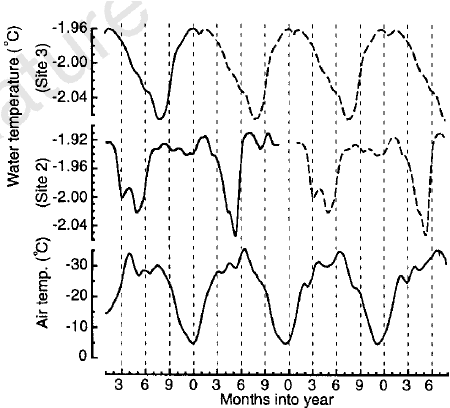
IN SITU obs. warmer than -1.9 C (red)
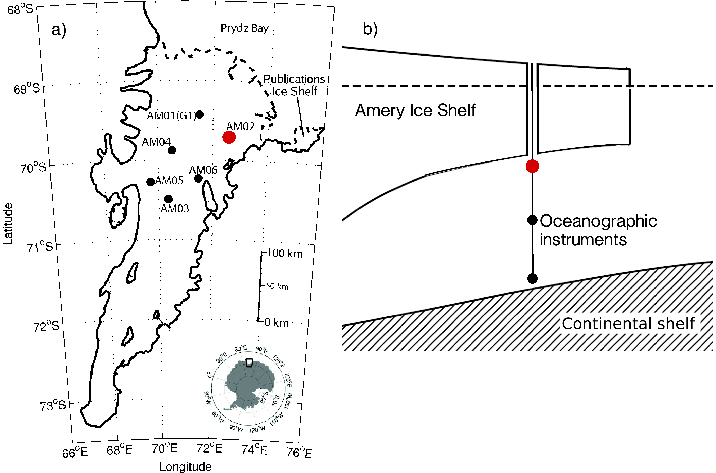
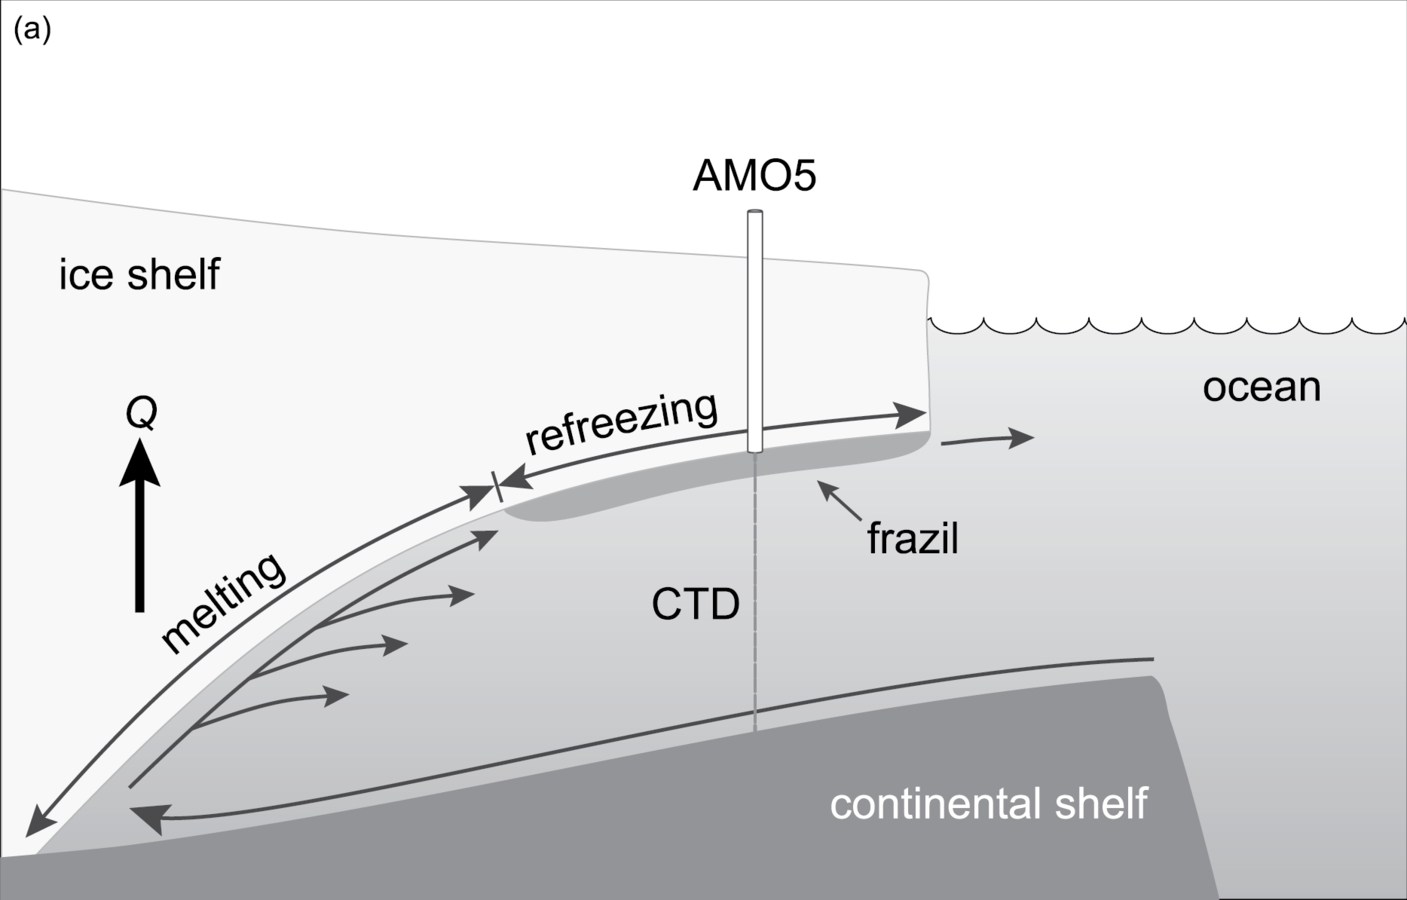
AMery Ice Shelf Ocean Research (AMISOR) Experiment; Craven and many others (1999--2012)
Ocean temperature at AM02 (bottom panel)
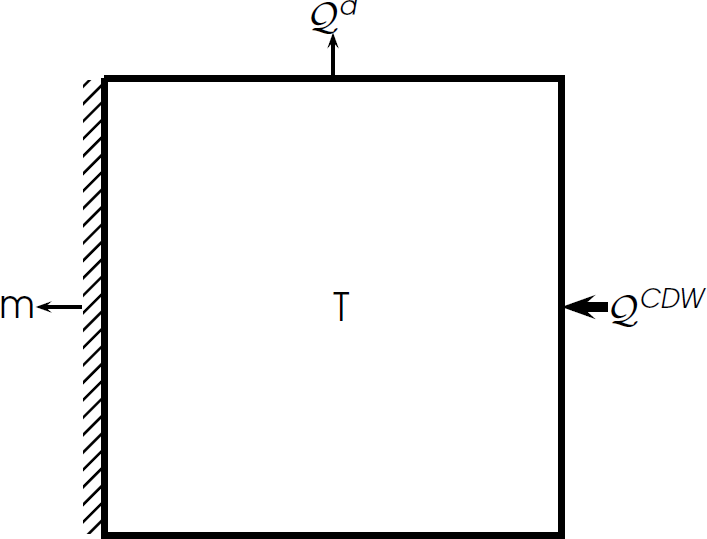
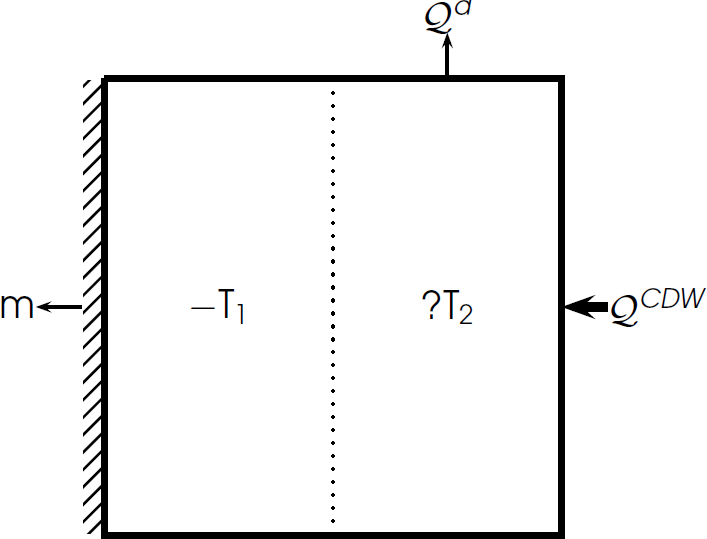
schematic
Gating of ocean flux by polynya
Gating of ocean flux by polynya
large-scale summary
- The ocean heat available for melting is determined by the onshelf flow of deep waters and the loss of heat to the atmosphere (mainly through sea ice growth).
- Ocean forcing driving ice shelf basal melting is complex. The response depends on many factors, for example cavity and continental shelf geometry, frontal dynamics, winds, mixing and sea ice growth processes.
- Increased winds can cause increased onshelf flow of CDW and increased ice shelf basal melt However, in some cases, enhanced mixing may lead to these waters actually being cooler, leading to
decreased basal melt . - Polynyas can act to also redirect warm ocean currents away from ice shelves in their vicinity as well as to cool them.
small-scale
SMALL SCALES: ICE MELTING INTO SEAWATER
http://www.youtube.com/watch?v=olFzcye4iSs
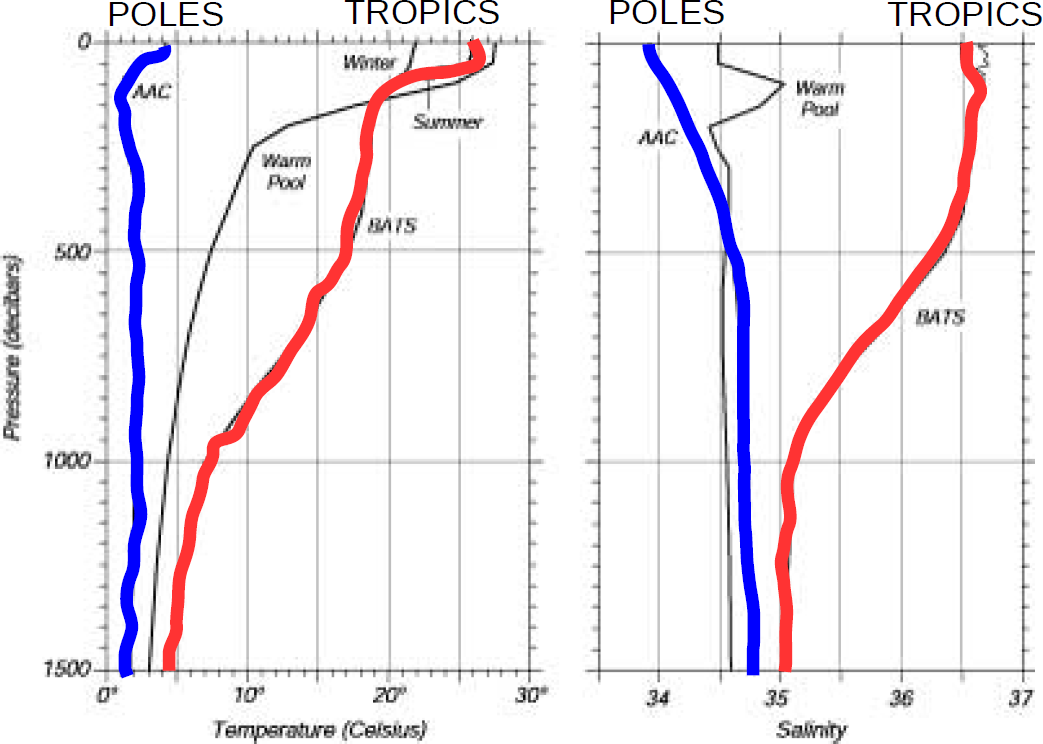
some important concepts around seawater
- Freezing point temperature
- Density
- Enthalpy
freezing temperature
- Pure water at sea level: 0.0 degrees C
- Seawater at sea level: -1.9 degrees C
- Seawater at 500 m depth: -2.3 degrees C
- Seawater at 1000 m depth: -2.6 degrees C
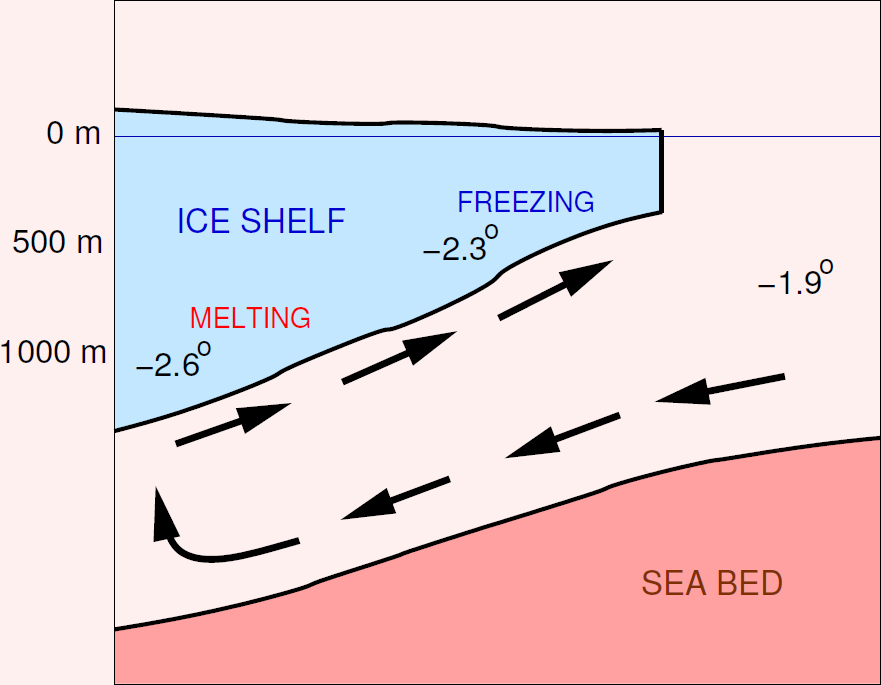
melting and freezing
Calculating basal melt/freeze
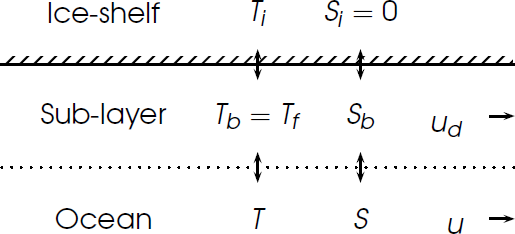
\rho_i(L-c_i \Delta T) m = \rho c_w \gamma_T(T_b-T)
\rho_i S_b m = \rho \gamma_S(S_b-S)
T_f = -5.73 \times 10^{-2} S_b + 8.32 \times 10^{-2} - 7.61 \times 10^{-4} P
\gamma_{T,S} \text{propto.} u_d
approximations
- S = Sb, the "two-equation method"
- Simplified parameterisation of m as a function of P and T
c_i \Delta T << L
\rho_i L m = \rho_w c_w \gamma_T (T_f - T)
SENSiTIVITY TO THERMAL DRIVING
\Omega = \frac{\rho_i L m}{\rho_w c_w \gamma_T (T_f - T)} = \frac{m}{\Phi T^{\star}}
\Phi = 7.8 \times 10^{-7} \text{m s}^{-1} \text{ C}^{-1}
\Phi = 24.6 \text{ m year}^{-1} \text{ C}^{-1}
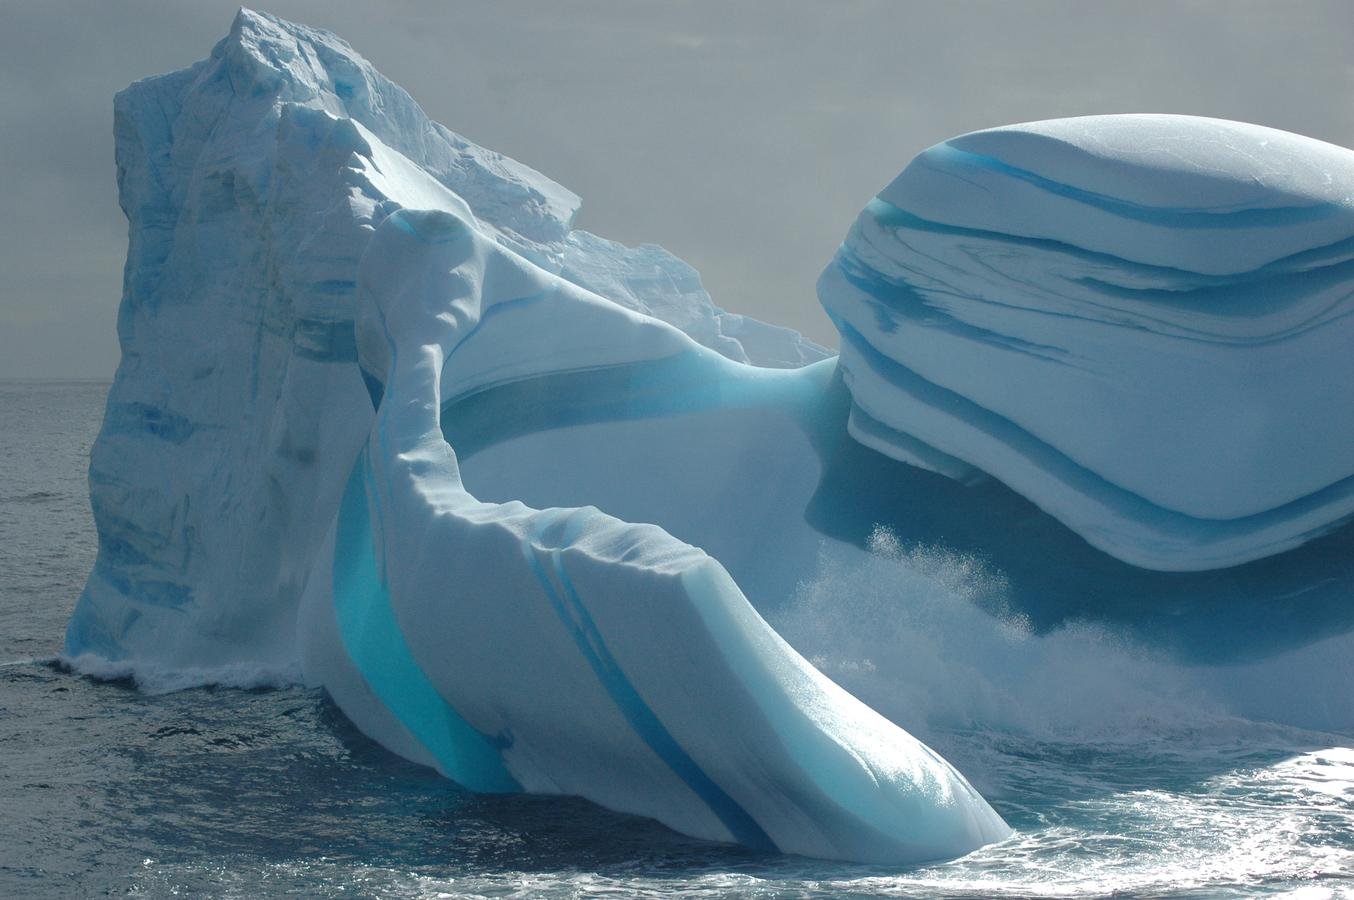
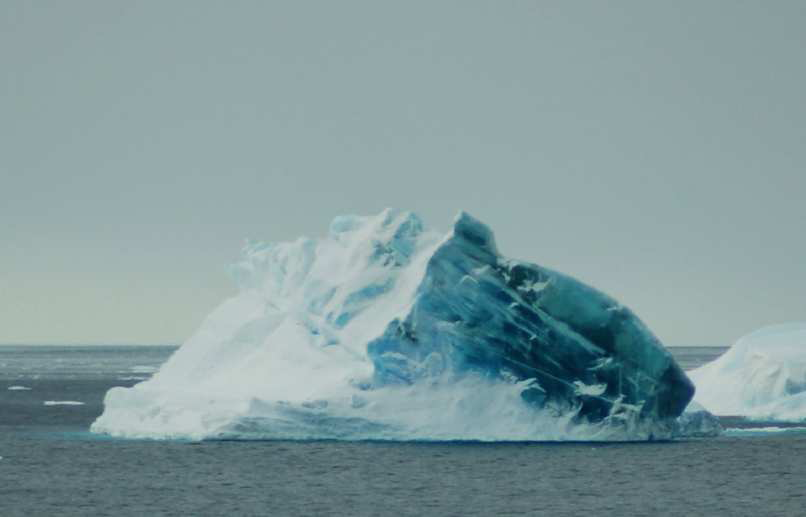
jade icebergs
thick ice
density
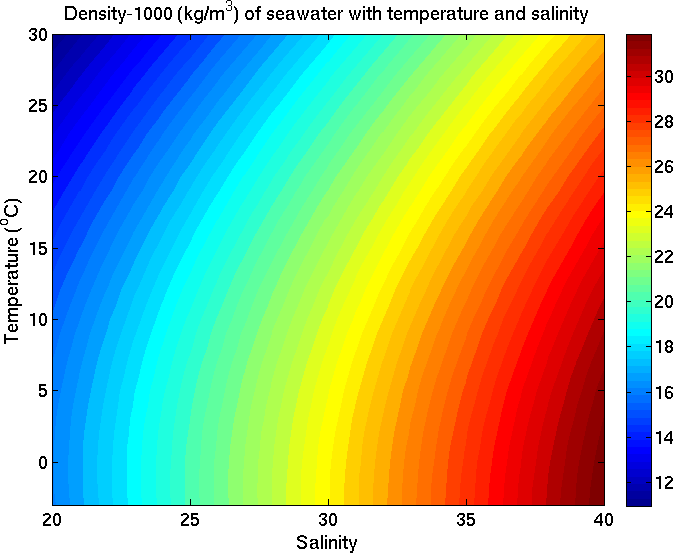
equation of state for seawater
- Described by TEOS-10
- Gibbs function: describing relationships in a thermodynamically consistent way.
- Enthalpy: a thermodynamic quantity equivalent to the total heat content of a system
- Conservative temperature: Enthalpy/Specific heat capacity
- Absolute salinity
- Melting and freezing (McDougall et al. 2014)
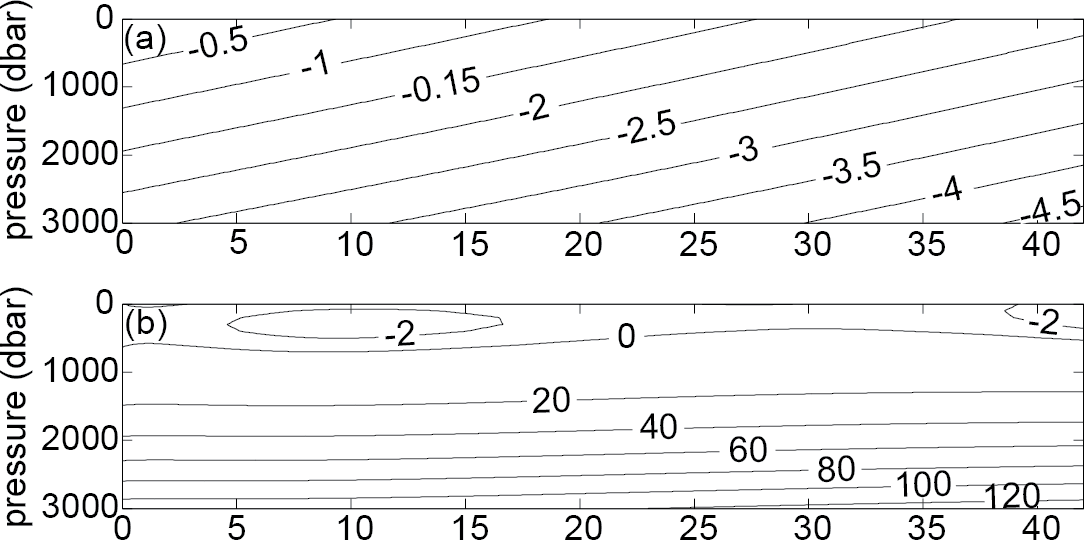
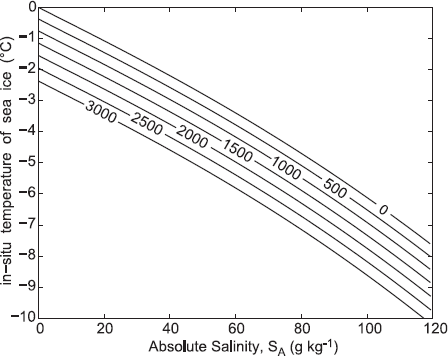
(a) The Conservative Temperature (in °C ) at which air-free
seawater freezes as a function of pressure and Absolute Salinity.
(b) The difference between the freezing Conservative Temperature derived from EOS-80 and that of TEOS-10, with the contours being in mK.
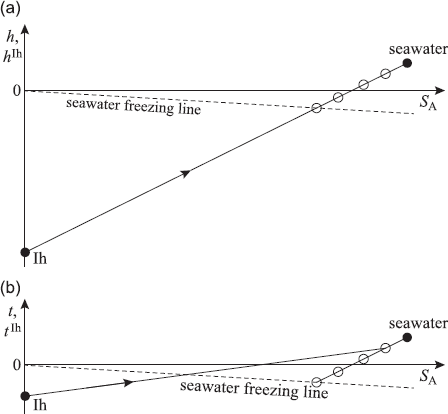
melting of ice into seawater
The First Law of Thermodynamics says that when a process occurs at constant pressure, and without any external input of energy with the environment, that enthalpy is conserved.
conservation of mass, salt and enthalpy
m^f_{sw} = m^i_{sw} + m_{Ih}
m^f_{sw} S^f_A = m^i_{sw} S^i_A
m^f_{sw} h_f = m^i_{sw} h_i + m_{Ih} h_{Ih}
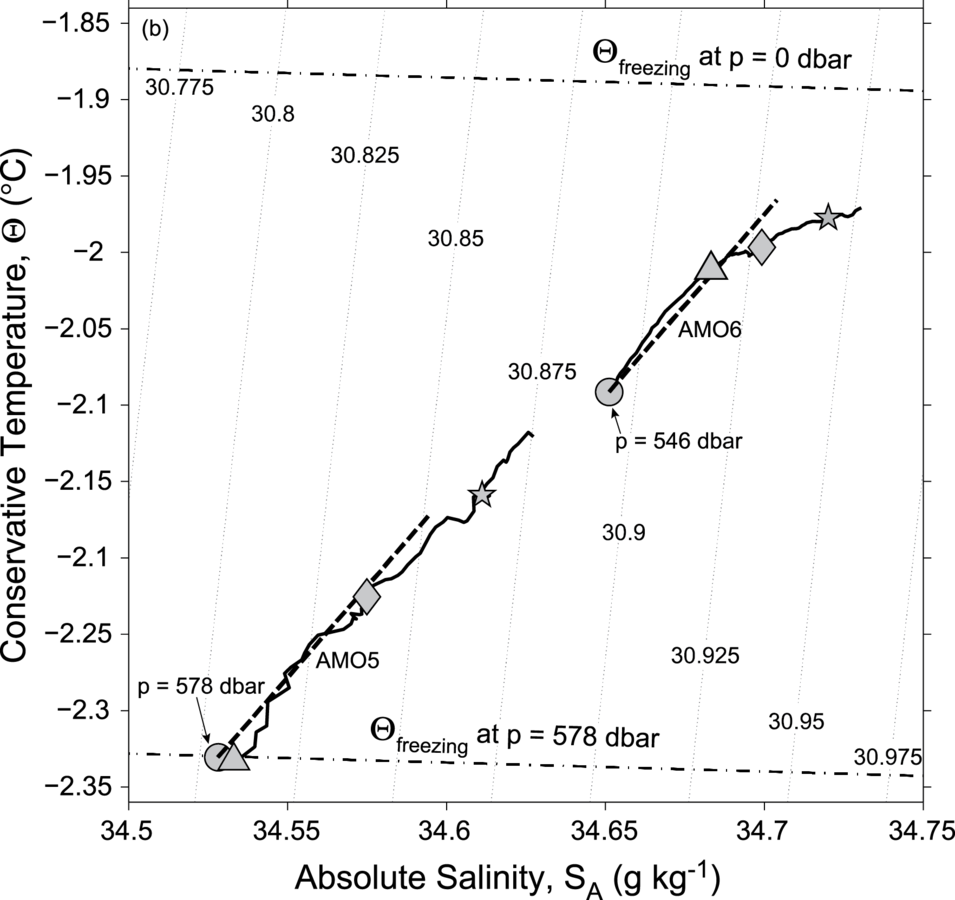
modified gade line
example from amery ice shelf
Title Text
FREEZING of seawater
The in situ freezing temperature (8C) of air-free seawater as a function of pressure (dbar) and Absolute Salinity, determined
from the equilibrium freezing condition.
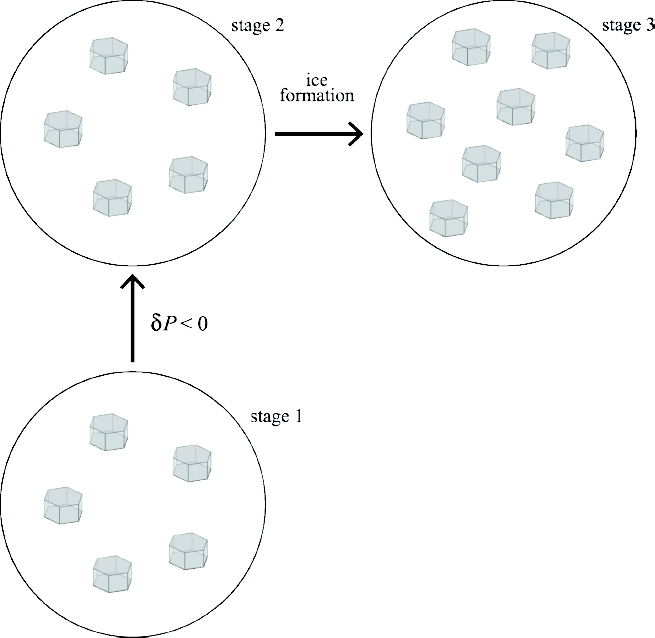
frazil formation
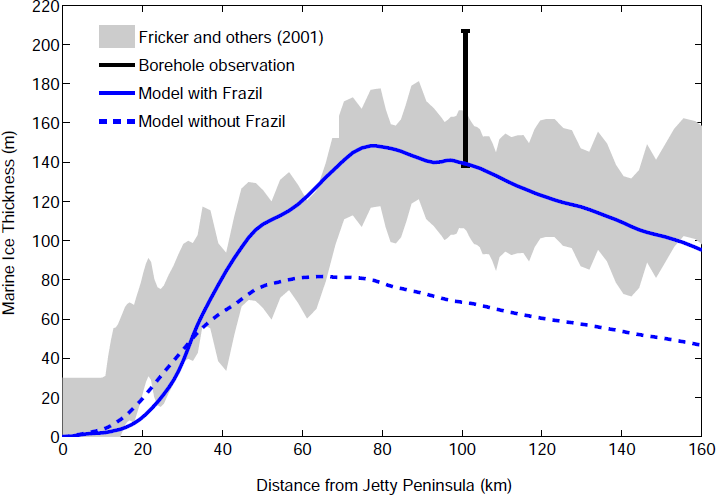
marine ice accretion
- Produced from difference between hydrostatic estimate of ice thickness from elevation and ice radar.
- Fricker et al (2001)
modelled marine ice thickness
pRACTICAL
part 1
- Using AMISOR CTD data:
- Compare and contrast 2 sites
- Determine which sites are freezing and which are melting
QAS501 Day 3
By Ben Galton-Fenzi
QAS501 Day 3
Ice/Ocean interaction


