PHC7065 CRITICAL SKILLS IN DATA MANIPULATION FOR POPULATION SCIENCE

Image and Time-series Data
Hui Hu Ph.D.
Department of Epidemiology
College of Public Health and Health Professions & College of Medicine
April 2, 2018
Introduction to Image and Time-series Data
Lab: Image and Time-series Data
Introduction to Image and Time-series Data
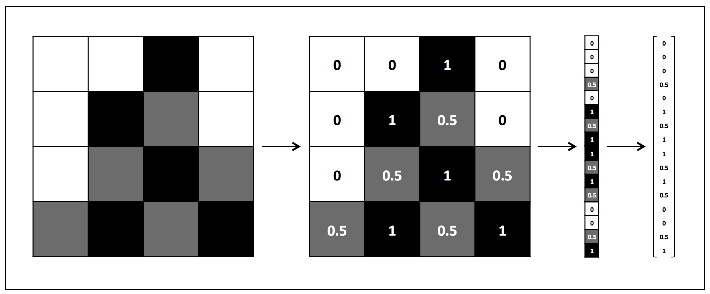
Image Data

rgba(XXX,XXX,XXX,X)
Representation of Image Data
Geometric Transformations of Images
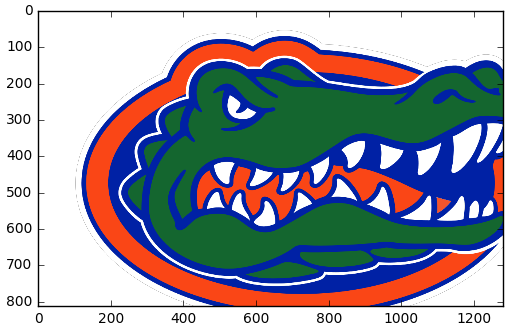
- Scaling:
- resizing of the image
- Translation:
- the shift of object's location
- Rotation:
- rotate an image for an angle
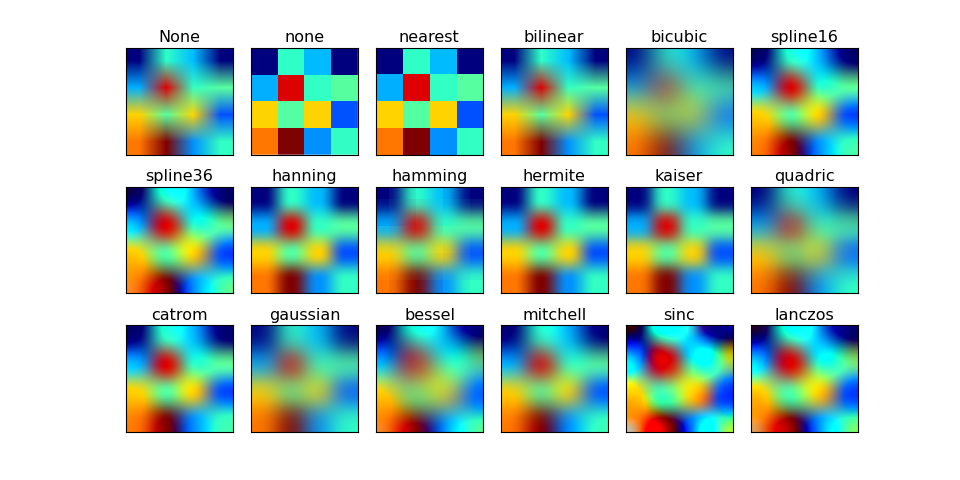
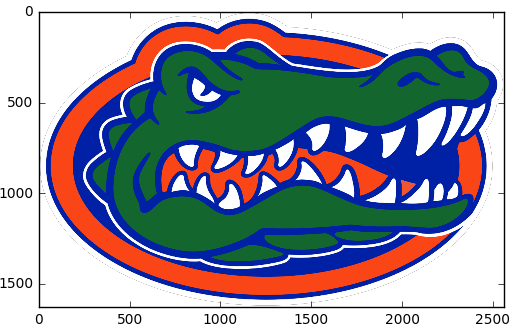
Scaling
- When scale an image, interpolation is needed
Translation
Transformation matrix:
M={\begin{bmatrix}
1 & 0 & t_x\\
0 & 1 & t_y
\end{bmatrix}}
Shift in (x,y) direction
Rotation
Transformation matrix:
M={\begin{bmatrix}
cos\theta & -sin\theta\\
sin\theta & cos\theta \end{bmatrix}}
Modified transformation matrix with center of rotation added:
M={\begin{bmatrix}
\alpha & \beta & (1-\alpha)center.x-\beta center.y\\
-\beta & \alpha & \beta center.x + (1-\alpha)center.y \end{bmatrix}}
\alpha=scale \cdot cos\theta
\beta=scale \cdot sin\theta
Time-series Data
- Time series is usually a collection of data points collected at constant time intervals
- What makes time series data special?
- time dependent
- seasonality trends
- Stationarity: a time-series is said to be stationary if its statistical properties remain constant over time
- constant mean
- constant variance
- an autocovariance that does not depend on time
- Most of the time-series models were based on the assumption of staionarity, and theories related to stationary series are more mature and easier to implement
Stationarity
- What make a time-series non-stationary?
- trend: varying mean over time
- seasonality: variations at specific time-frames
- How to make series stationary?
- estimate the trend and seasonality in the series and remove them from the series
- Many ways of doing it:
- aggregation: taking average for a time period like monthly/weekly averages
- smoothing: taking rolling averages
- polynomial fitting: fit a regression model
- differencing: take the difference of the observation at a particular instant with that at the previous instant
- decomposing: model trend and seasonality seperately
Lab: Image and Time-series Data
git pull
PHC7065-Spring2018-Lecture10
By Hui Hu
PHC7065-Spring2018-Lecture10
Slides for Lecture 10, Spring 2018, PHC7065 Critical Skills in Data Manipulation for Population Science


