NabeFinder.com
Hui Hu
Find the Best Neighborhood for People with Disabilities


Nearly 1 in 5 People in US

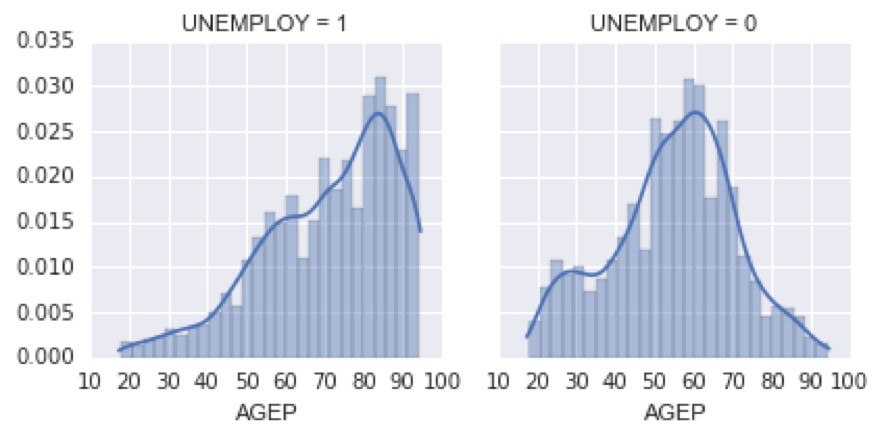
12.5% vs. 5.9% Unemployment Rate

Nearly 1 In 3 In Poverty
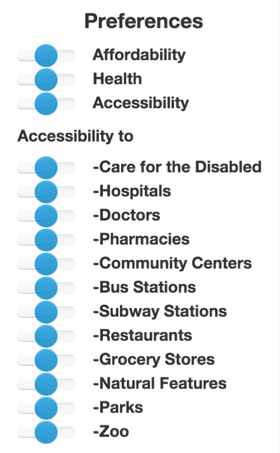
Affordability & Cost of Living
Health
Accessibility
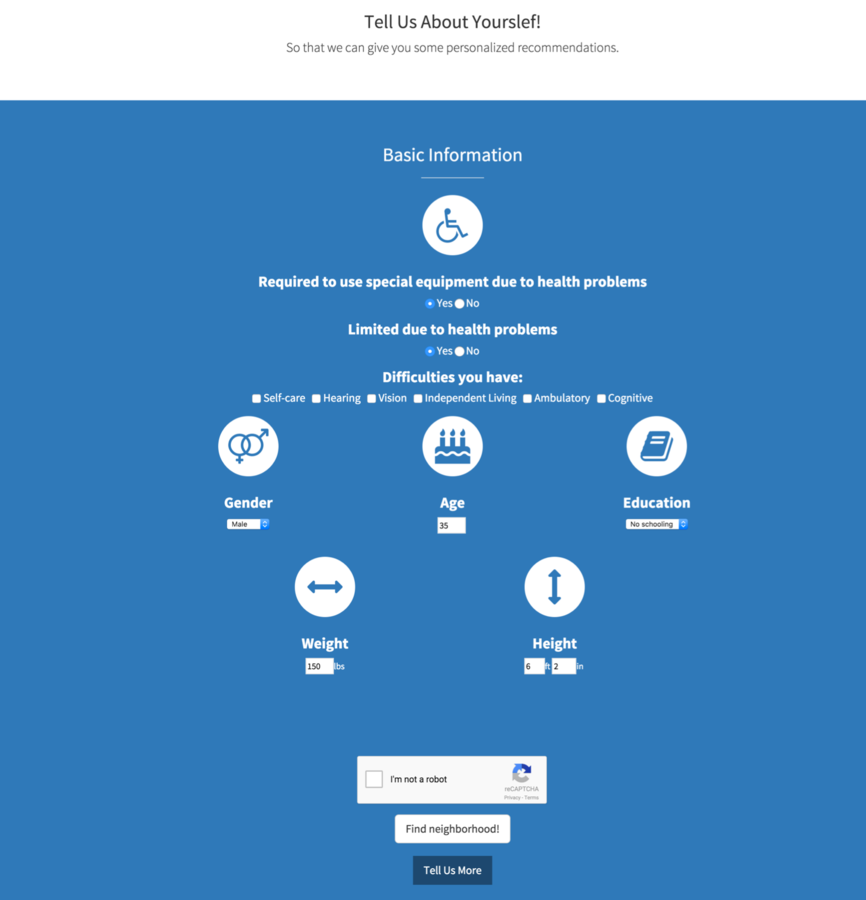
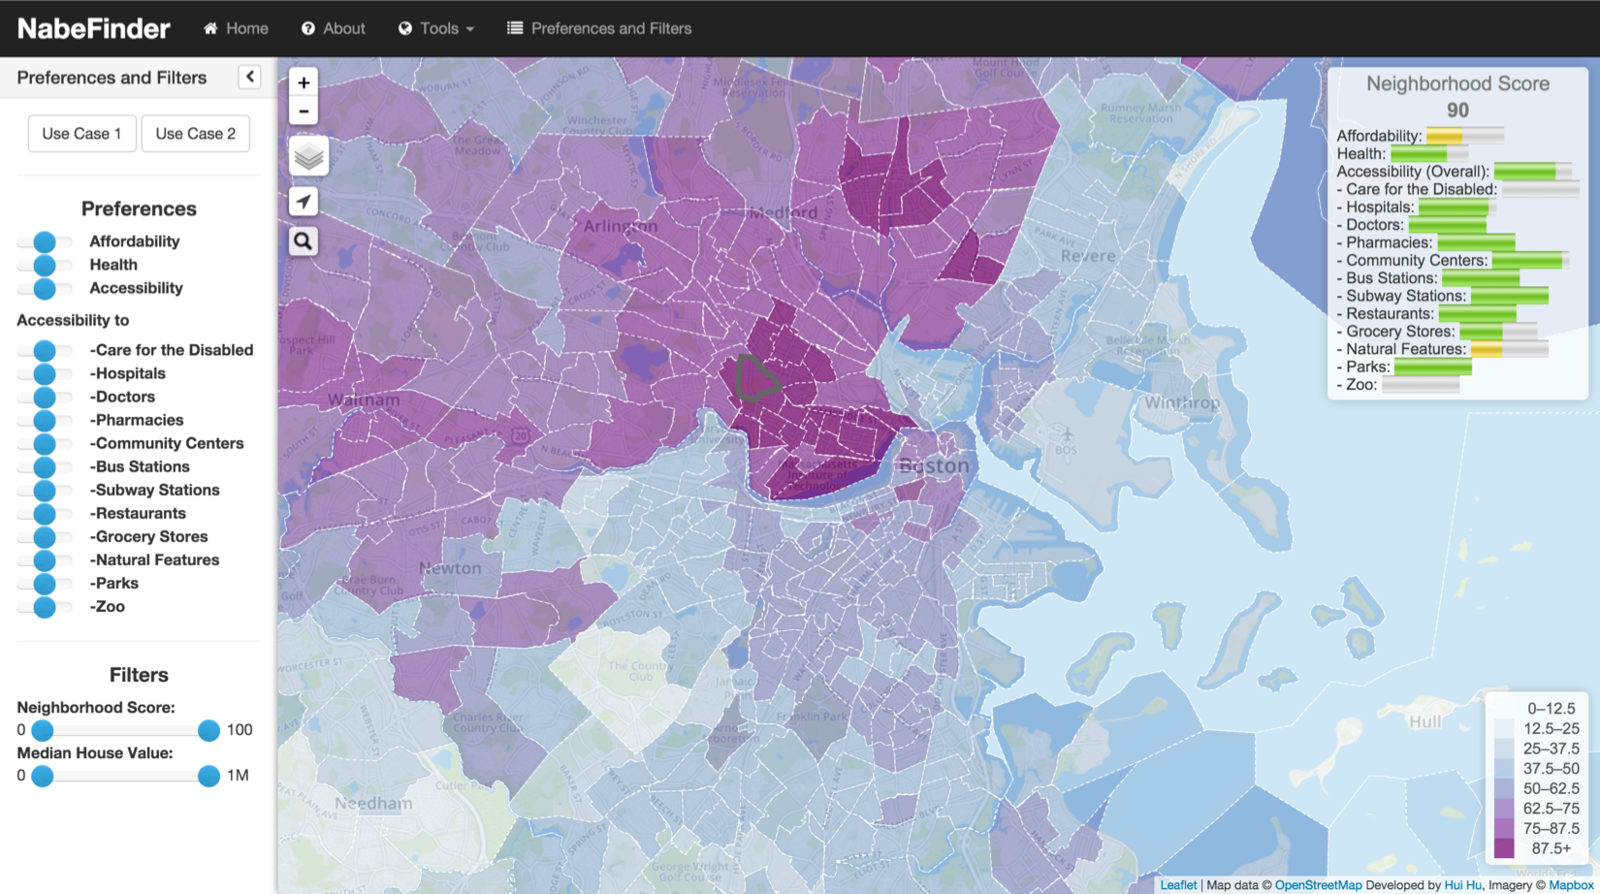
Demo
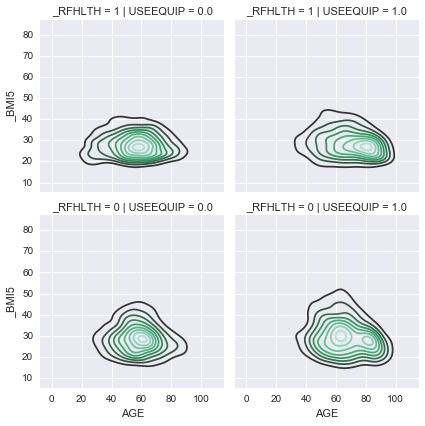
Behavioral Risk Factor Surveillance System (BRFSS) SMART 2012
n=3,600
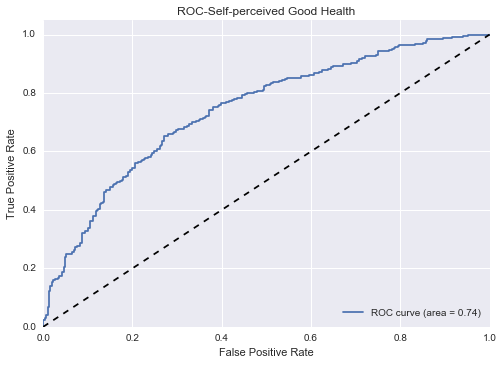
Self-perceived Good Health (County-level)
Model 1
Health
Gradient Boosting Decision Trees
XGBoost (eXtreme Gradient Boosting)
Ensemble of decision trees
Grid search to tune parameters
3,600 individuals
with disabilities
>18 years old
living in MA
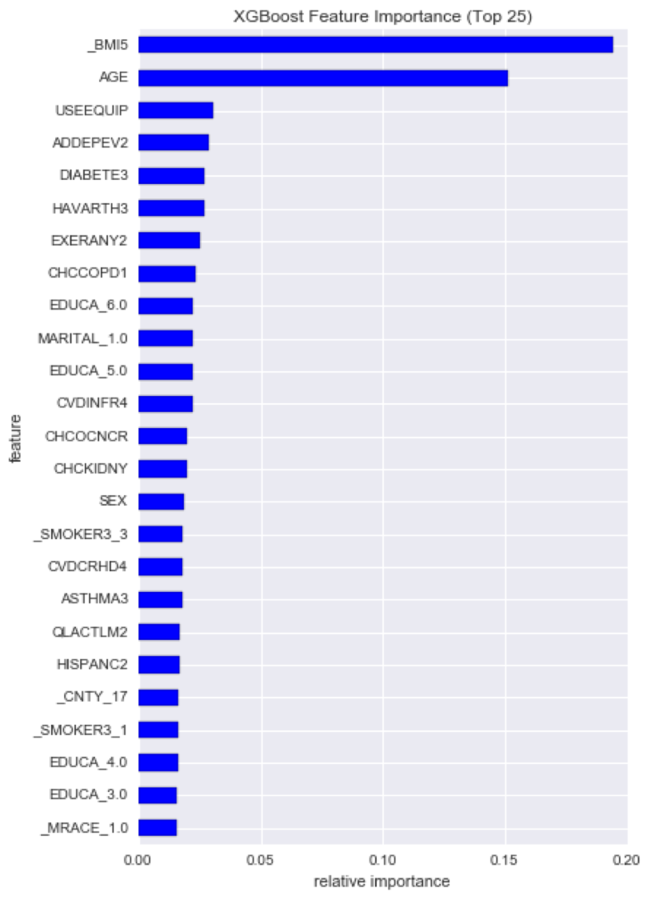
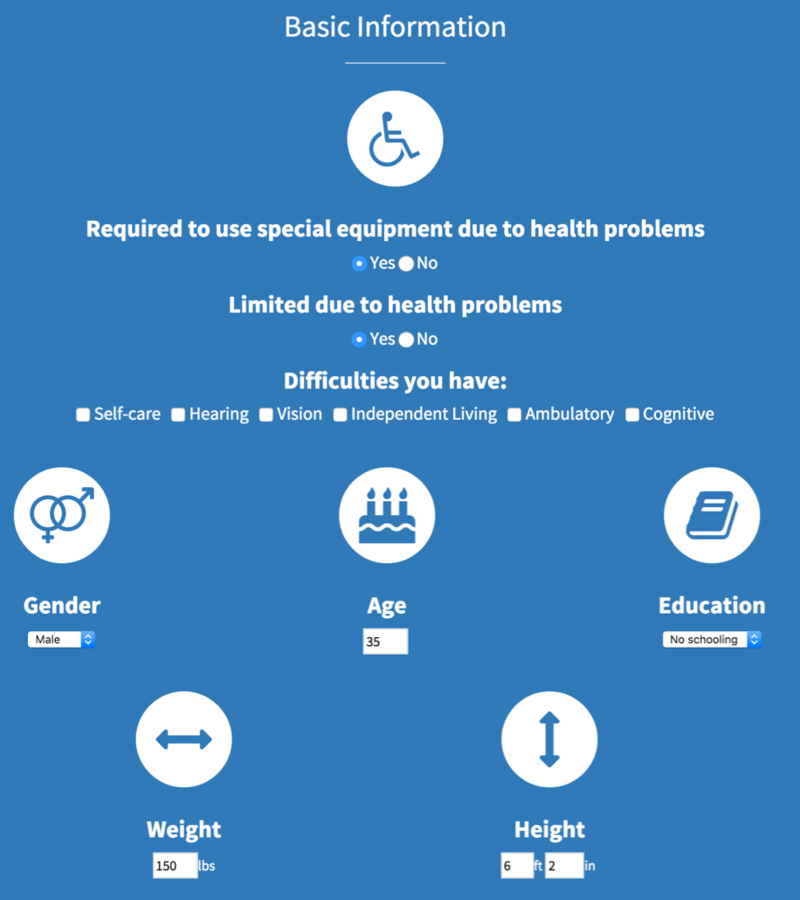
Features
Socio-demographics
Disabilities
BMI and PA
Chronic diseases
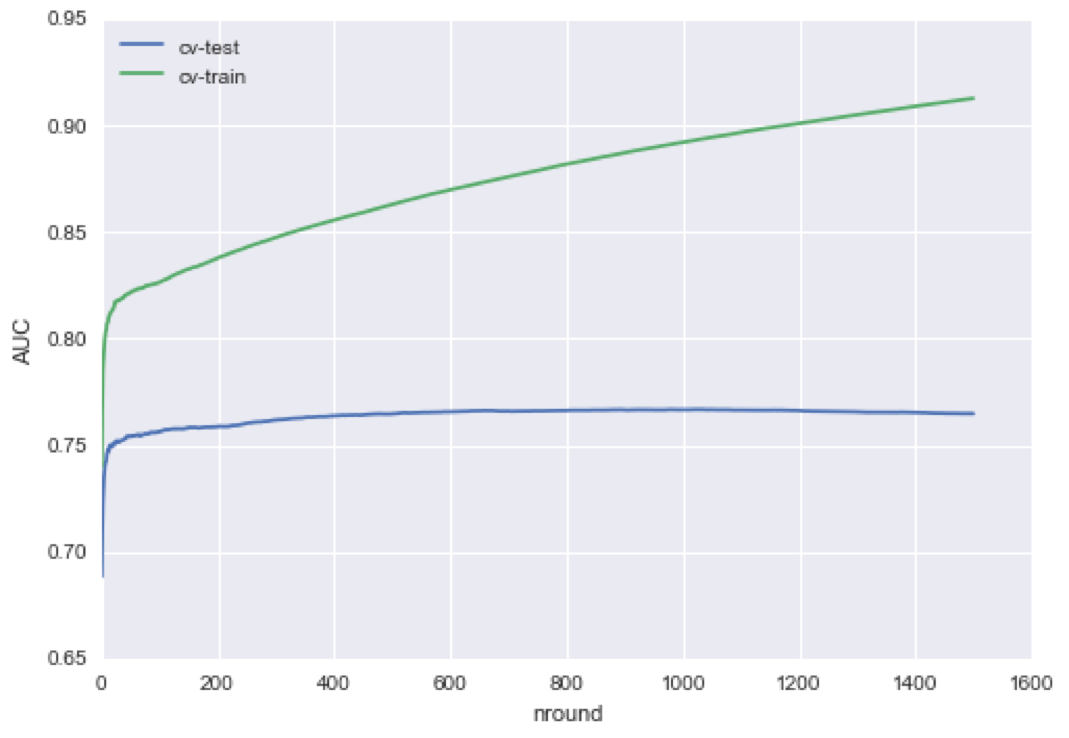
Testing AUC: 0.74
CV
Behavioral Risk Factor Surveillance System (BRFSS) SMART 2012
n=3,600
Model 1
Health
Self-perceived Good Health (County-level)
Model 1
Self-perceived Good Health (County-level)
Probability of Self-perceived Good Health for Different Neighborhoods
| Census Tract | p_health | ...... |
|---|---|---|
| ...... | ...... | ...... |
| ...... | ...... | ...... |
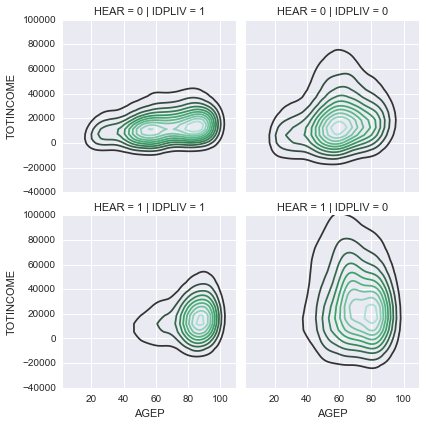
American Community Survey Public Use Microdata Sample (PUMS) 2014
n=8,190
Behavioral Risk Factor Surveillance System (BRFSS) SMART 2012
n=3,600
Google Places
API
Census
API
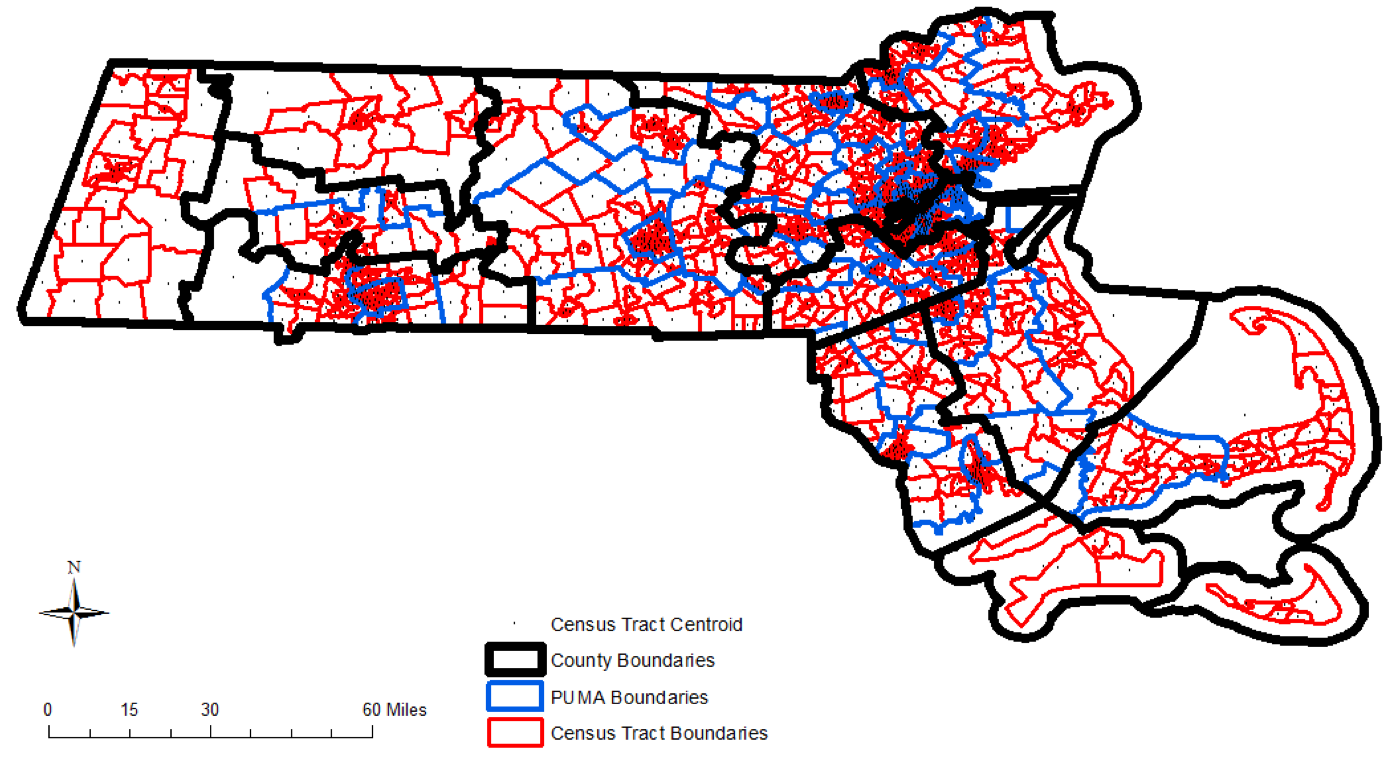
Probability of Employment
(PUMA-level)
Total Income
(PUMA-level)
Self-perceived Good Health (County-level)
Accessibility to Places
(Census tract-level)
Median House Value
(Census tract-level)
Model 1
Model 2
Model 3
Health
Affordability & Cost of Living
Accessibility
Merged Dataset
(Census tract-level)
Weights Chosen by Users
Neighborhood Score
{\sum}_{i=1}^{3}w_i{\times}s_i
w_i
s_i
About Me


Environmental Epidemiology
NabeFinder
By Hui Hu
NabeFinder
Slides for the Insight Demo


