Characteristics of Winning Development Teams
KPIs
OKRs
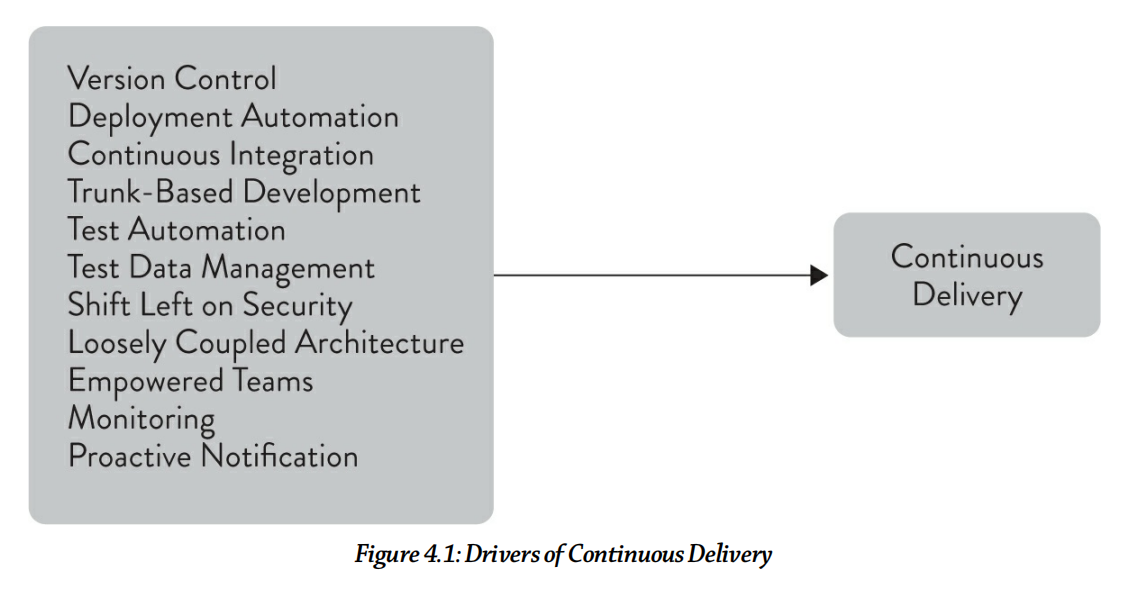
Continues Delivery
Key Performance Indicators
Facebook Marketing KPIs
Example 1
Audience
Engagement
Reach
Leads
Money First Business KPIs
Example 2
Customer Acquisition Cost (CAC)
Customer Retention Rate
Customer Lifetime Value (CLV/LTV)
Net Promoter Score (NPS)
Shavit ___ Team's KPIs
Example 3
Objectives & Key Results
Marketing Team OKRs
Example 1
Simplify & clarify our product, messaging, presentation of things we do
- 25 on-site user-testing sessions to understand key product misunderstandings
- 10 tests of our recent infographics and slide decks for customer understanding
- Get 1000 answers to an online user survey sent to all last quarter's signups
- Conduct a team hackathon to create and publish full portfolio of product materials
- Present an action plan for next quarter's messaging improvements
1/5
Achieve record metrics in all areas of marketing
- 170000 website visitors
- 23000 signups
- 7500 trials
- 3500 new paid customers
- Maximum paid user acquisition cost of $25
2/5
Successfully implement the weekly newsletter
- Finalize the content strategy, key messages and topic structure for next 6 months
- Grow subscriber base at least 5% per week, getting to 50000 readers
- Increase the CTR% to above industry average 3.5%
3/5
Engineering Team OKRs
Example 2
Improve our testing procedures
- Implement test-driven development in 3 new development teams
- Increase unit test coverage to 75% of code
- Conduct a security assessment of our codebase using automated tools
- Make sure satisfaction score of product management to testing team is at least 7.5
- Discover at least 100 bugs and open issues in old code not reviewed in 6 months
1/5
Review and improve our data security procedures
- For learning, review security policies of 5 other companies
- Conduct external penetration testing using at least 2 different software packages
- Document our backup policies and make sure they get implemented
- Guarantee uptime and availability of 99.95%
2/5
Refactor our old user management module
- Survey 5 external API users regarding issues with our authentication
- Discuss the user management code usage with 5 engineers having used it in production
- Rewrite and launch new version of our user management module
- Rewrite the API user authentication for new version
3/5
Shavit ___ Team's OKRs
Example 3
GitLab's Open OKRs
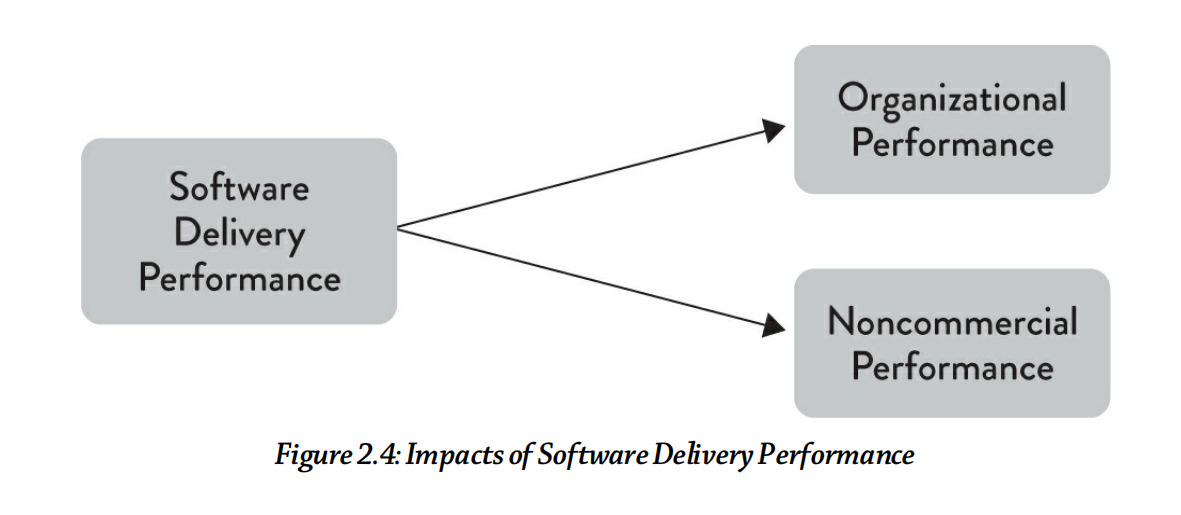
Continues Delivery
- Delivery of goods and services to delight their customers;
- Engagement with the market to detect and understand customer demand;
- Anticipation of compliance and regulatory changes that impact their systems; and
- Response to potential risks such as security threats or changes in the economy.
To remain competitive and excel in the market, organizations must accelerate:
46 times more frequent code deployments

440 times faster lead time from commit to deploy

170 times faster mean time to recover from downtime

5 times lower change failure rate (1/5 as likely for a change to fail)
Compared to low performers, the high performers:
Four Key Metrics
Delivery Lead Time
The time it takes to go from a customer making a request to the request being satisfied
Deployment Frequency
A software deployment to production or to an app store
Mean Time To Restore (MTTR)
in modem software failure is inevitable...
How quickly can service be restored? How long it generally takes to restore service upon incident?
Change Fail Percentage
What percentage of changes to production (including, for example, software releases and infrastructure configuration changes) fail?
| 2017 | High Performers | Medium Performers | Low Performers |
|---|---|---|---|
|
Deployment Frequency |
On demand (multiple deploys per day) | Between once per week and once per month | Between once per week and once per month* |
|
Lead Time for Changes |
Lessthan one hour | Between one week and one month |
Between one week and one month* |
| MTTR | Lessthan one hour | Lessthan one day | Between one day and one week |
|
Change Failure Rate |
0-15% | 0-15% | 31-45% |
* Low performers were lower on average (at a statistically significant level) but had the same median asthe medium performers.
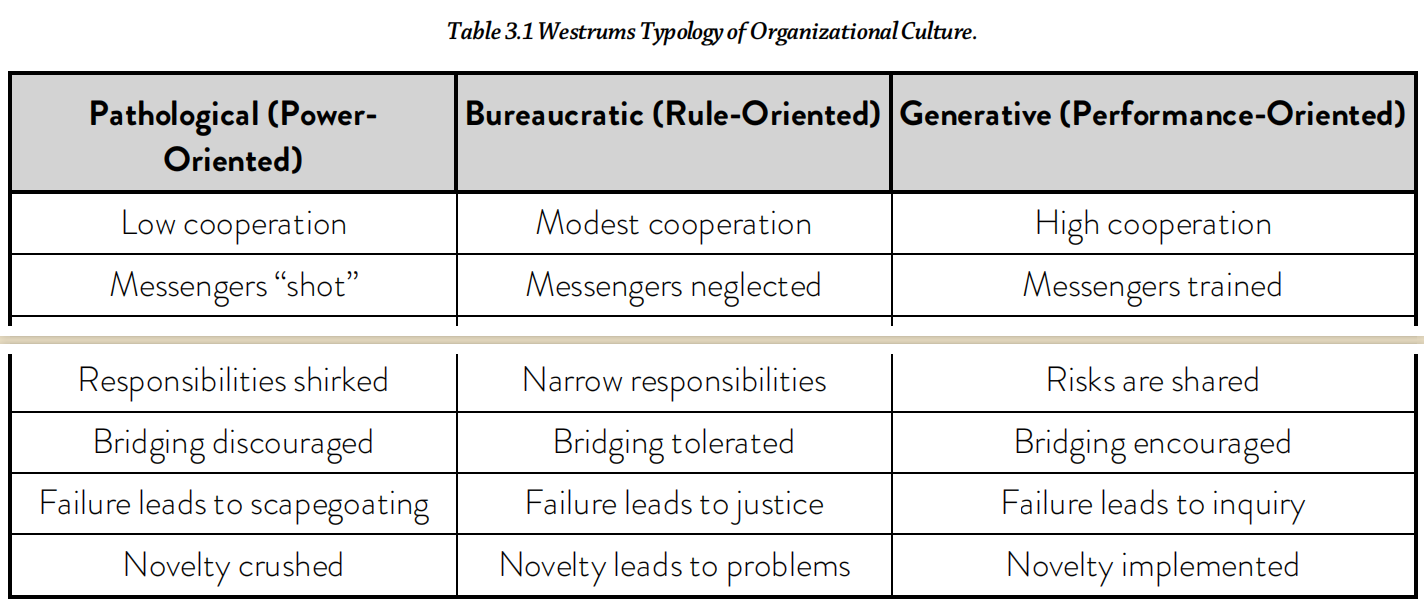
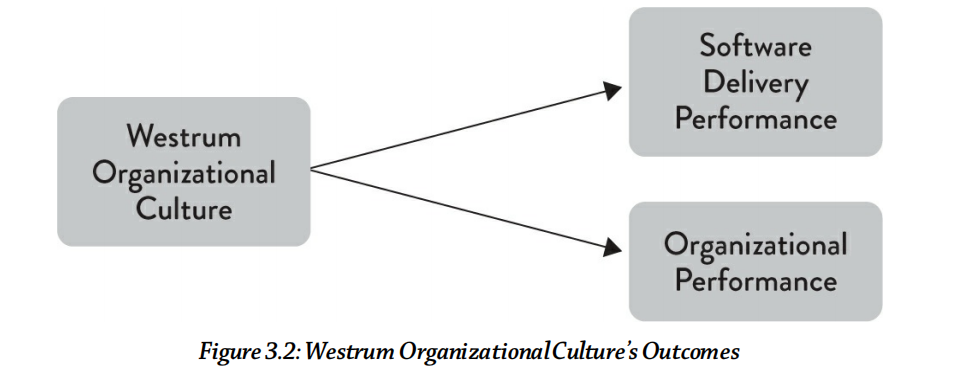
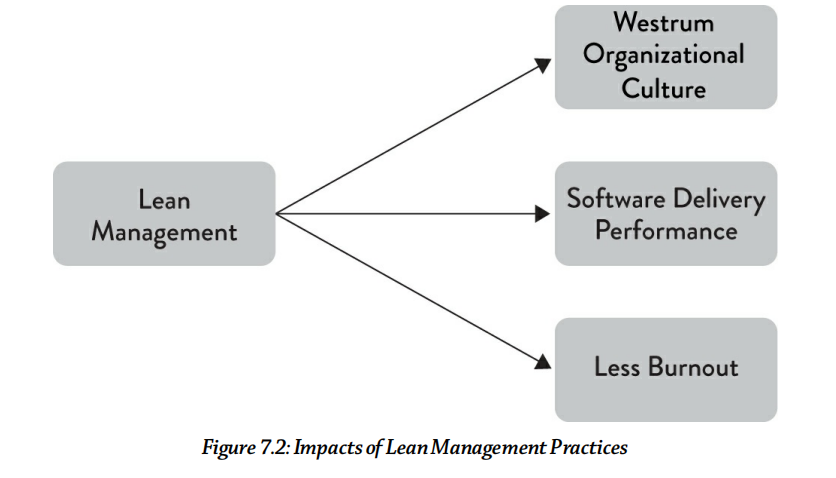
Westrum's Model
Organization's Form of Communication
- Pathological (power-oriented) organizations are characterized by large amounts of fear and threat. People often hoard information or withhold it for political reasons, or distort it to make themselves look better.
- Bureaucratic (rule-oriented) organizations protect departments. Those in the department want to maintain their “turf,” insist on their own rules, and generally do things by the book —their book.
- Generative (performance-oriented) organizations focus on the mission. How do we accomplish our goal? Everything is subordinated to good performance, to doing what we are supposed to do.
If you remember I did a survey....
Our Score:
3.950310559 = Bureaucratic
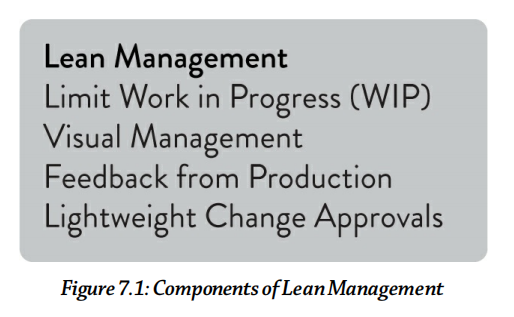
Key Principles
Build quality in.
invest in building a culture supported by tools and people where we can detect any issues quickly
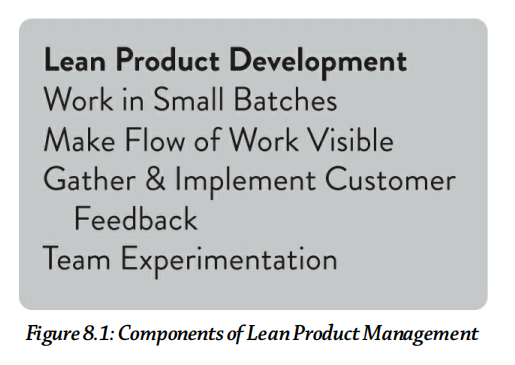
Work in small batches.
Organizations tend to plan work in big chunks. By splitting we get feedback.
It adds overhead, but it allows to avoid work with bad ROI.
Change the economics of delivery so that the cost of change is low.
Computers perform repetitive tasks; people solve problems.
E.g. regression testing and software deployments.
Relentlessly pursue continuous improvement.
high-performing teams are never satisfied: they always strive to get better.
High performers make improvement part of everybody’s daily work.
Everyone is responsible.
As we learned from Ron Westrum, in bureaucratic organizations teams tend to focus on departmental goals rather than organizational goals.
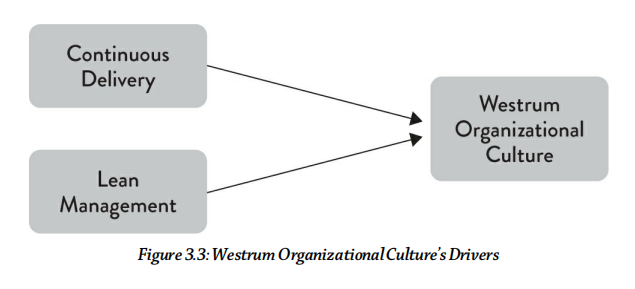
Technical Aspects
- The use of version control for application code, system configuration, application configuration, and build and configuration scripts.
- Comprehensive test automation that is reliable, easy to fix, and runs regularly.
- Deployment automation.
- Continuous integration.
- Shifting left on security: bringing security—and security teams—in process with software delivery rather than as a downstream phase.
- Using trunk-based development as opposed to long-lived feature branches.
- Effective test data management.
What More?
Done.
deck
By Boaz Berman


