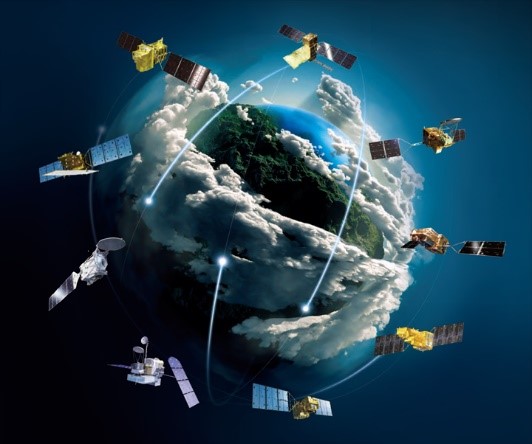
Earth Observation
Remote Sensing


Britta Ricker, PhD
UC-SCI-EARL5
Monitor Land Use Change with Google Time lapse Tool
Remote Sensing for Environmental Monitoring
16 Day MODIS composite from Jan - Dec 2013 Median NDVI
Hansen et al (2013)
High-Resolution Global Maps of 21st-Century Forest Cover Change, Science
15 Nov. Vol. 342, Issue 6160, pp. 850-853 DOI: 10.1126/science.1244693.
Land Cover
Observed Physical cover of the Earth's surface
Land cover influences sustainable development, climate change and biodiversity conservation, food security, disaster risk.
Land Use
How is the land used?
Land use is a socio-economic description - functional description.
Difficult to measure.
ex. Is a grassland used for agricultural purposes?
Urban area where people live or for commercial use?
Disaster and Land Use


Maps can help reduce complexity

Vanacker (2016) Impact of deforestation on slope stability

Combining Remote Sensing Data with Thematic Cartography can be very effective visual Communication - see McSweeney (2017) Cocaine trafficking is destroying Central Americ's forests
Today in Class
- Earth Observation and Remote Sensing (RS)
- Color Composites
- Vegetation indices
- Integrated Development Environment for RS
- Supervised and Unsupervised Classification
- Pop Quiz Moment!
Geographic Information
Science
Remote Sensing
Temporal Resolution: Revisit Every 5 days
Temporal Resolution: Revisit Every 5 days


Online "slippy" maps

True Color

Details
From Sentinel 2
Date of image: 22 Feb 2017
Spatial Resolution:
Each pixel represents 20 m
2325 columns
2960 rows of pixels

Electromagnetic Energy
Features on the Earth reflect, absorb, transmit, and emit electromagnetic energy from the sun.

The visible spectrum is small!

What else is collected?
Bands and spectral ranges

Properties of electromagnetic energy
Multispectral imagery
wavelength, fequency, amplitude

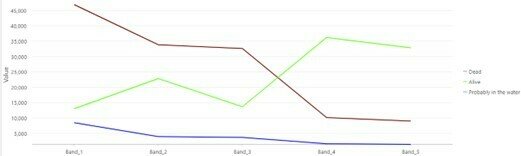
Spectral signature

Sentinel 2
Active Sensor
Passive Sensor

Lidar


1 m resolution!
How are images rendered on our screen?
3 bands projected light
The primary colors are Red, Green, Blue
True Color
= Band 4 Red
= Band 3 Green
= Band 2 Blue

Sentinel 2
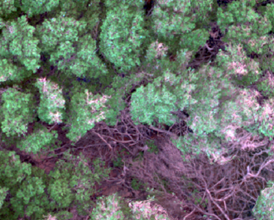
False Color Composites

Urban areas

Urban=Purple
= Band 12 SWIR II
= Band 11 SWIR I
= Band 4 Red
Vegetation
= Band 8 NIR
= Band 4 Blue
= Band 3 Red

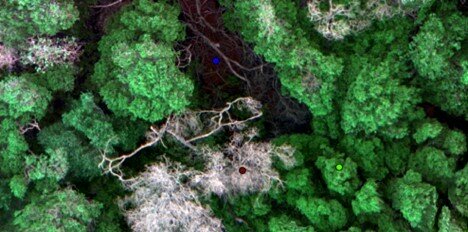
Spectral signature
Bands and spectral signatures


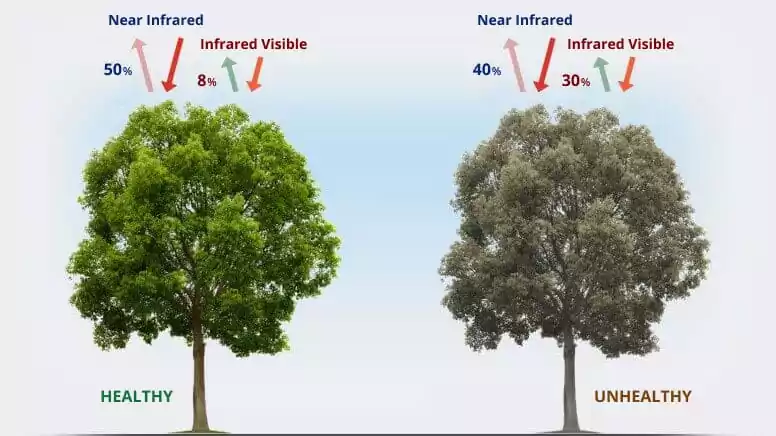
Healthy vegetation


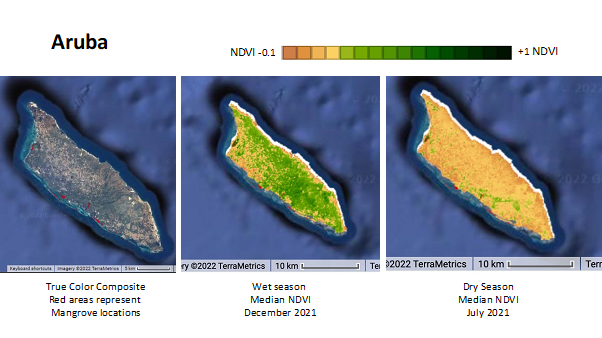
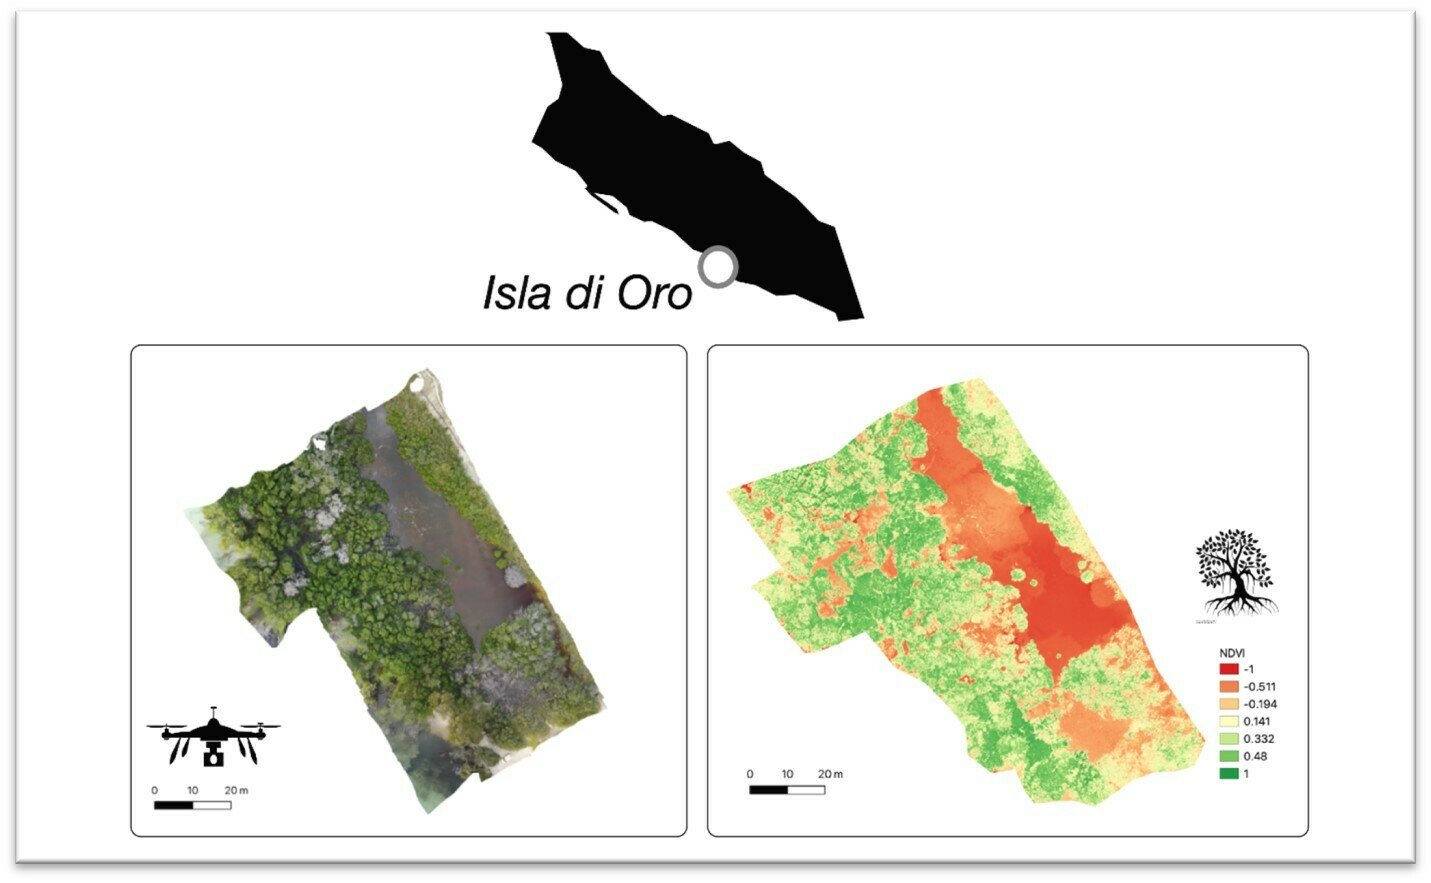
Normalized Difference Vegetation Index
NDVI=NIR-IR/NIR+IR
Healthy vegetation
Normalized Difference Vegetation Index
NDVI=NIR-IR/NIR+IR
Healthy vegetation
Normalized Difference Vegetation Index
NDVI=NIR-IR/NIR+IR
Other indices
- Leave Area Index (LAI)
- Net Primary Production (NPP)
- Vegetation Fraction (VF)
- Chlorophyll Index Green
- Chlorophyll Index Rededge
- this list goes on...
Animation
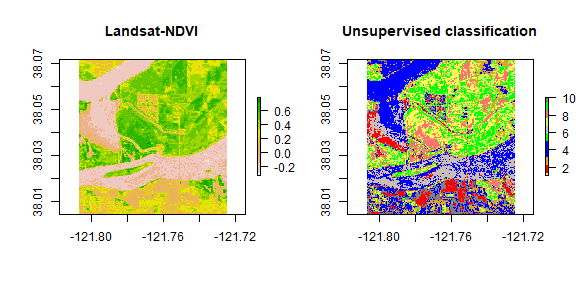
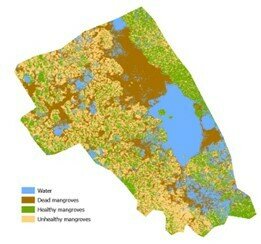
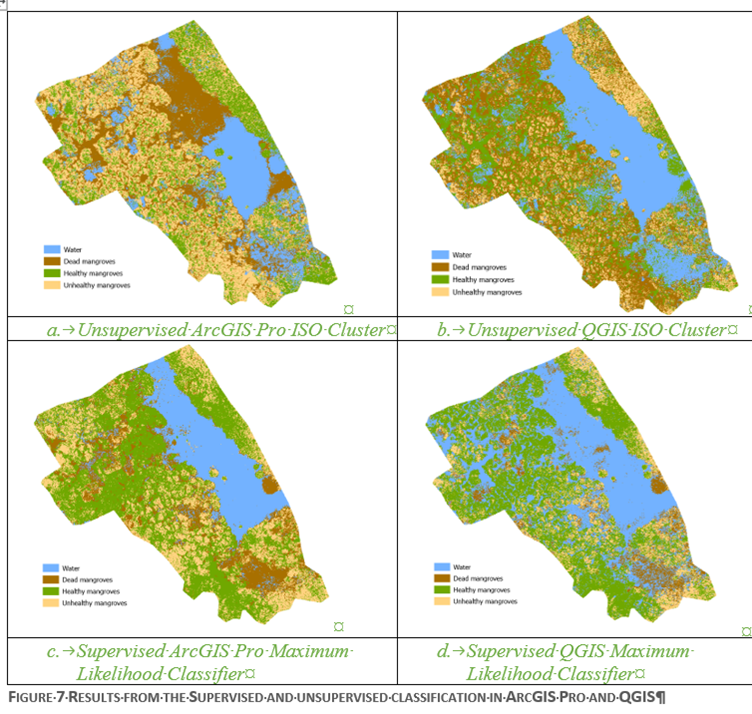
Supervised & Unsupervised
Classification

Digital image classification
Assigning pixels to classes
tip: Classes should be homogenous (the same)
Digital image classification
Digital image classification
Unsupervised vs supervised classification
Supervised Classification
Human guide the classification by identifying areas on the image that are known to belong to each category
Process of using samples of known identify
(pixels assigned to classes) to classify
pixels of an unknown identity
benefits
- Analyst has control over selecting categories to specific purpose
- specific areas of known identify - local knowledge
- errors can be detected early (hopefully)
- no need to match spectral categories on the final map
drawbacks
- imposed classification structure
- training areas often vague - secondarily to spectral properties
- training areas may not be representative of conditions on the ground
- training data is time consuming
Unsupervised Classification
Identify natural groups or structures based on the multispectral data alone
Minimal human input
Unsupervised Classification
benefits
- no prior knowledge of region required
- reduce likelihood of human error biased
- unique classes as distinct units
drawbacks
- spectrally homogeneous classes may not correspond to informational categories of interest
- analysis has limited control over menu of classes
- spectral properties of specific classes may change over time (seasons)
- SDG 2: Zero Hunger
- SDG 11: Sustainable Cities
- SDG 15: Life on Land
- Targets include sustainably managing forests,
- combating desertification,
- restoring degraded land,
- halting biodiversity loss
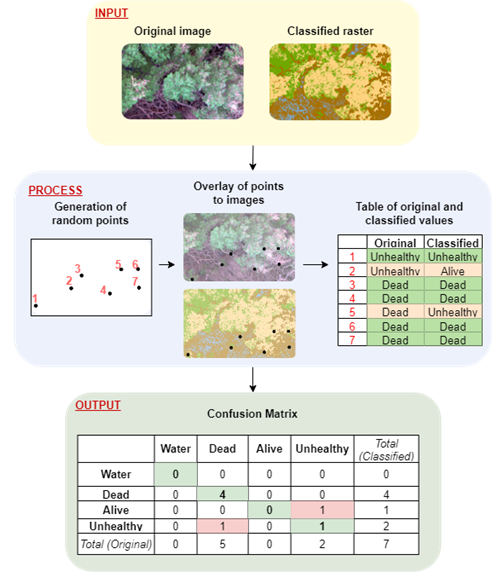
Confusion Matrix
Used to evaluate the accuracy of a classification model by comparing its output (the classified image) with known, reference data (ground truth).
Spectral classification versus:
Object-based image analysis (OBIA) segments an image by grouping pixels. It doesn’t reclassify single pixels - it groups objects by geometries.
Subtitle
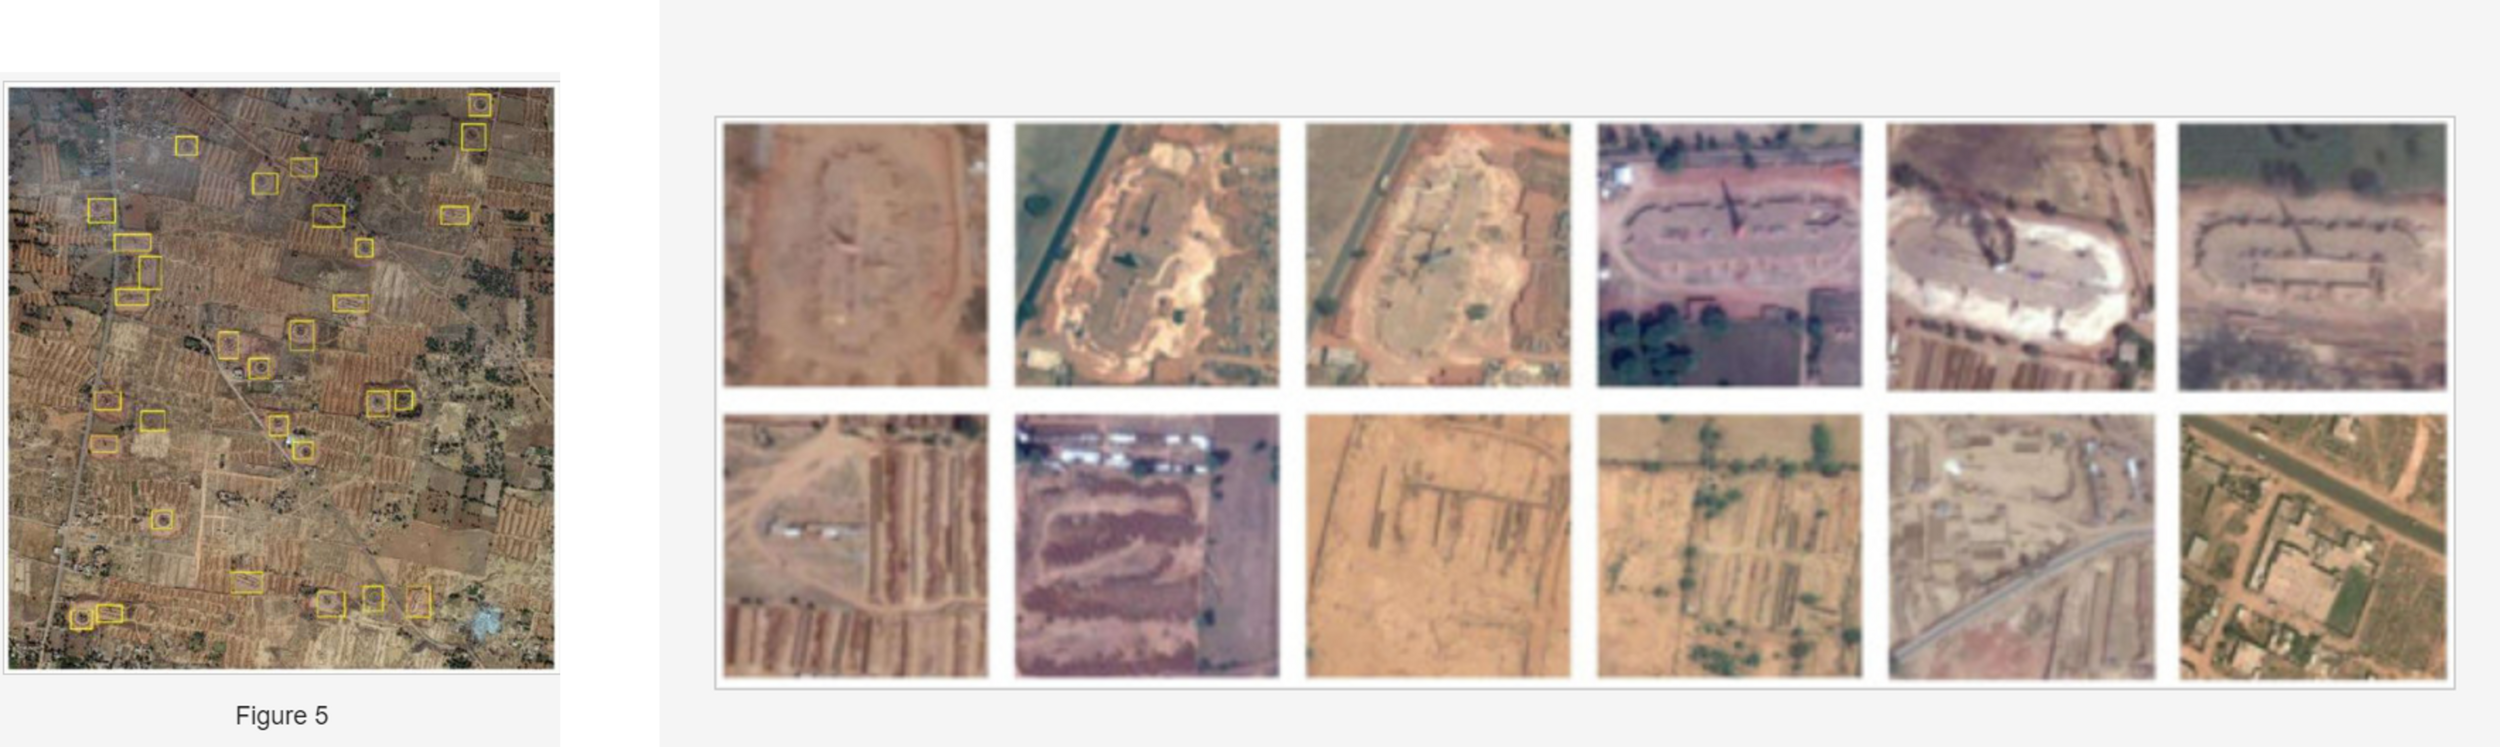
Earth Observation and Machine Learning to Meet Sustainable Development Goal 8.7: Mapping Sites Associated with Slavery from Space. Foody GM, Ling F, Boyd DS, et al. 2019 Remote Sensing . DOI: 10.3390/rs11030266.
Subtitle
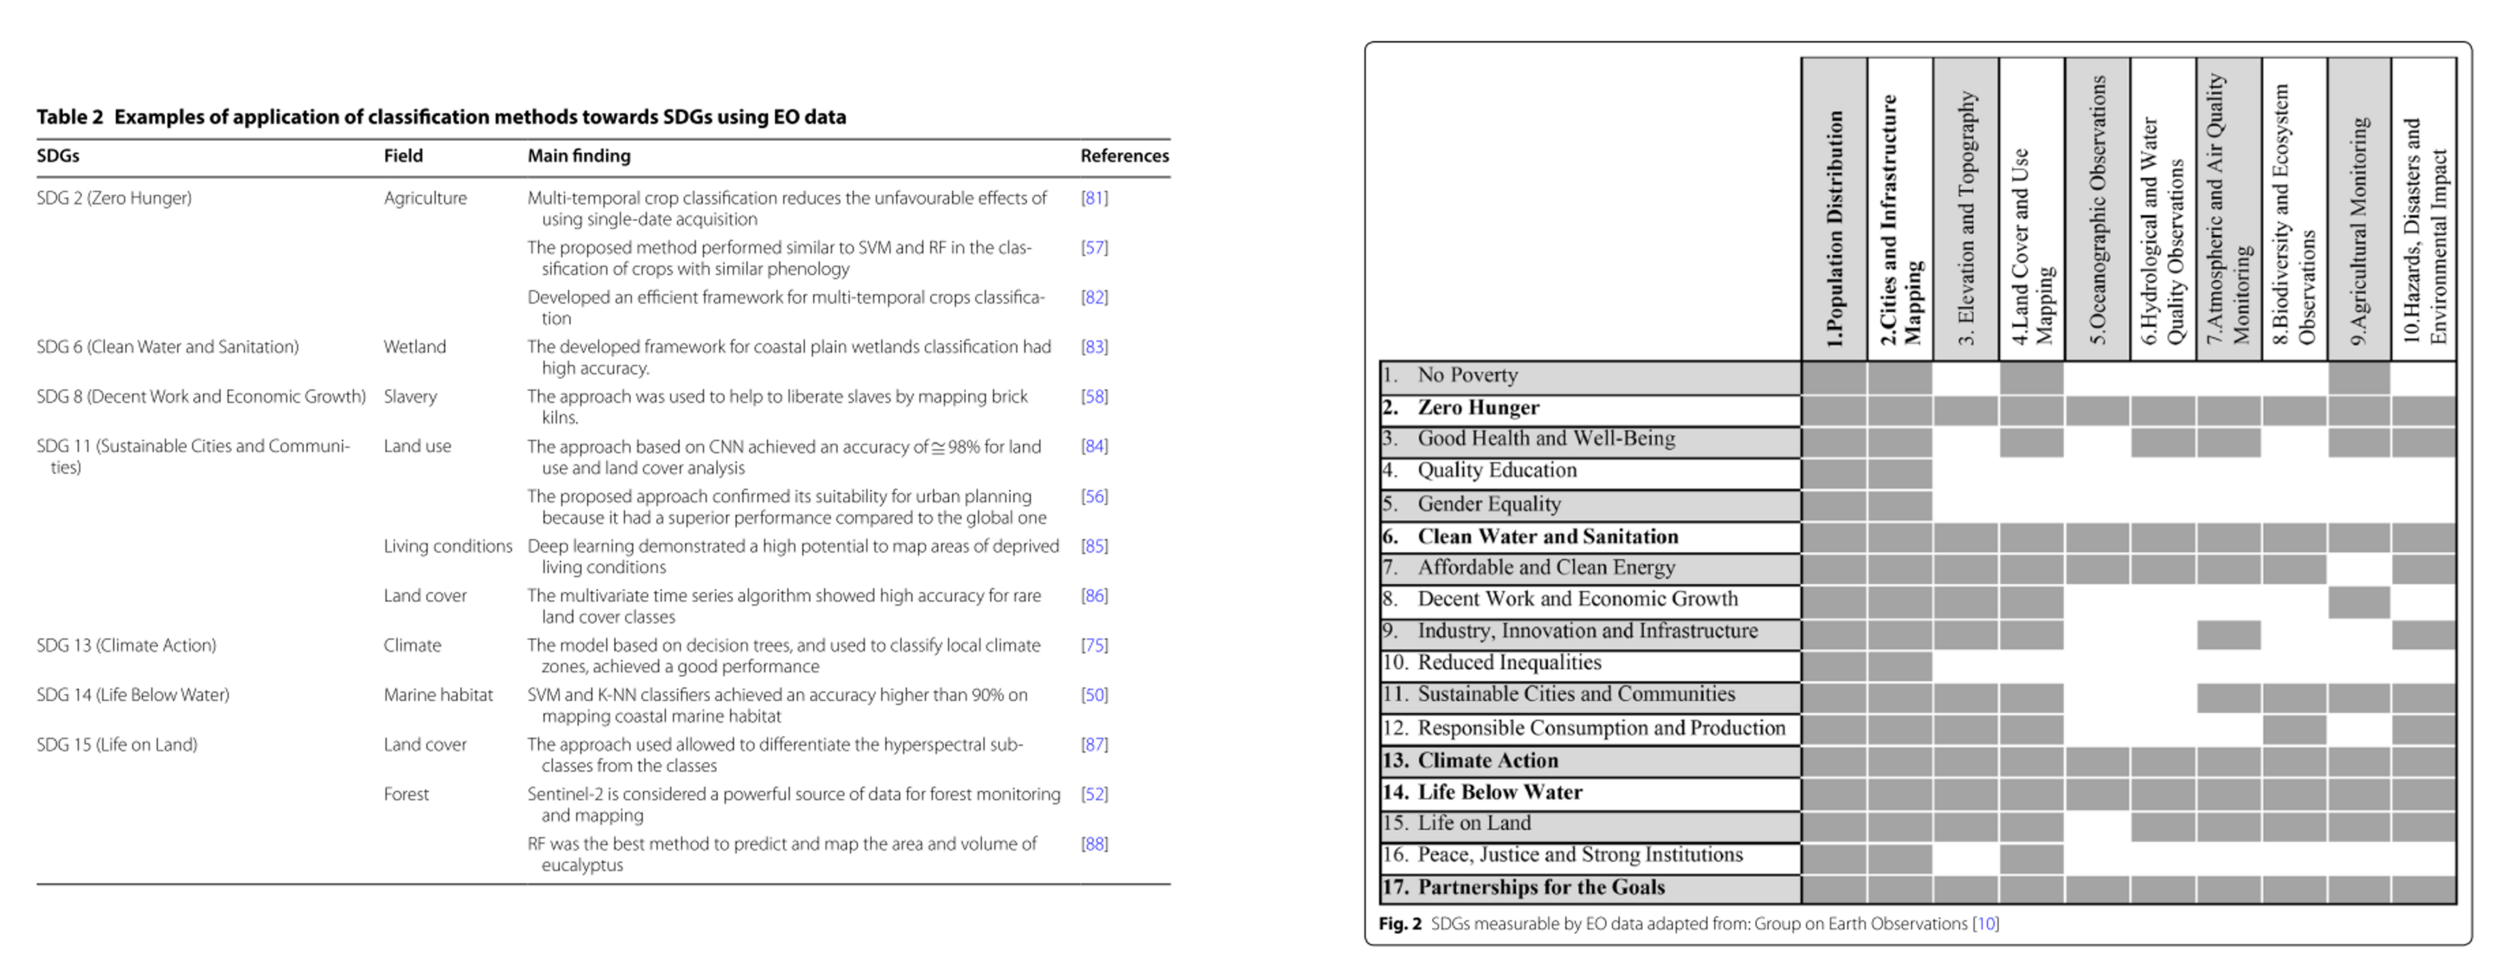
Ferreira, B., Iten, M., & Silva, R. G. (2020). Monitoring sustainable development by means of earth observation data and machine learning: a review. Environmental Sciences Europe, 32(1). https://doi.org/10.1186/s12302-020-00397-4
Q1: What role can academic research play in bridging the gap between EO innovation and its operational use by governments and NSOs for SDG monitoring and reporting?
Q2: From an academic perspective, how can universities and research institutions contribute more effectively to capacity building for better Earth Observation use in SDG monitoring?
Q3: How important is it to integrate EO and GIS training into higher education curricula to ensure a future workforce capable of supporting sustainable development monitoring?
Review!
In your own words...
What is the difference between an active and passive sensor?
What is a spectral signature?
What is a false-color composite?
How are they useful for land use change monitoring?
What is the difference between supervised and unsupervised classification?
Spatial and
temporal resolution
What do these terms mean and how are they different?

Thank you!

Earth Observation and Remote Sensing for UCU Students
By Britta Ricker


