


Brad Langhorst
New England Biolabs
using enzymatic conversion to characterize differentiation of mouse E14 cells
Bradley W. Langhorst
This talk represents the work of many people at NEB
Dan Evanich
Chaithanya Ponnaluri
Laura Blum
Sagnik Sen
Matt Campbell
Brad Langhorst
Louise Williams
Sriharsa Pradhan
NEB management:
Sal Russello
Tom Evans
Nicole Nichols
Kit Krishan
Don Comb
Differentiation 13 days
Mouse E14 ESCs
+RA
-mLIF
+N2
+N2/B27
➞ Embryonic Bodies
➞ Neuronal Progenitor Cells
➞ Neuronal
At each time point:
3x RNA-seq
3x EM-seq
3x E5hmC-seq
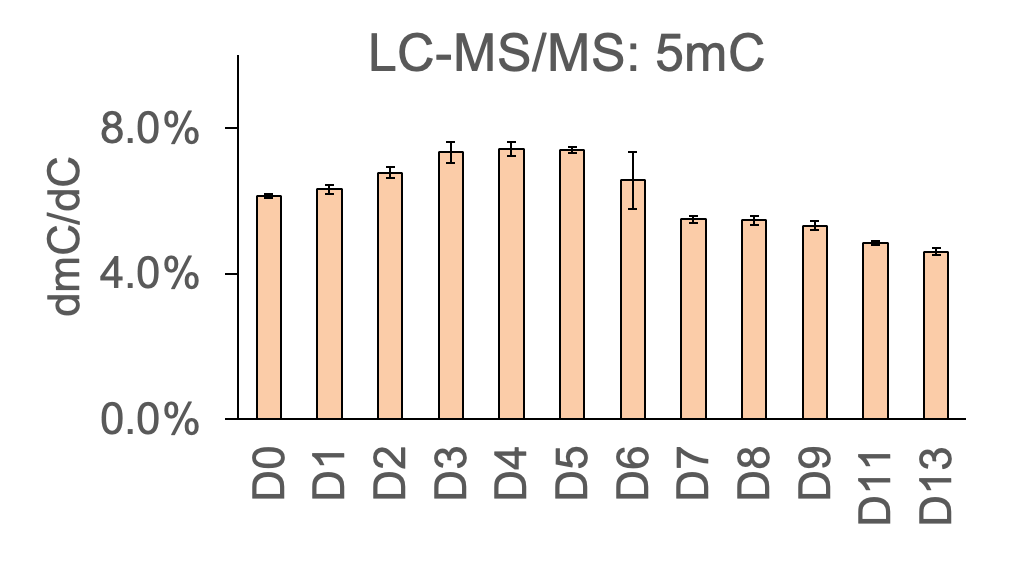
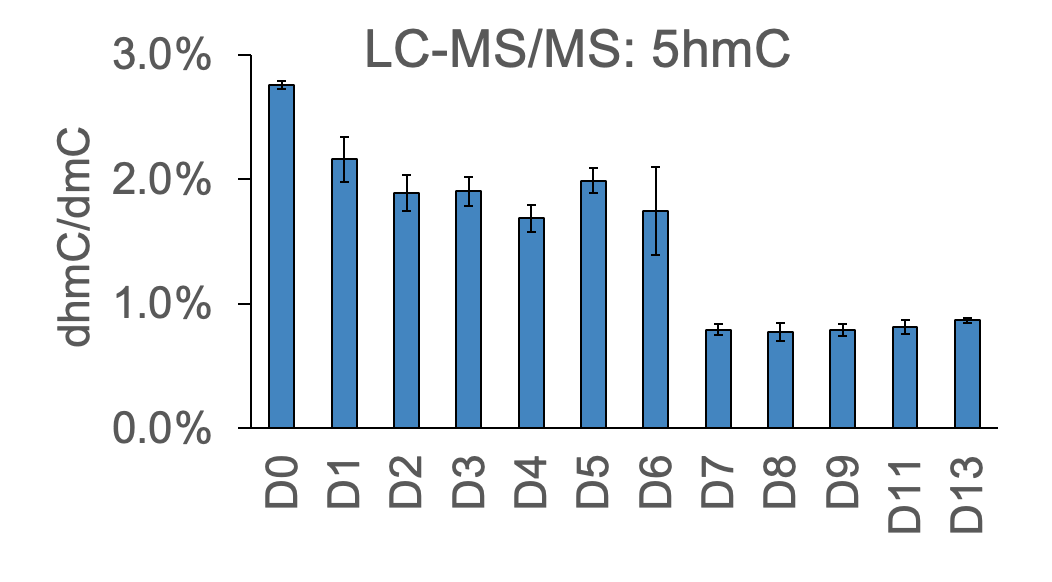
3x Nucleoside LC-MS/MS
day 0, 3x
day 1, 3x
day 2, 3x
day 3, 3x
day 4, 3x
day 5, 3x
day 6, 3x
day 7, 3x
day 8, 3x
day 9, 3x
day 11, 3x
day 13, 2x
day 10, 3x
E5hmC-seq
EM-seq
C
mC
hmC
5fC
5caC
5gmC
APOBECU
T4-BGTT
C
C
APOBECSequenced
as
Substrate
Product
APOBECU
T
C
mC
hmC
5fC
5caC
5gmC
APOBECU
TET2TET2TET2T4-BGTT
C
C
APOBECSequenced
as
Substrate
Product
APOBEC
PCR
Sequence
Tet2,BGT
Ligation
EndPrep
Fragment
APOBEC
PCR
Sequence
BGT
Ligation
EndPrep
Fragment
Adapter Trim
Trim Galore
Align
salmon, GENCODE
Differential Expression DE-seq2
Adapter Trim
fastp
Align
bwa-meth
Mark Duplicates
Picard
Methylation Analysis
Methyldackel
https://github.com/nebiolabs/EM-seqMethylKit, Defiant,
Dnmtools mlml for mC calculation
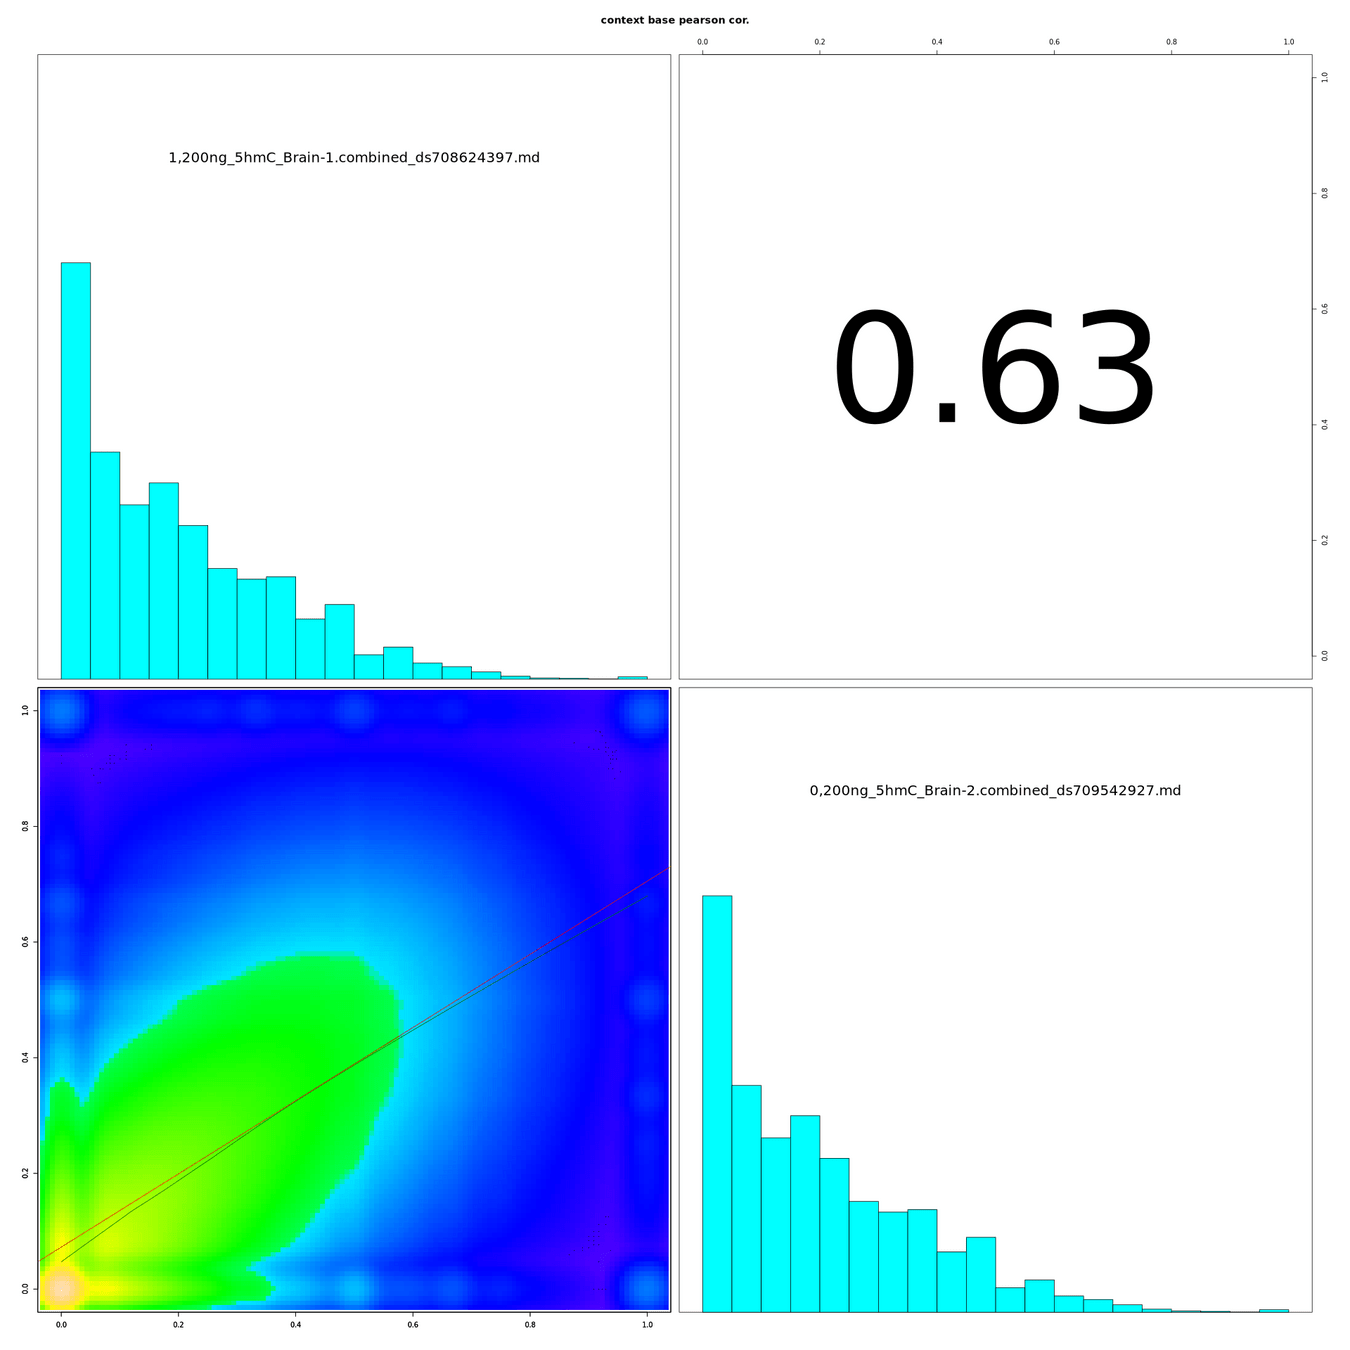
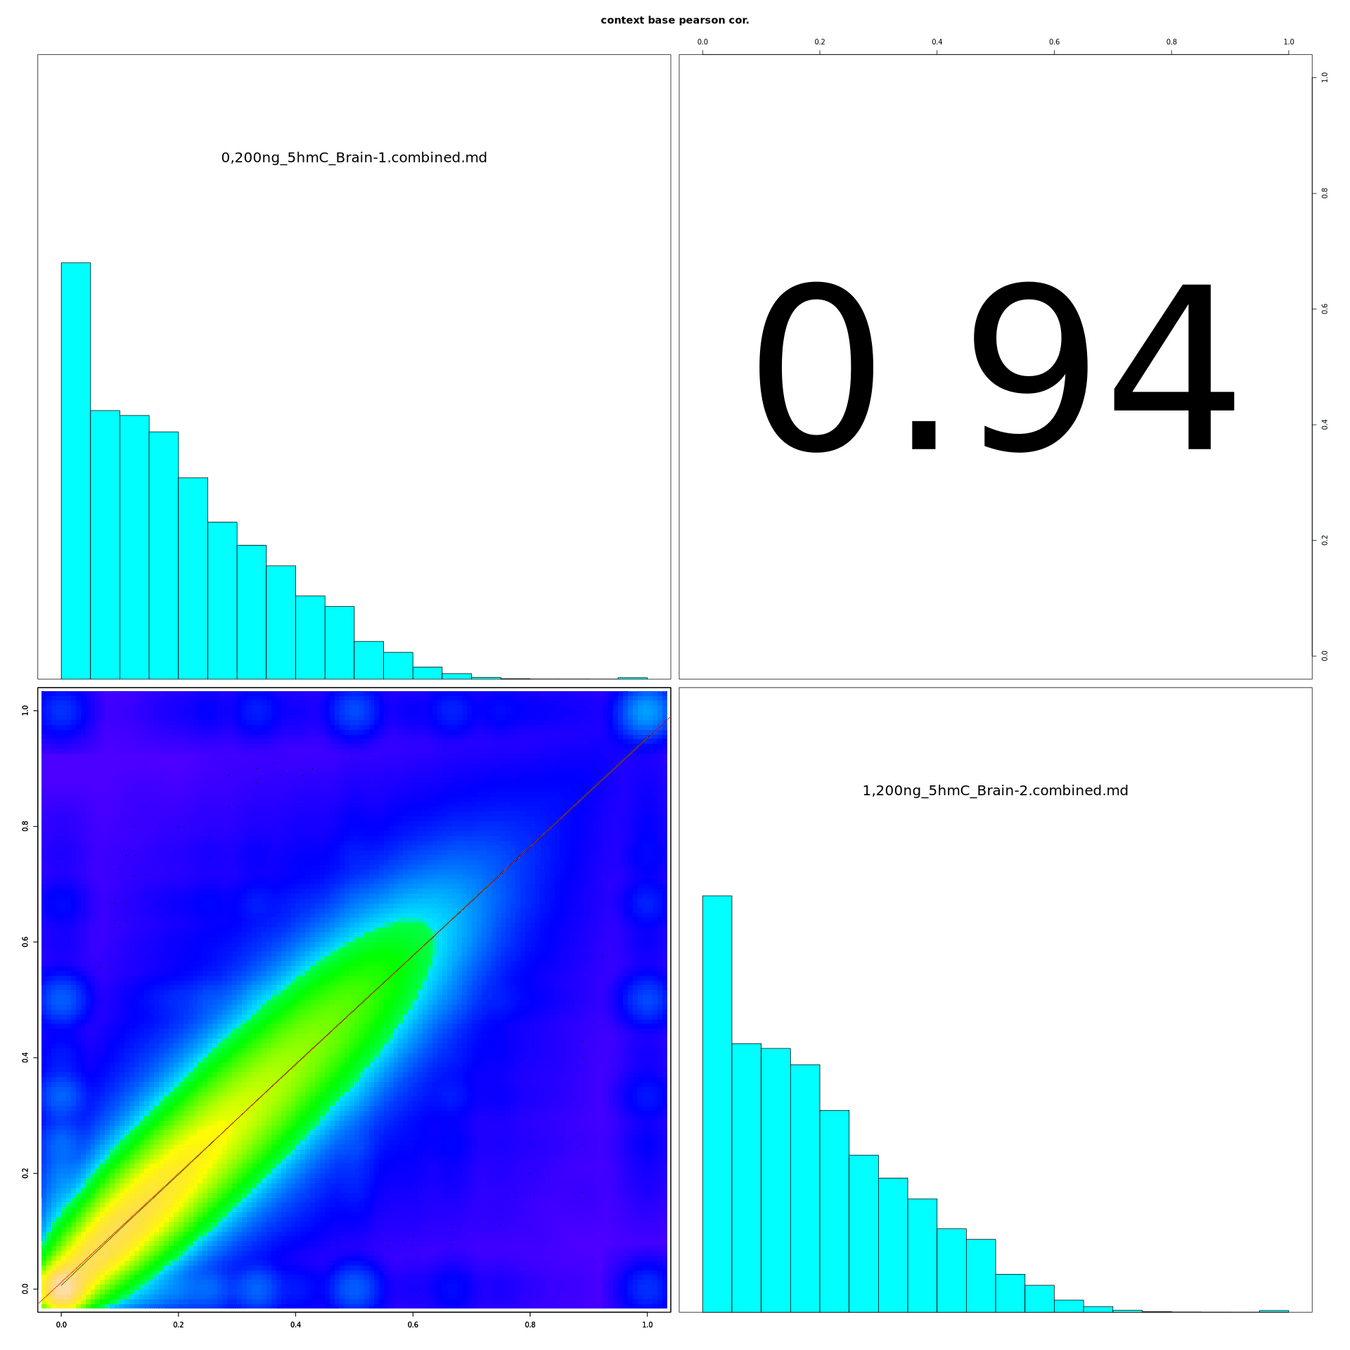
~30X coverage
~120X coverage
R^2 0.94
R^2 0.63
0
0.5
1
0
0.5
1
0
0.5
1
0
0.5
1
frac hmC rep2
frac hmC rep2
frac hmC rep 1
frac hmC rep 1
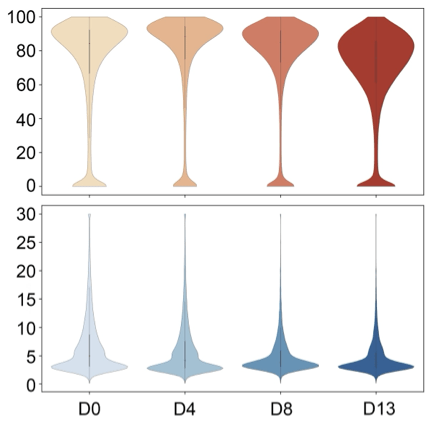
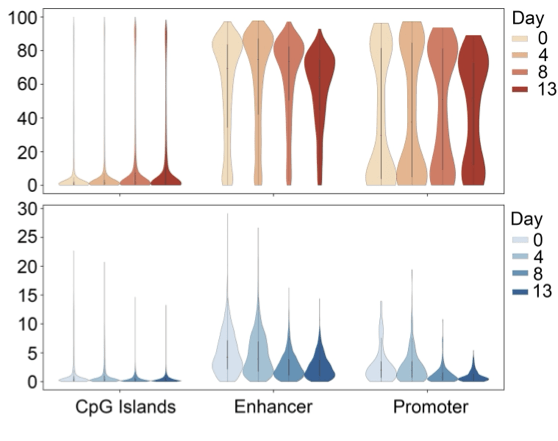
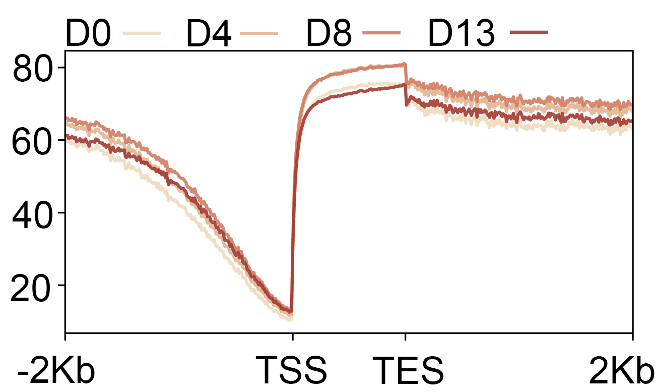
5mC
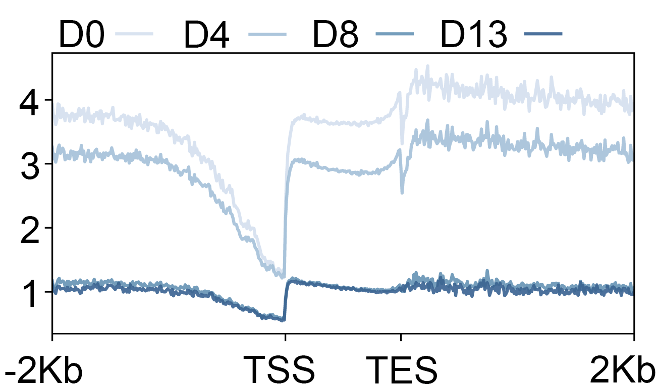
5hmC
5hmC
5mC
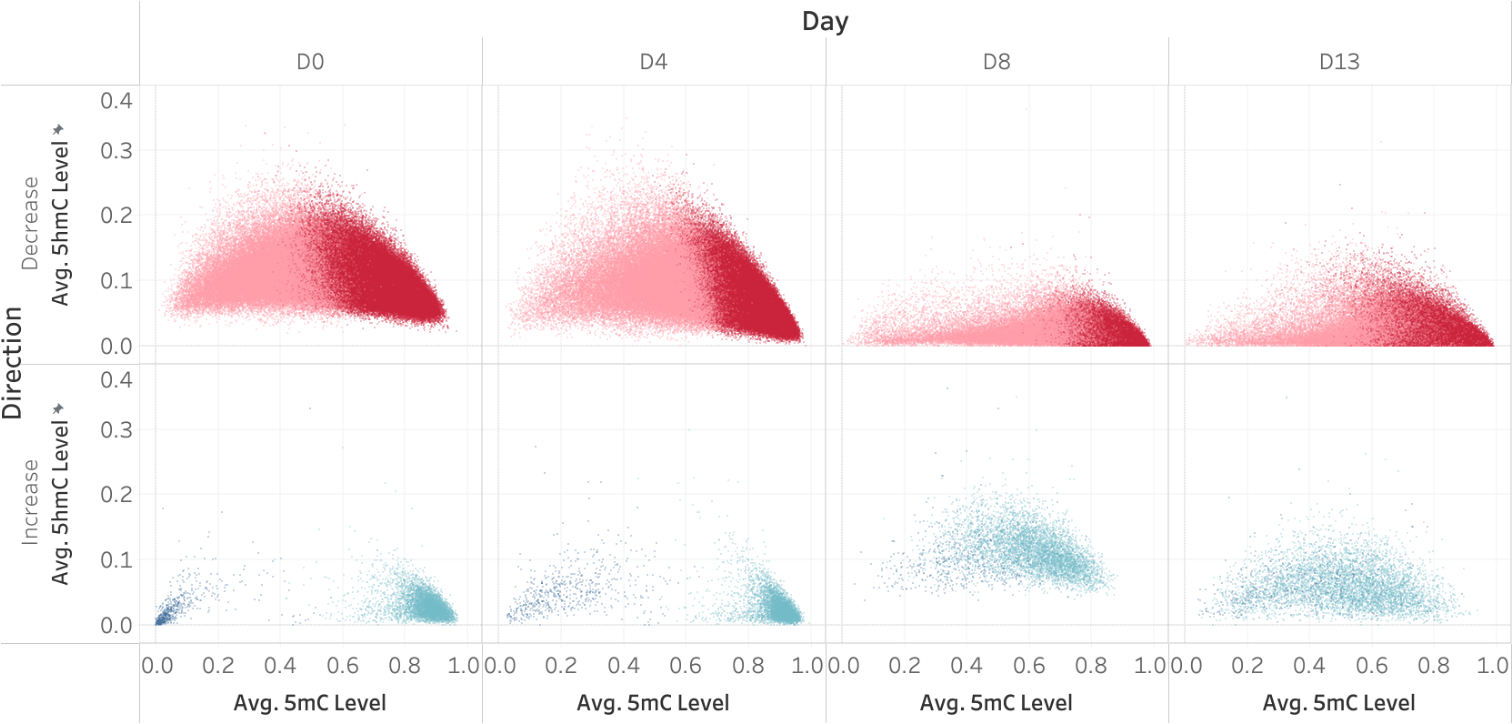
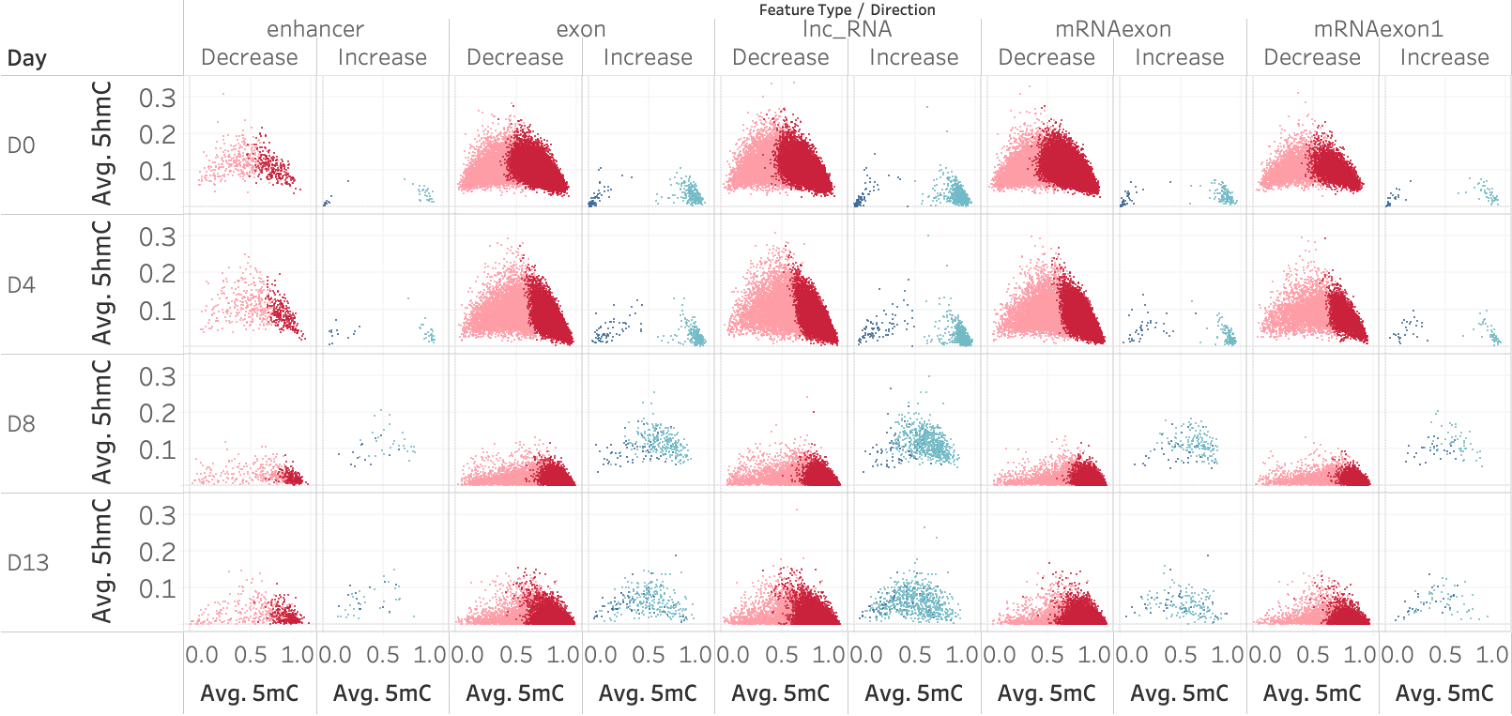
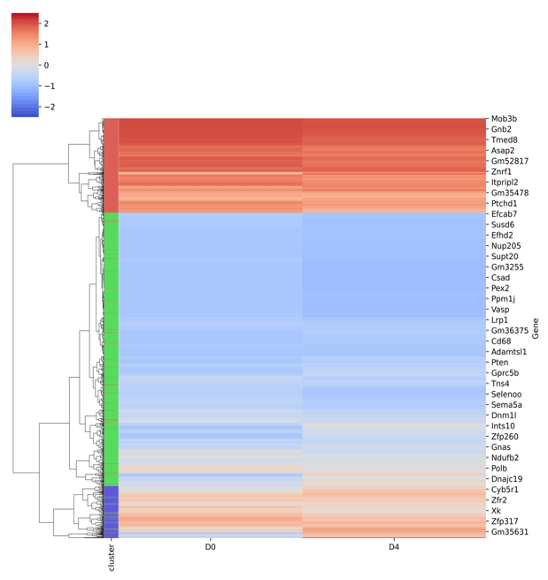
DhMRs(D0 vs D8):
⬆Clust 1
⬇Clust 1
⬇Clust 0
⬆Clust 0
DhMRs(D0 vs D8):
⬆Clust 1
⬇Clust 1
⬇Clust 0
⬆Clust 0
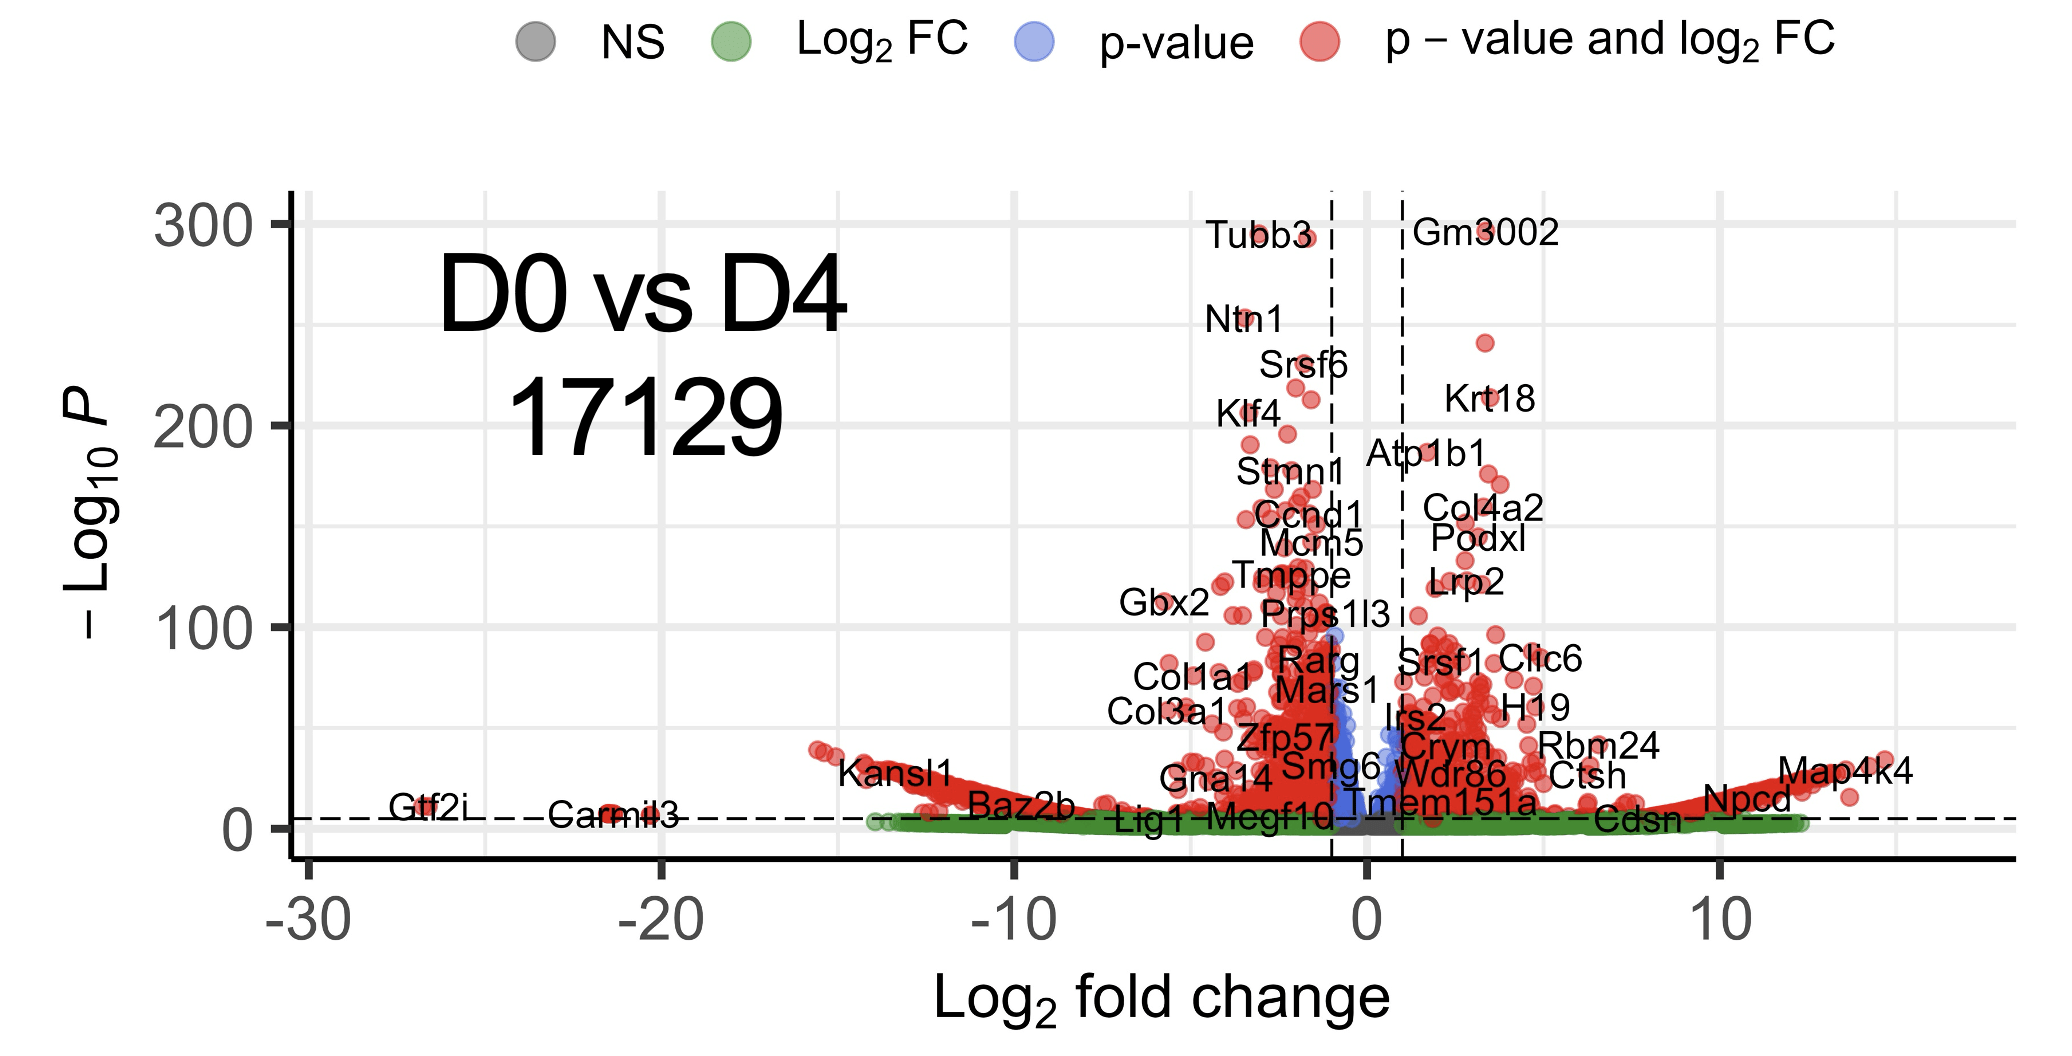
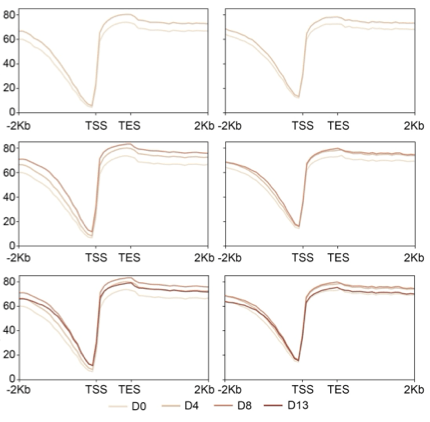
D0 vs D4 Decreasing
D0 vs D4 Increasing
Wikipedia:
When located in a gene promoter, DNA methylation typically acts to repress gene transcription. In mammals,
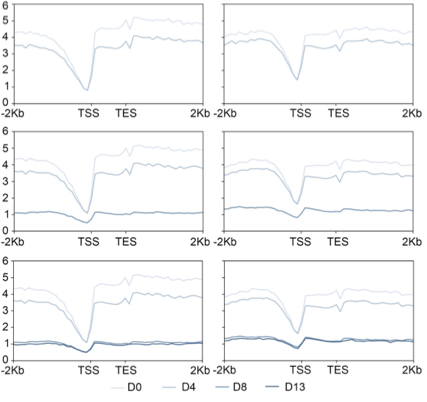
hmC
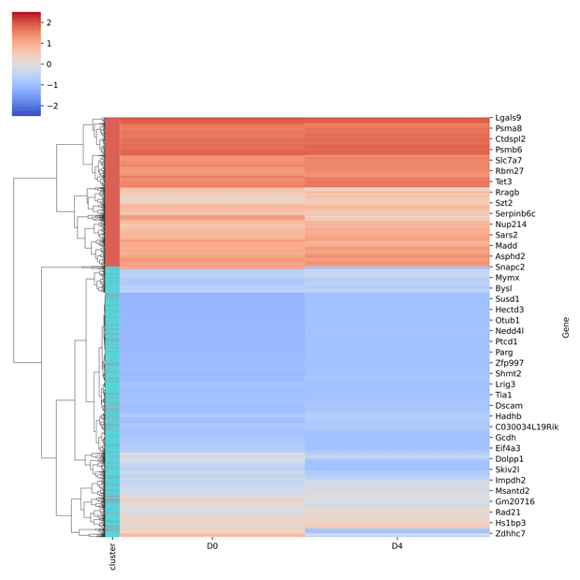
E14 ⭢ Embrioid Bodies
E14 ⭢
NPCs
E14 ⭢
Neuronal
mC
Decreasing
Increasing
Decreasing
Increasing
Zemach et. al.:
Eukaryotic cytosine methylation represses transcription but also occurs in the bodies of active genes, and the extent of methylation biology conservation is unclear.
https://www.science.org/doi/10.1126/science.1186366
Questions?
Also, talk with me about:
Multiplex PCR RSV sequencing method
Influenza-A ONT sequencing method
primer-monitor.neb.com (looking for variant overlaps)
EM-seq v2
A new small RNA method
Element, Singular and CGI library compatibility
Induro RT - for making long cDNA
By Brad Langhorst


