Infographics
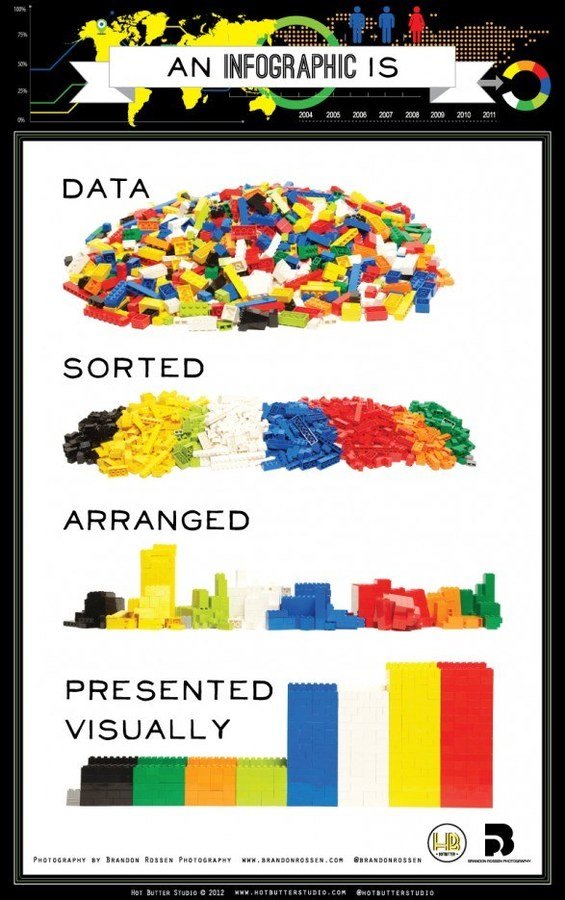
A visual depiction of information
Complex information can be explained quickly and clearly
Data can be sorted, arranged and presented visually


What is an infographic?
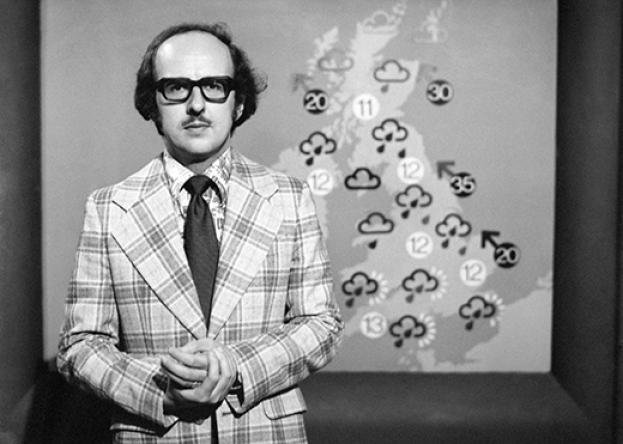
Earliest infographics?
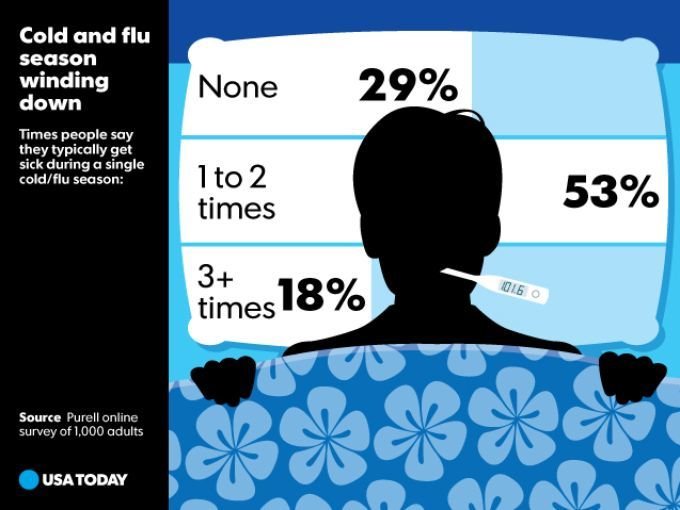
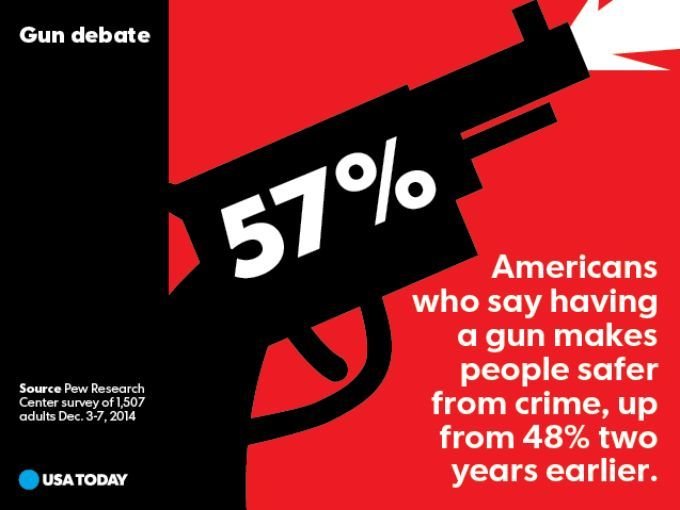
usa news snapshots
types of infographics
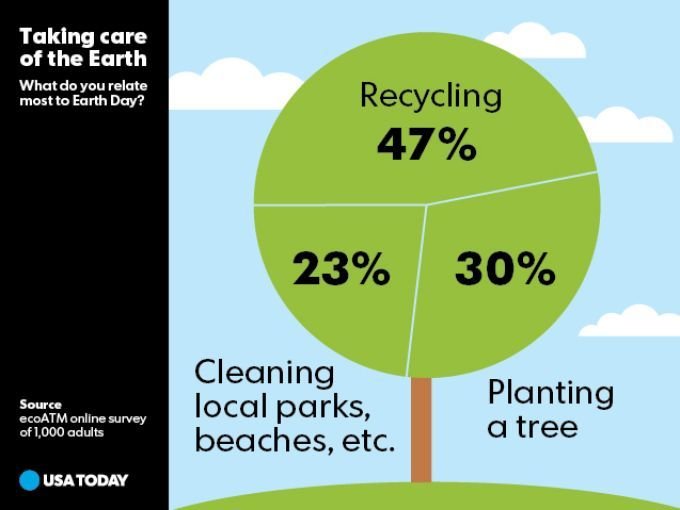
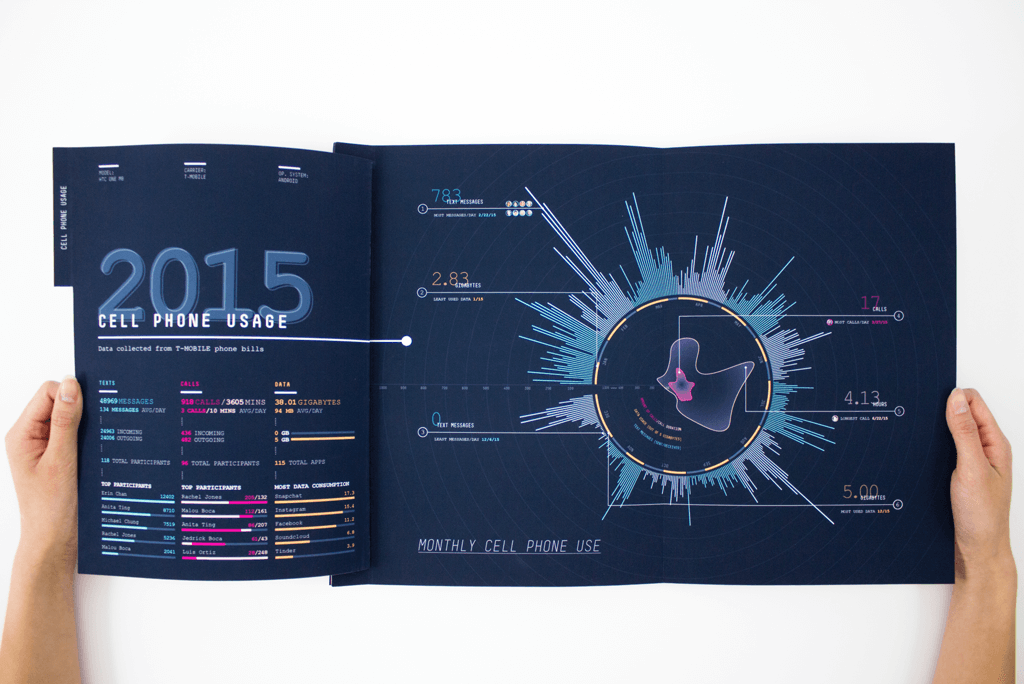
stastistical
Large amounts of similar data
Numerical data
**Yearbook idea: Club Involvement
Source: InformationIsBeautiful.net
by David McCandless
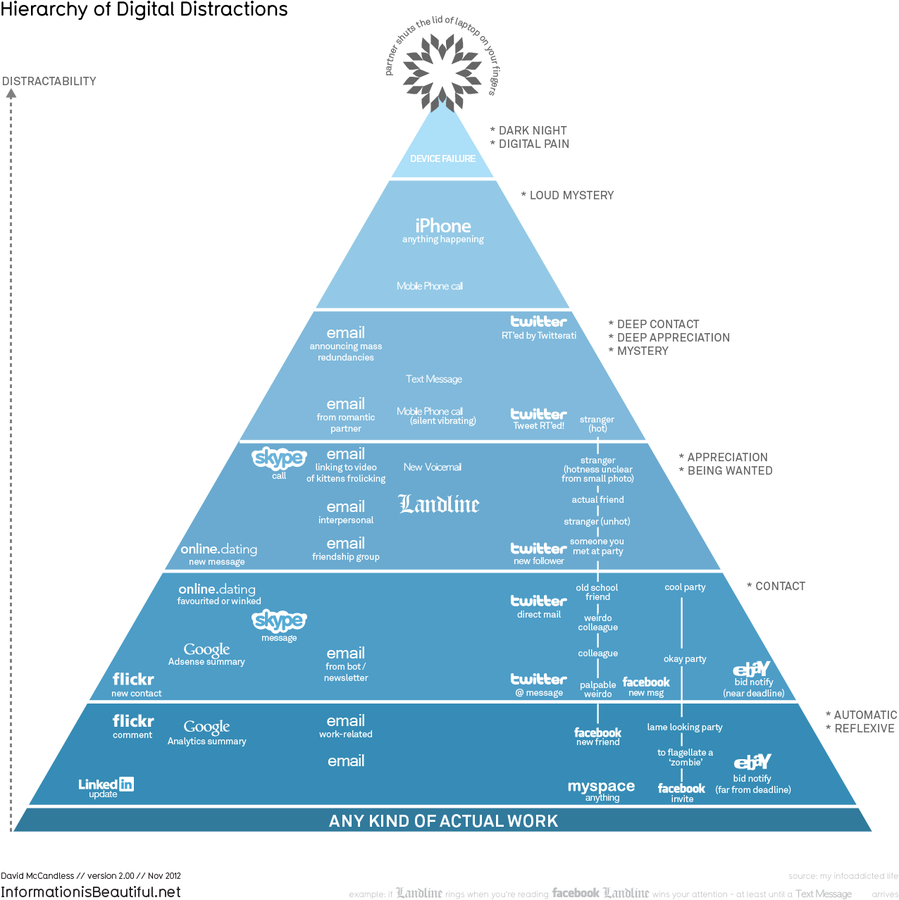
Hierarchy
Great for comparisons
**Yearbook idea: Student Stressors
Source: InformationIsBeautiful.net
by David McCandless
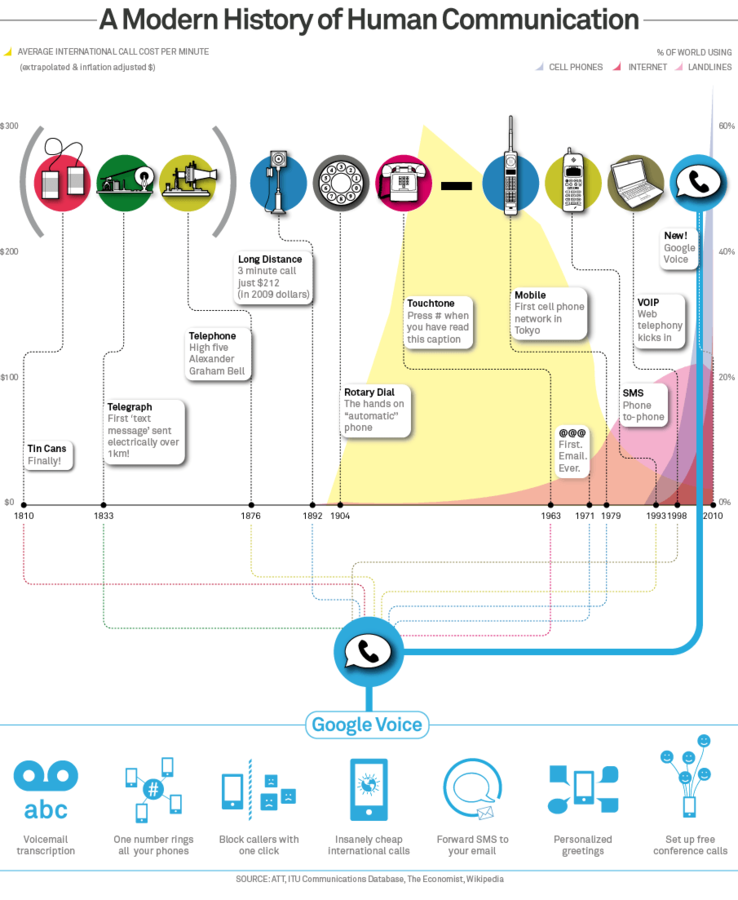
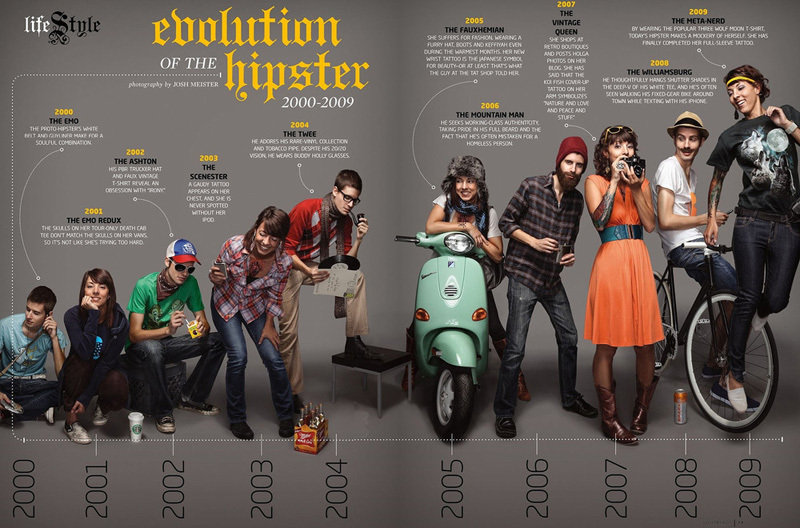
Timeline
Show passing of time
Show a progression
**Yearbook idea: History of Millennial Communication
Source: Flowingdata.com
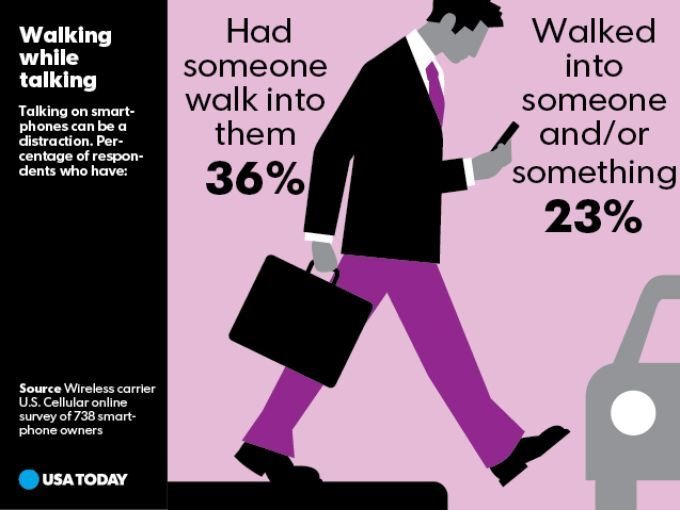
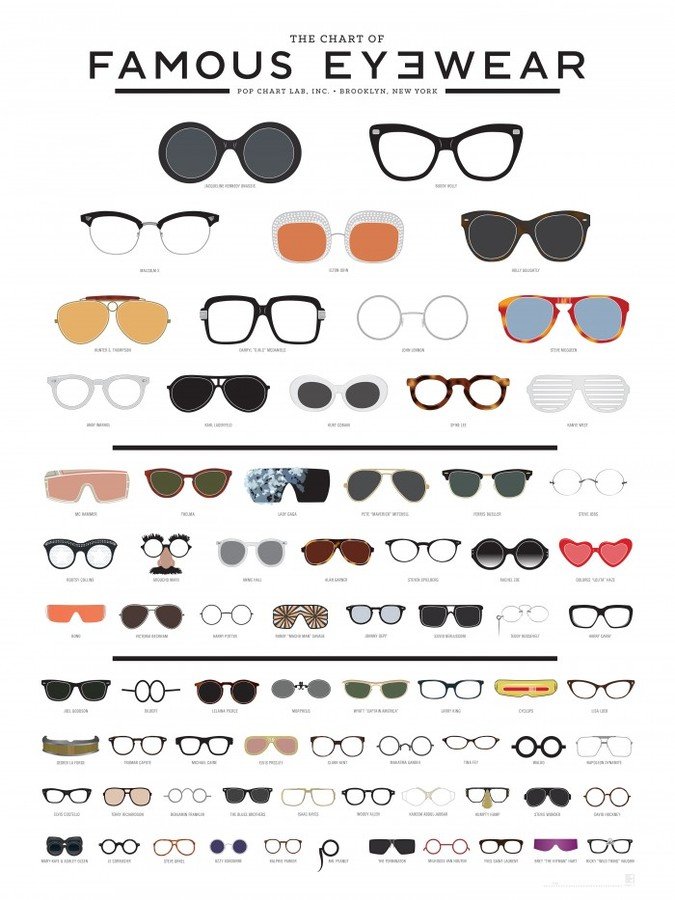
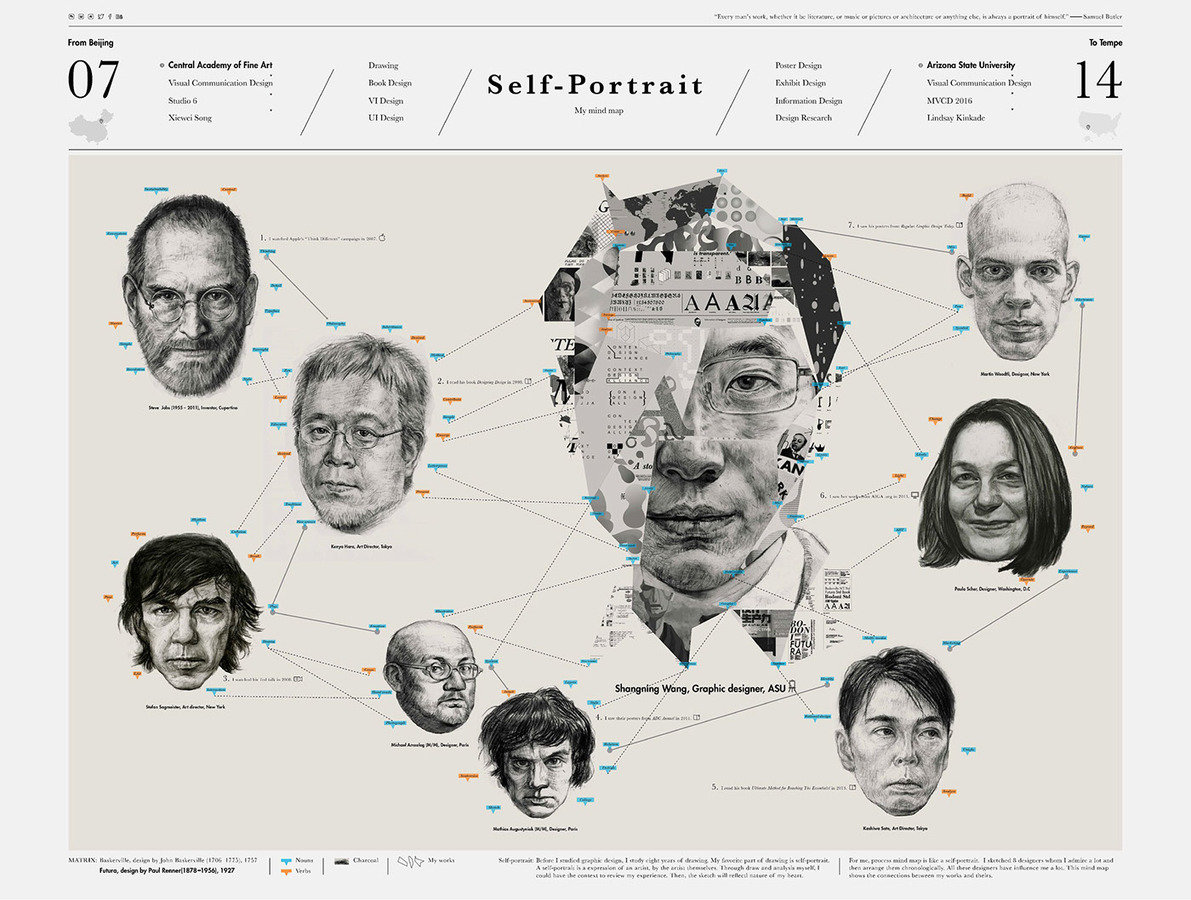
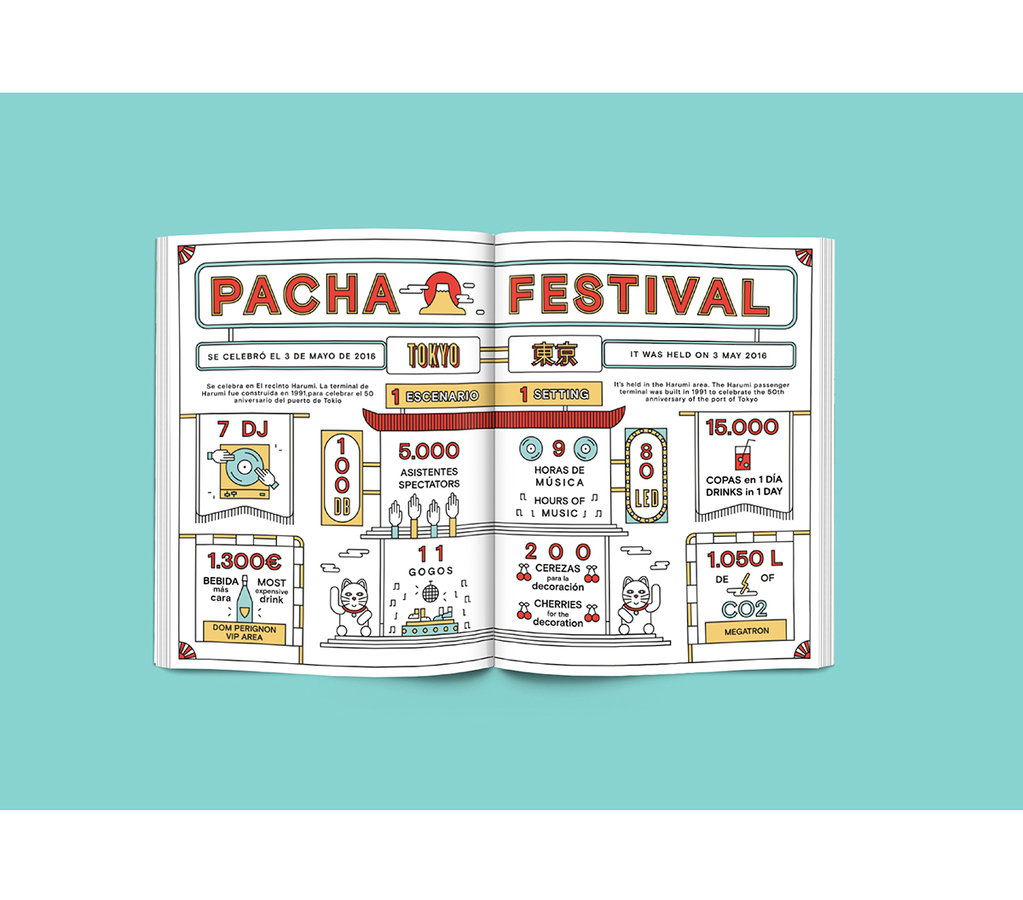
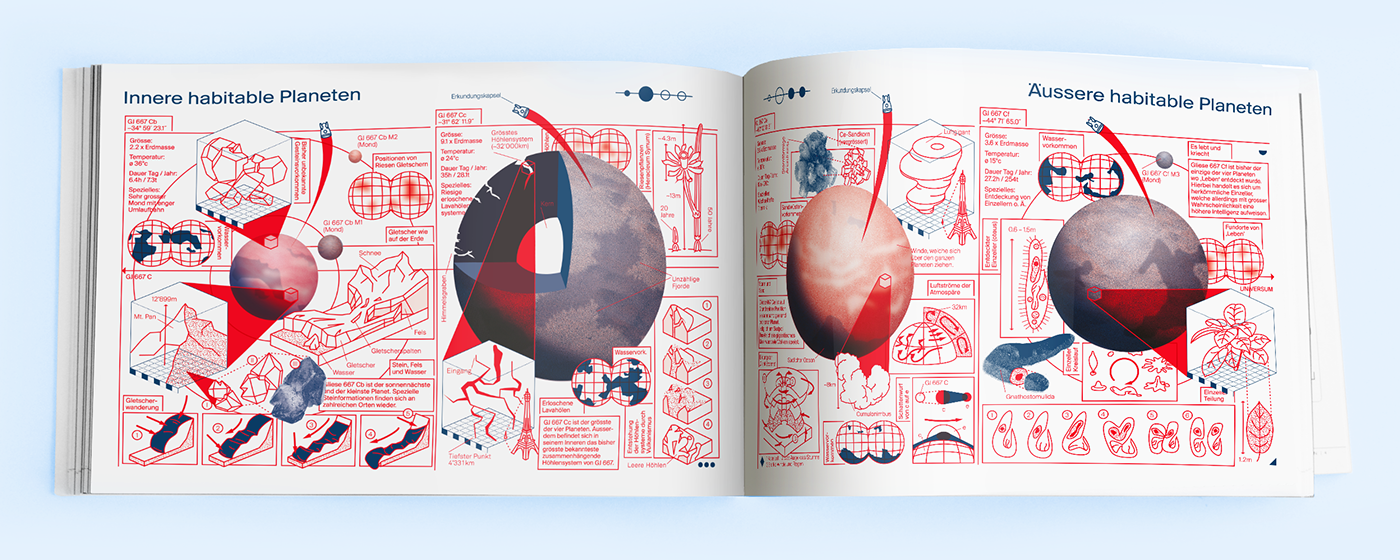
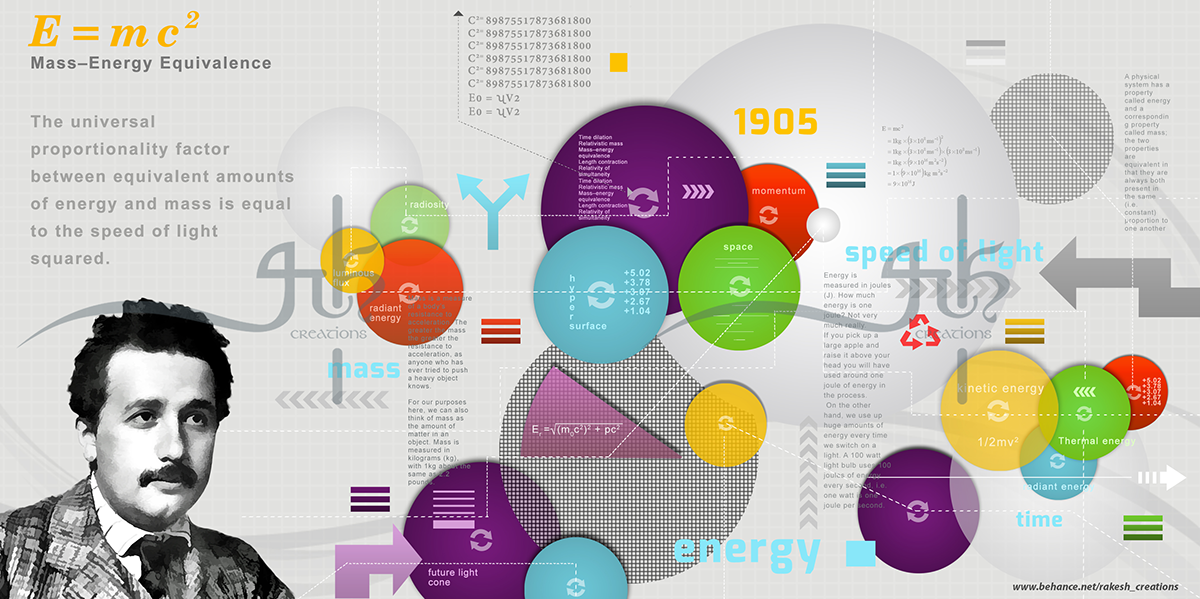
Visual/informational
Icons work great!
Visual sources as opposed to numerical data
**Yearbook idea: Must Have Academic Accessories
Source: dailyinfographic.com
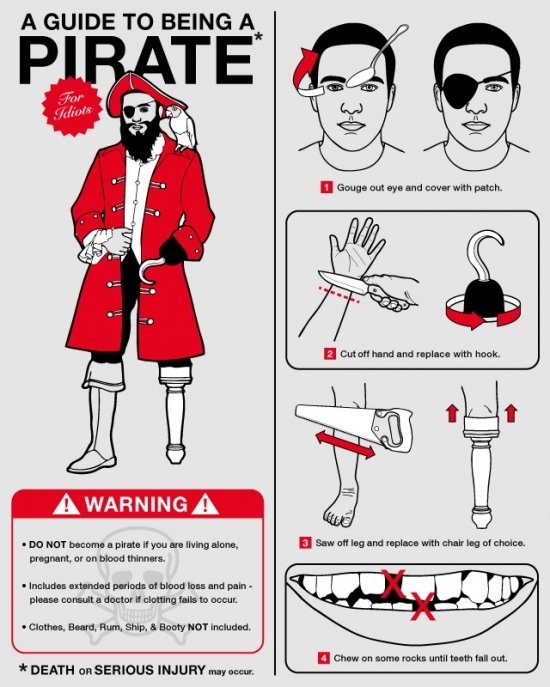
Process
How to . . .
**Yearbook idea: How to Be a Super Fan
Source: dailyinfographic.com
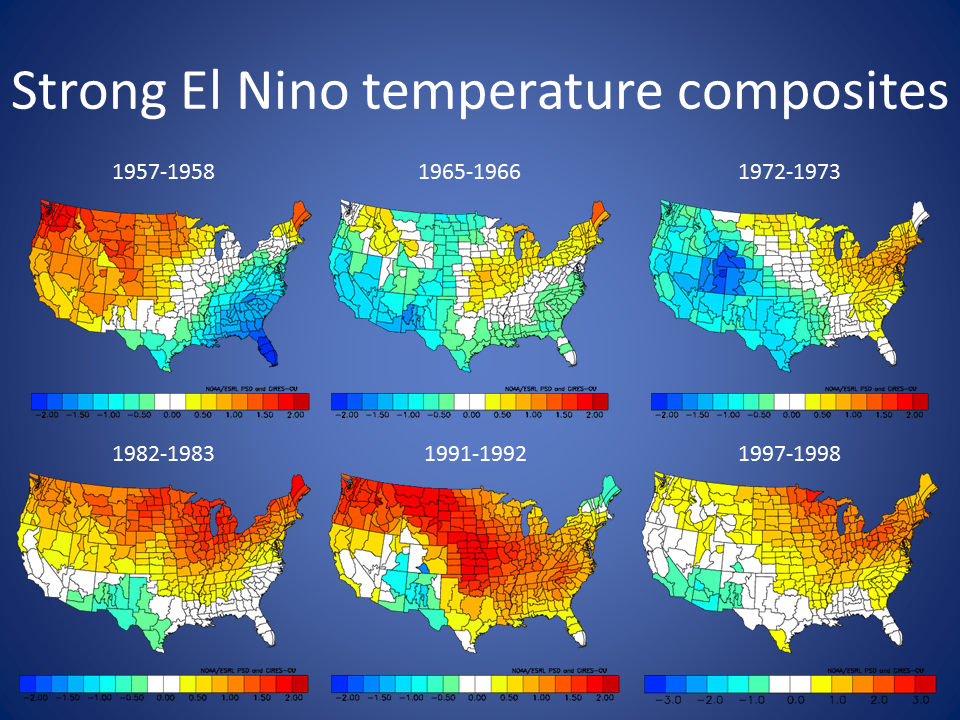
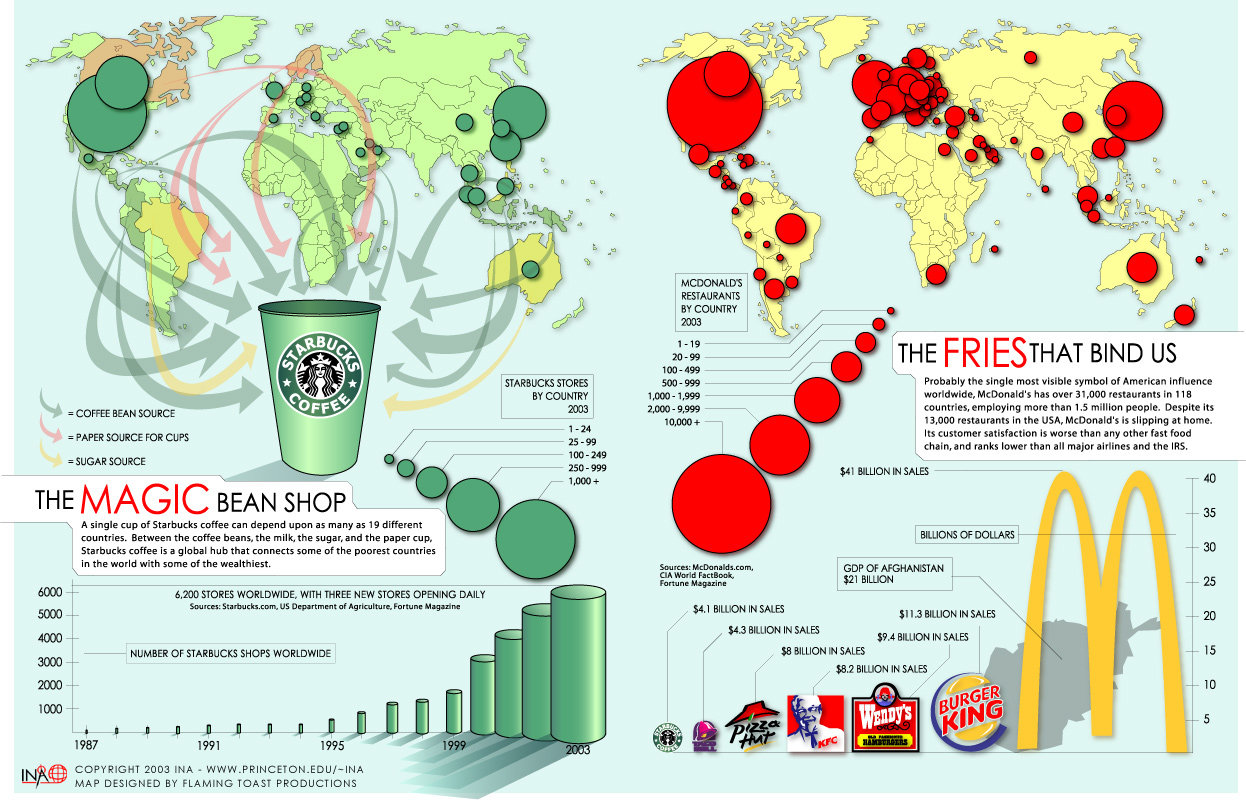
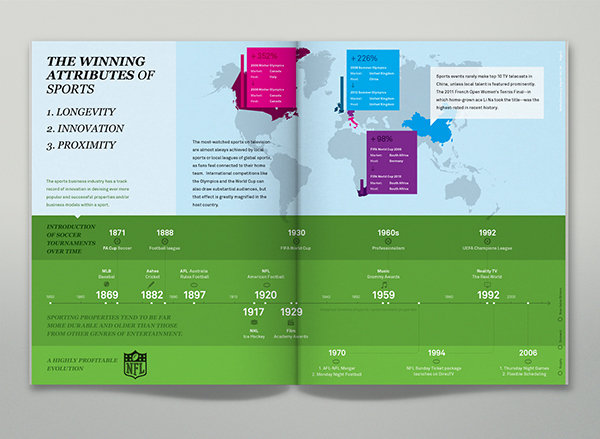
Map/Location Based
Show origins of . . .
Show popularity/
prevalence of . . . .
** Yearbook Idea: The Place to Be
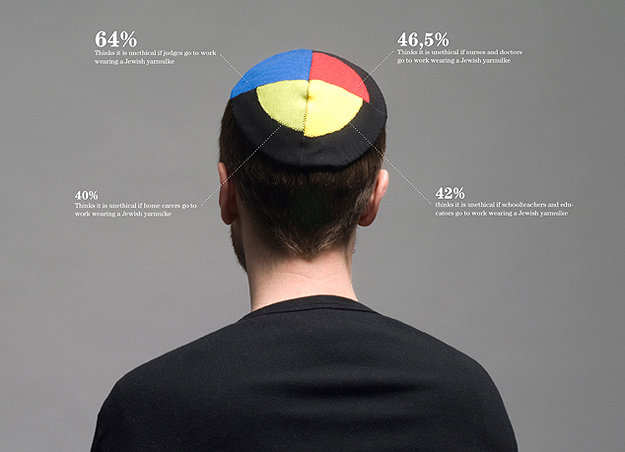
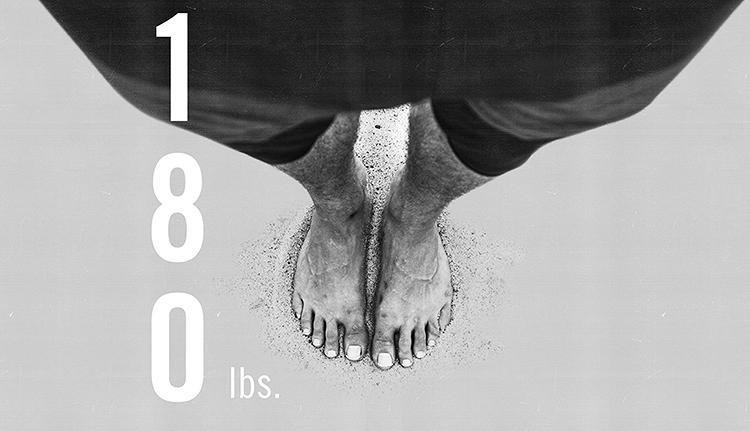
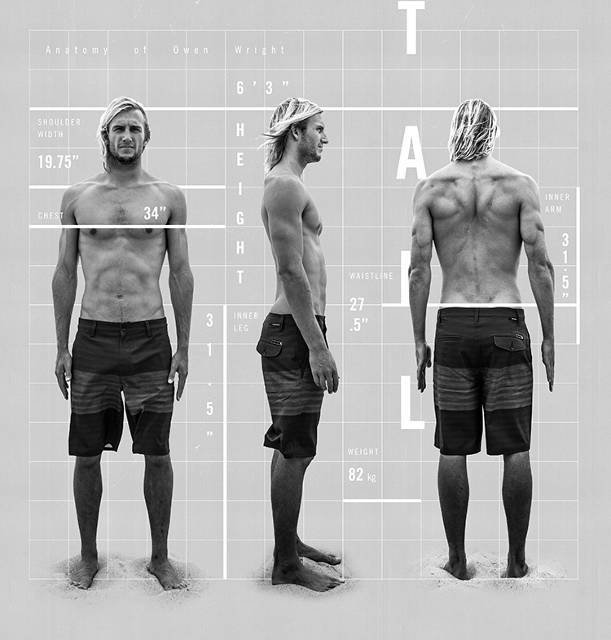
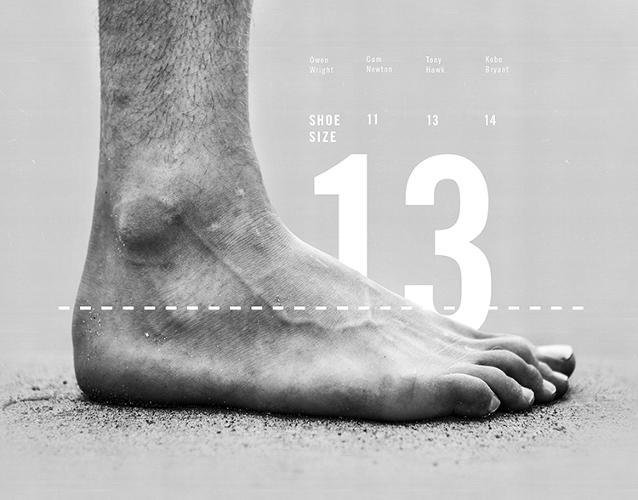
Map/Location Based
Not just for geographical maps!
**Yearbook idea: Anatomy of a Track Star/Music Star/Math Genius
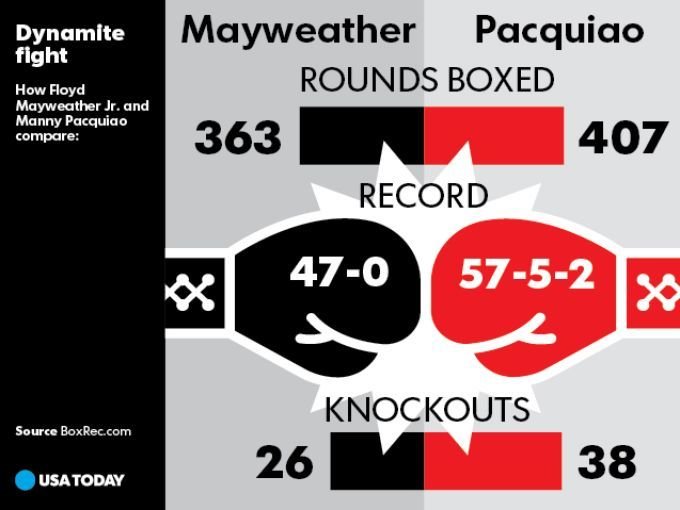
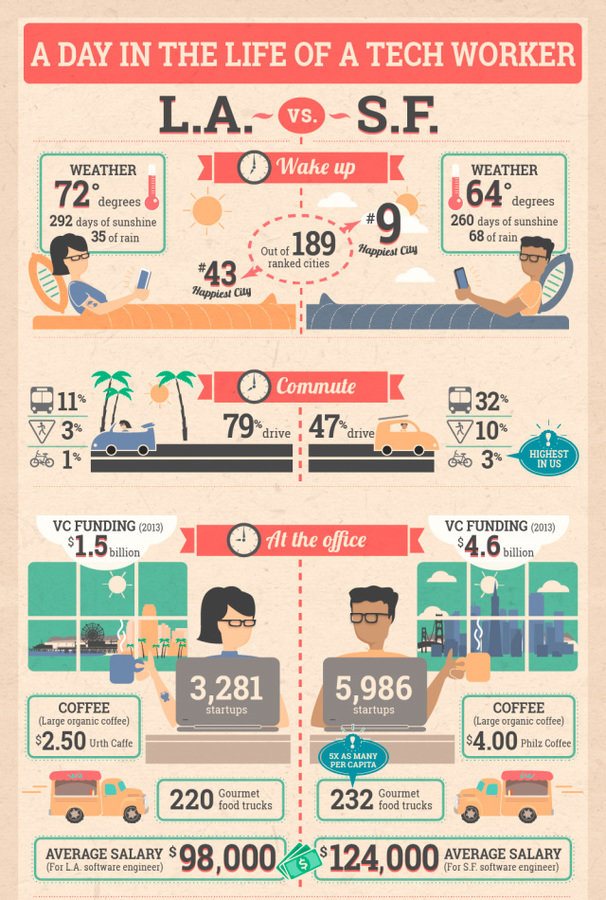
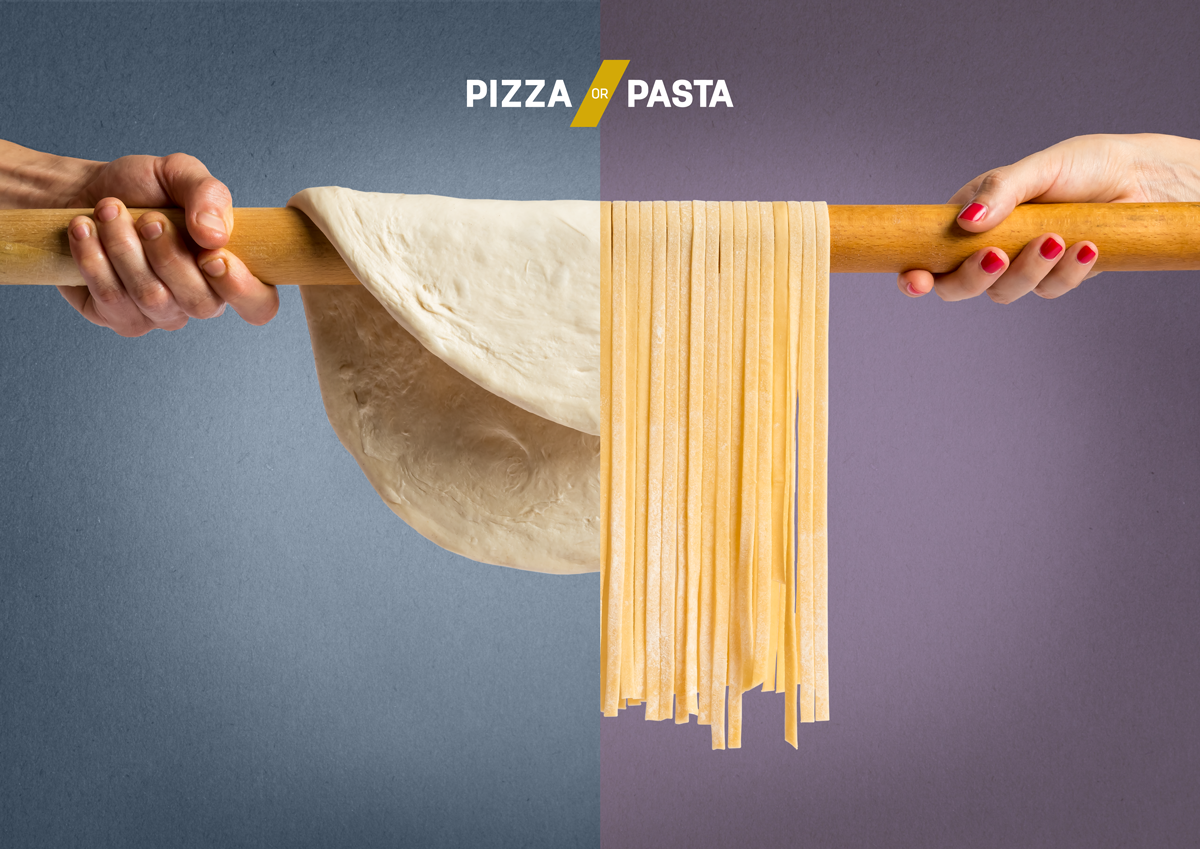
Versus
Great for comparison
**Yearbook idea: Spanish vs Mandarin
Source: Visual.ly.com
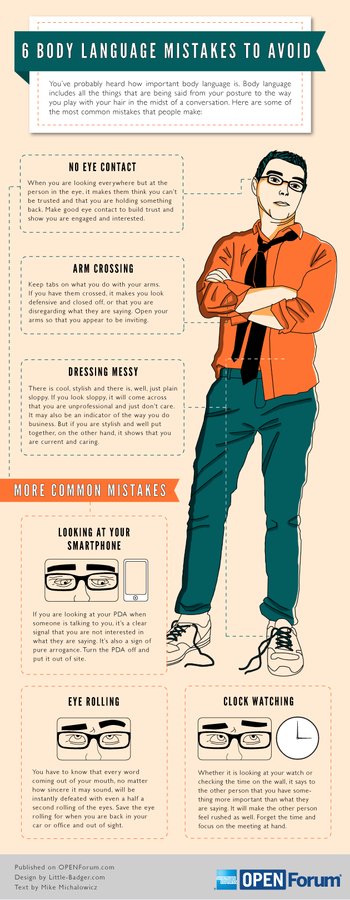
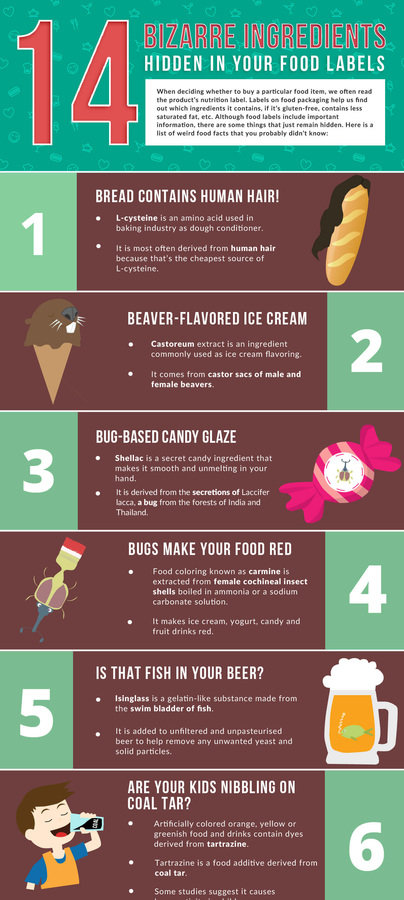
Lists
**Yearbook idea: Teachers' Habits
Source: dailyinfographic.com
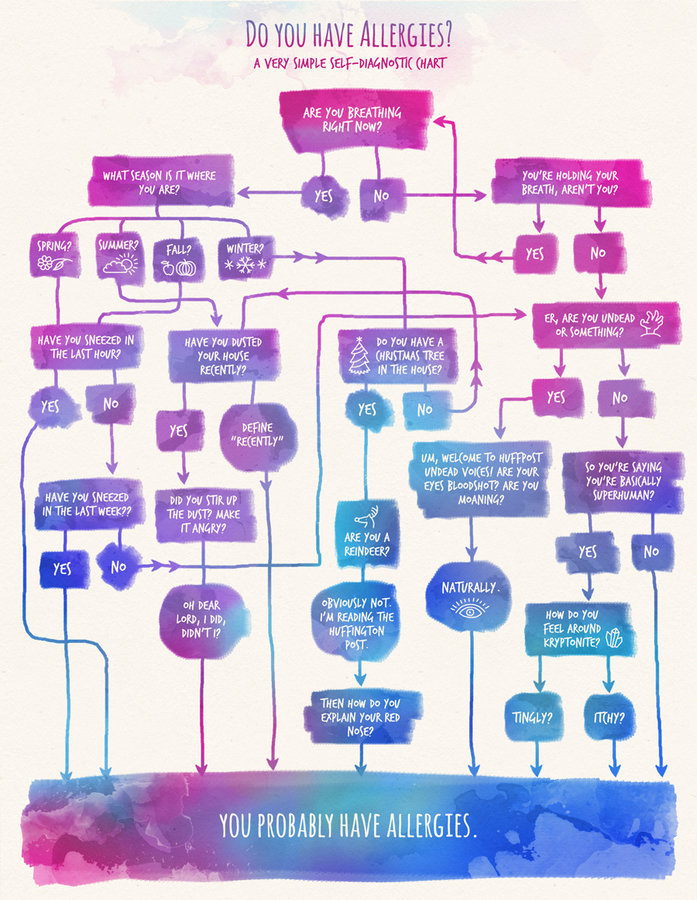
FLow Chart
Interactive
**Yearbook idea: Which Club is Right for You?
Photographic infographics
Not just icons!

Go Big?
Sidebars, MODS or entire spreads!
Inspiration


Resources
Contact Me
Cara Foster
Whitfield School
cara.foster@whitfieldschool.org


Infographics
By carafosterstl
Infographics
Created for J Day at SEMO 2016 by Cara Foster


