Profiling your
web app
1 August 1991
25 years ago
Tim Berners-Lee published
the first website
Average Page Size
2.4 MB
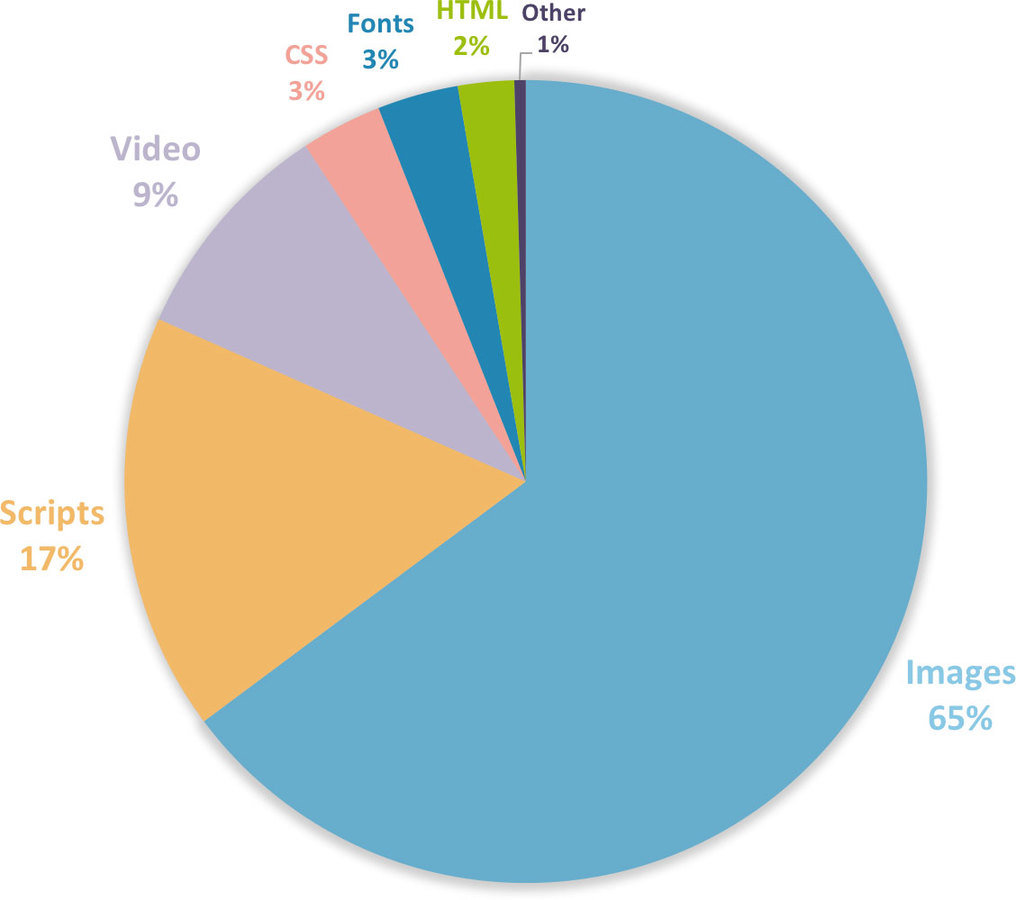
http://httparchive.org/interesting.php?a=All&l=Jul%2015%202016
14%
increase since 2015
33%
increase since 2014

What it is
- Page Performance
- Dynamic
- Custom
- Developer tool
- Product tool
What it isn't
- Just performance metrics
- Once-and-done
- One-size-fits all
- Post-dev process
- Report
Who should worry about profiling?
-
Engineers
- Back-end, Front-end, DevOps
- UX
- Product Management
- Support
- Everyone
(except HR and Accounting)
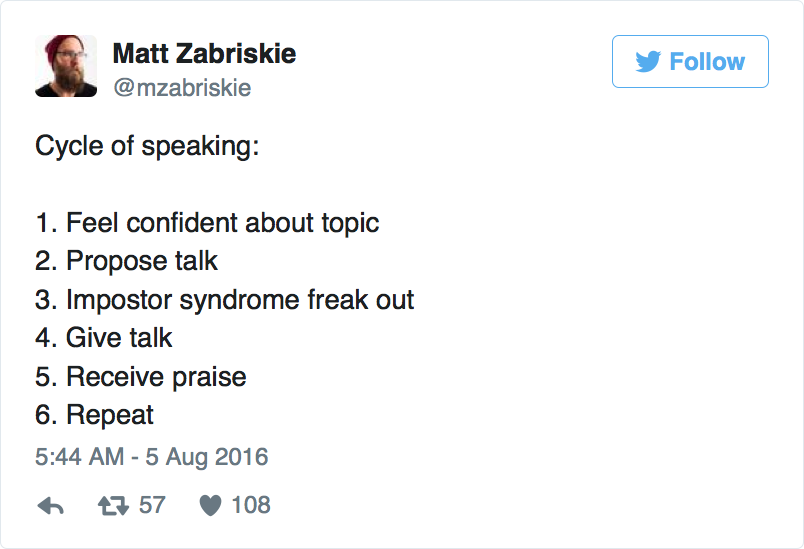
What does successful profiling look like?
- Ask the right questions
- Highlight successes
- Isolate flaws
Don't be selfish

Open Your DevTools
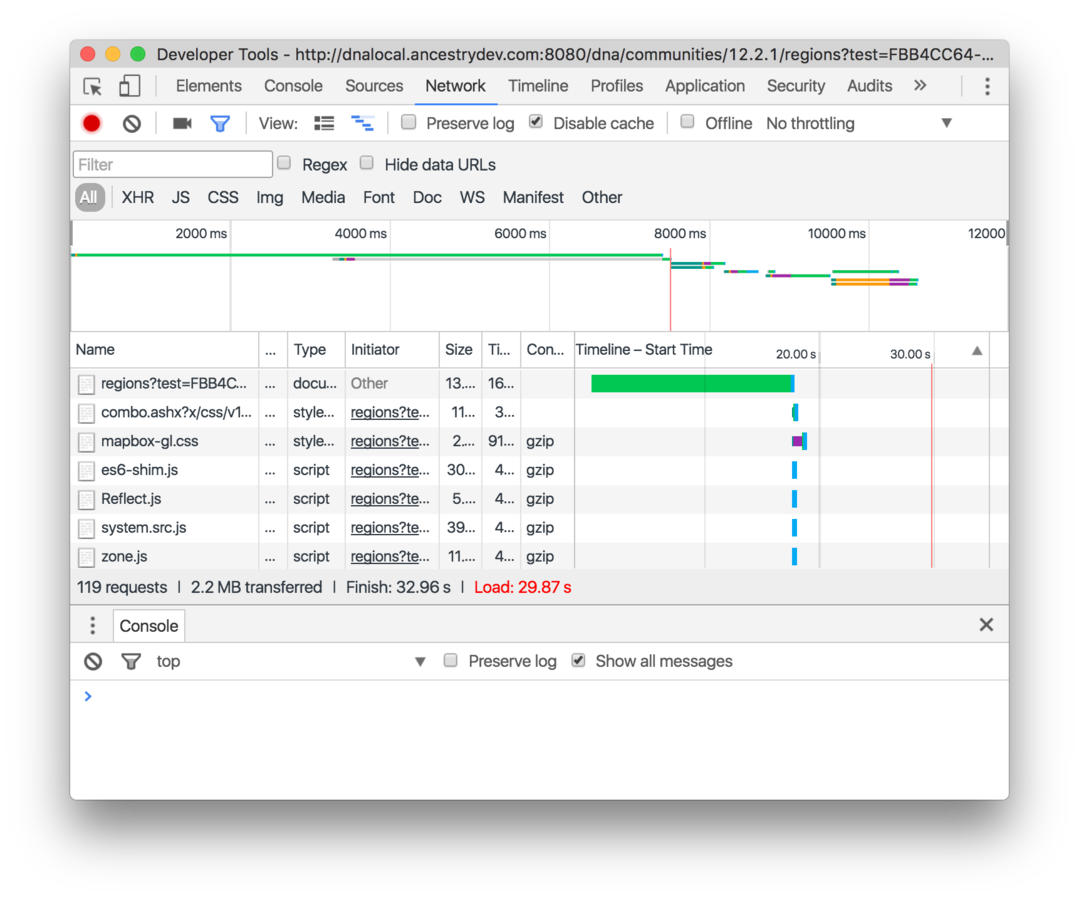
Network tab
- Requests/
Duration - Errors
- File sizes
- Time in flight
- Summary
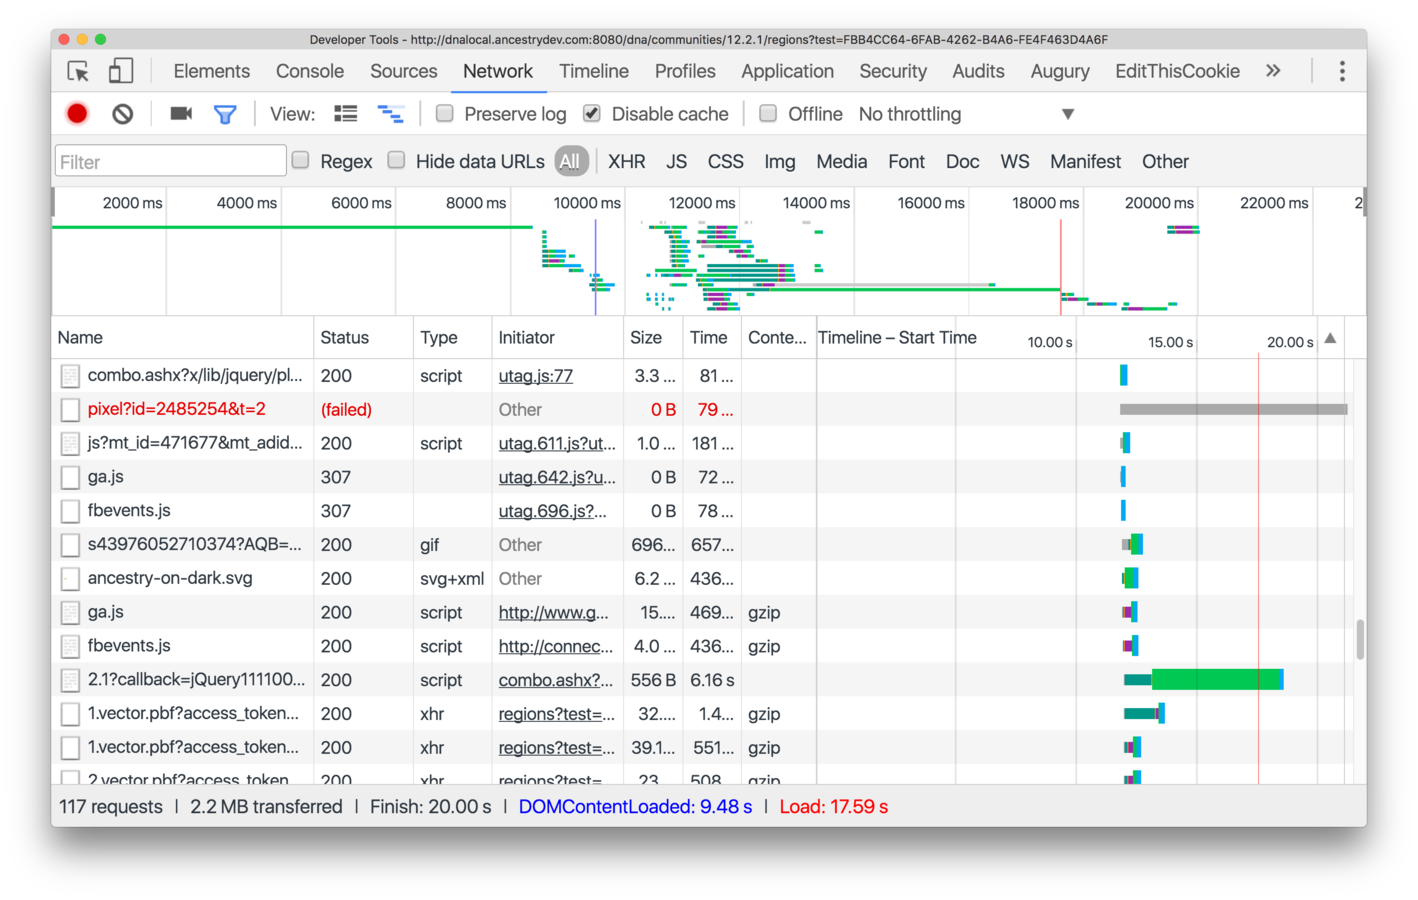
Network tab
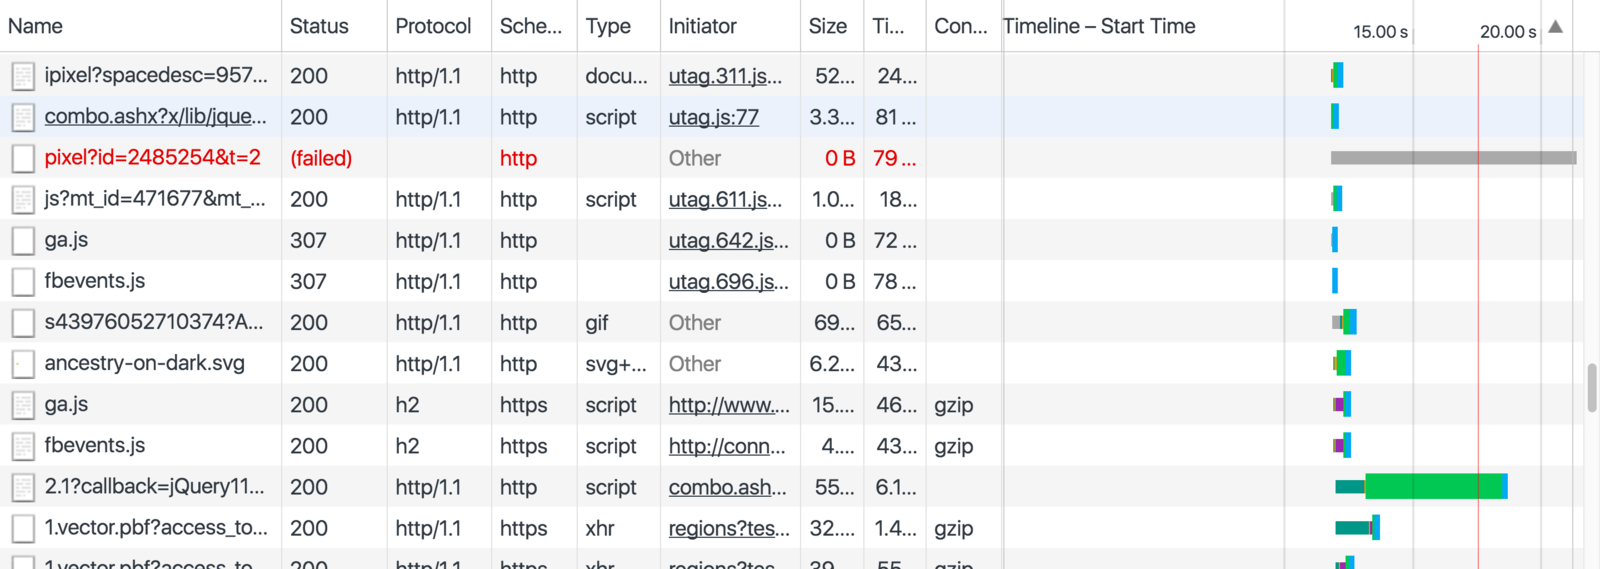
Protocol
(http2, SPDY)
Content-encoding
(gzip)
Timeline tab
Overview
Screen captures
JS flame chart
Details

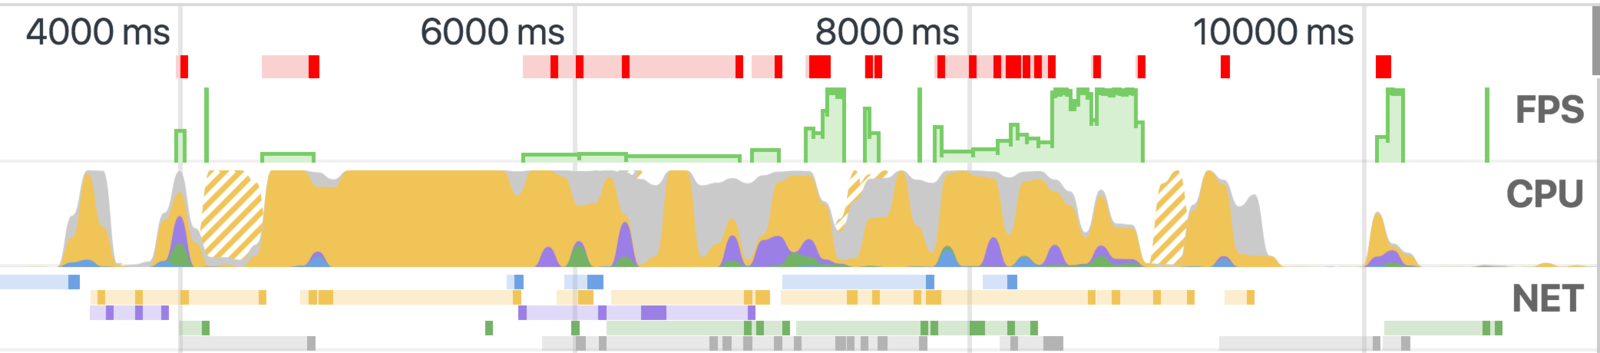
FPS
- Higher green bar, higher FPS
- Red blocks above are long frames, likely candidates for jank
CPU
-
CPU resources consumed by event type
- Striped colors == off of the main thread
NET
- Each bar represents resource request over time
| HTML Files | Scripts | Stylesheets | Media Files | Miscellaneous |
|---|
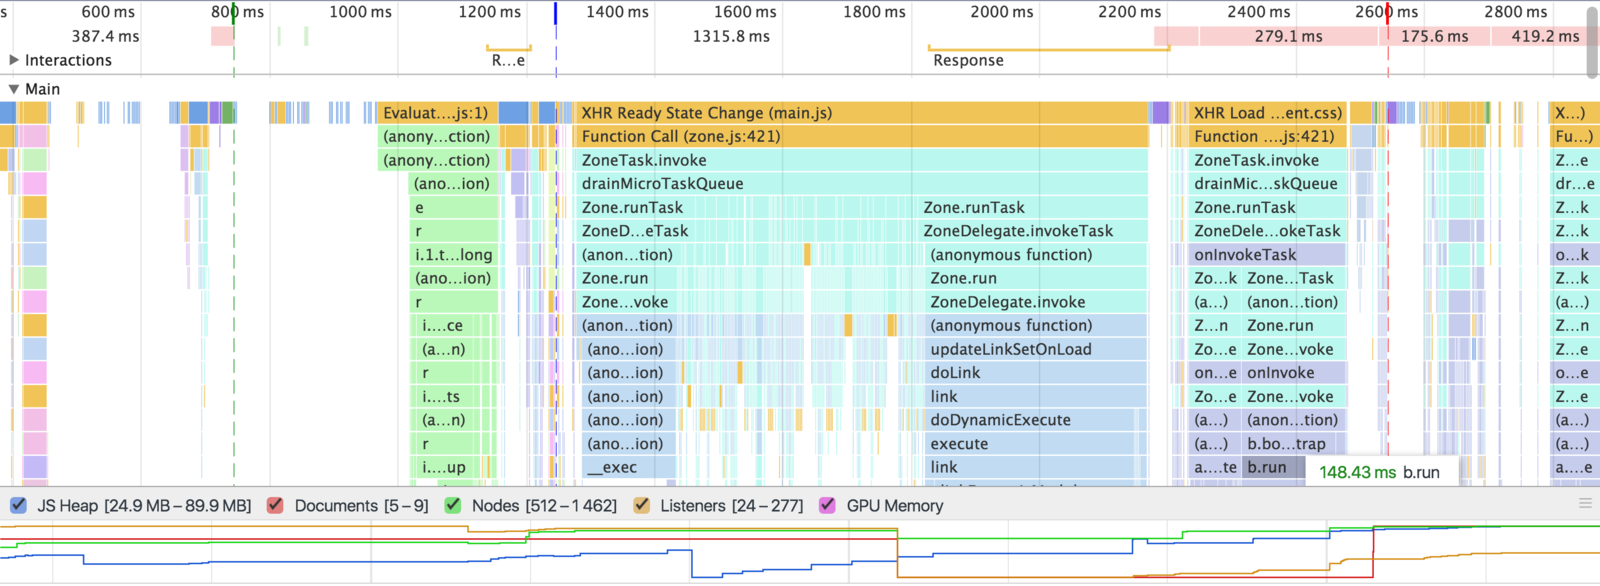
Flame chart shows every JavaScript function call.
Works best with development scripts.
- Green line represents time to first paint
- Blue line represents the DOMContentLoaded event
- Red line represents the load event.
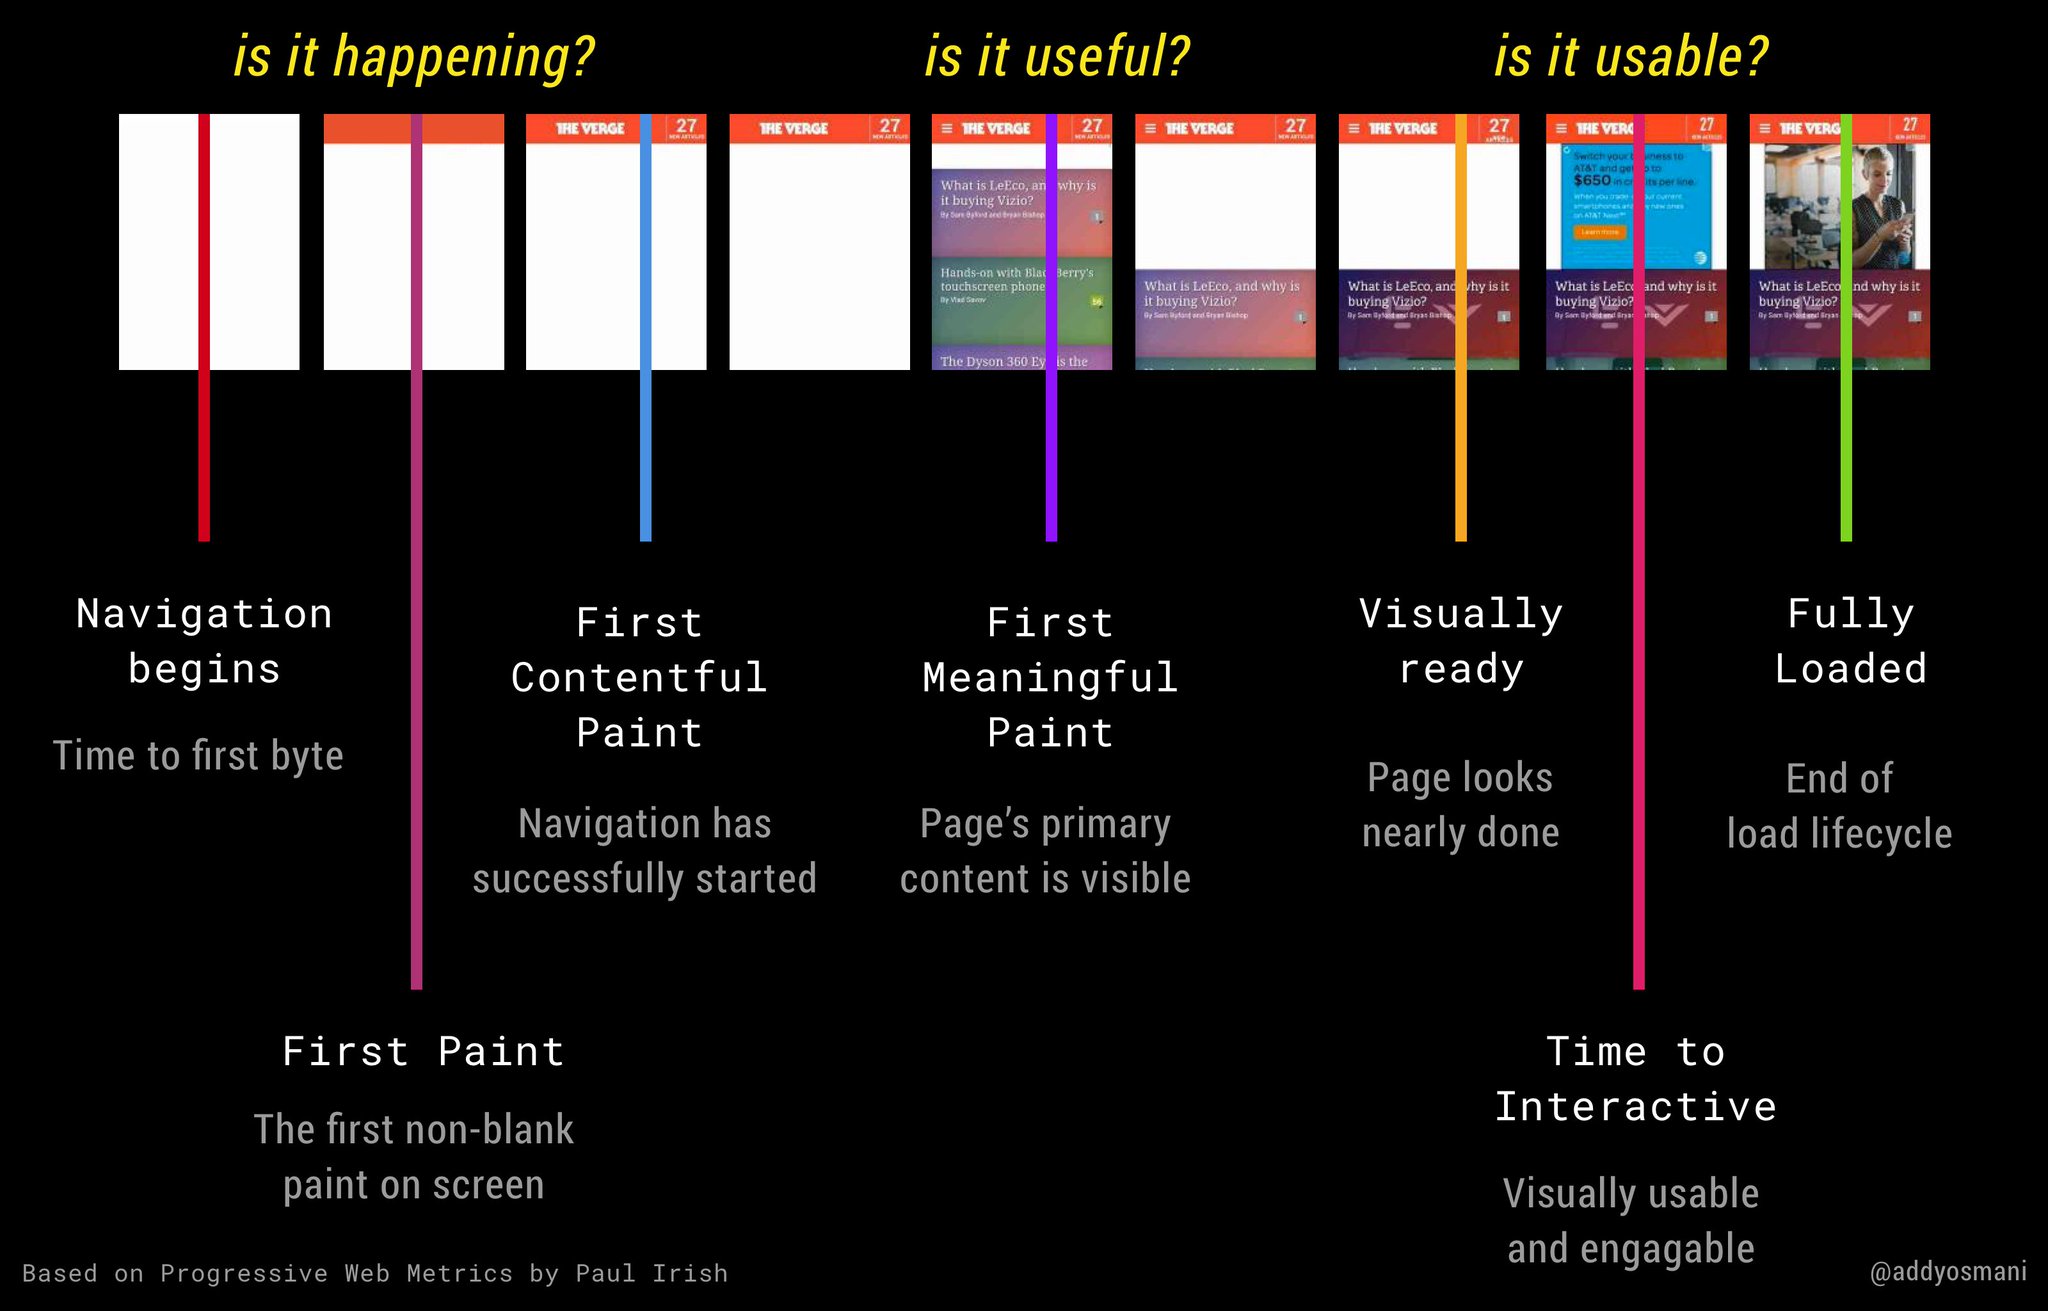
Key moments in page load
Time to first paint
"Is it happening?"
Time to first meaningful paint
"Is it useful?"

Time to first
meaningful interaction
"Is it usable?"

https://twitter.com/addyosmani/status/760490332983177216
RAIL
Performance model

TL;DR
- Focus on the user; the end goal is to ultimately make users happy
- Respond to users immediately; acknowledge user input in under 100ms
- Render each frame in under 16ms and aim for consistency; users notice 'jank'
- Maximize main thread idle time
- Keep users engaged; deliver interactive content in under 1000ms
Awesome tool that you already have access to*
Features
-
Page Load time
- Entire page load cycle
- Timing AJAX calls
-
Time spent
- in the front end (browser)
- in the back end (network and web app)
- Geographic origin
- Browser type and version
- Operating system
- SPA route changes
- Logs JavaScript errors
Documentation/Help
-
Confluence: newrelic/
-
Slack: #new-relic
Asking the right questions
- How can the page make users happy?
- Can interaction responses be improved?
- Is there any unintended disconnect?
- How to keep users engaged while waiting?
- What is "meaningful" in context of your app?
- What is "usable" in context? "Fully usable"?
How can you best quantify these answers?
Tips & Resources
- Global FED Team Performance standards
- RAIL Performance Model
- Chrome developers' "Totally Tooling Tips" video series
- Profiling with V8 (Chrome)
- Write efficient CSS
- Fake it 'til you make it CSS
- webpagetest.org
- nodejs.org/en/docs/guides/simple-profiling/
- Run Node.js apps inside Chrome DevTools github.com/Jam3/devtool
- Owning Your Performance: RAIL 🔥
Profiling your web app
By Carlos Filoteo