
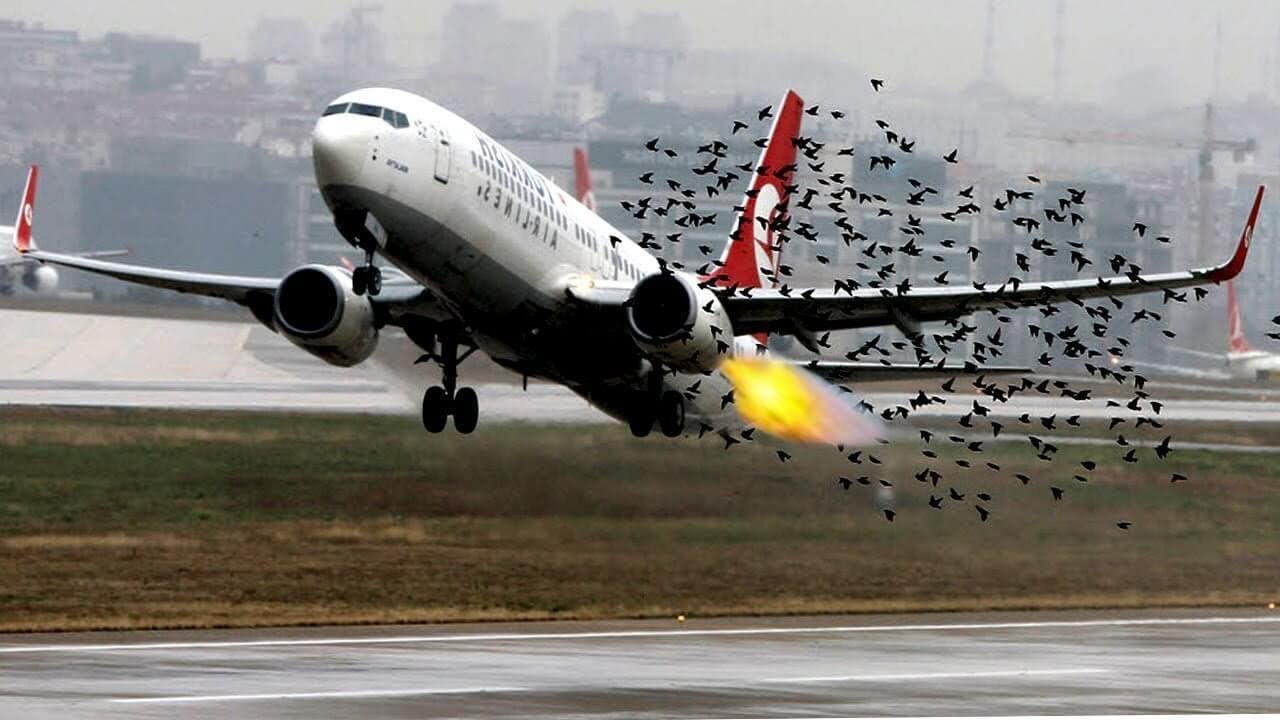
Bird Strike Visualizations
About Me
Chris Novitsky BS & MS in Geophsyics

Currently
Software Engineer,
Boulder Imaging Inc
(Aerial Detection System to
Save endangered birds at
wind farms)
Previously
Software Developer
Biotech Startup,
Zepto Life Technology
Medical Diagnostics with nanoparticles
Summary:
- Quick Overview of Dash
- Bird Strike Example
git clone https://github.com/chrisgnovi/BoulderPython-Talk-12-10-19.git
Plotly Shout-Out
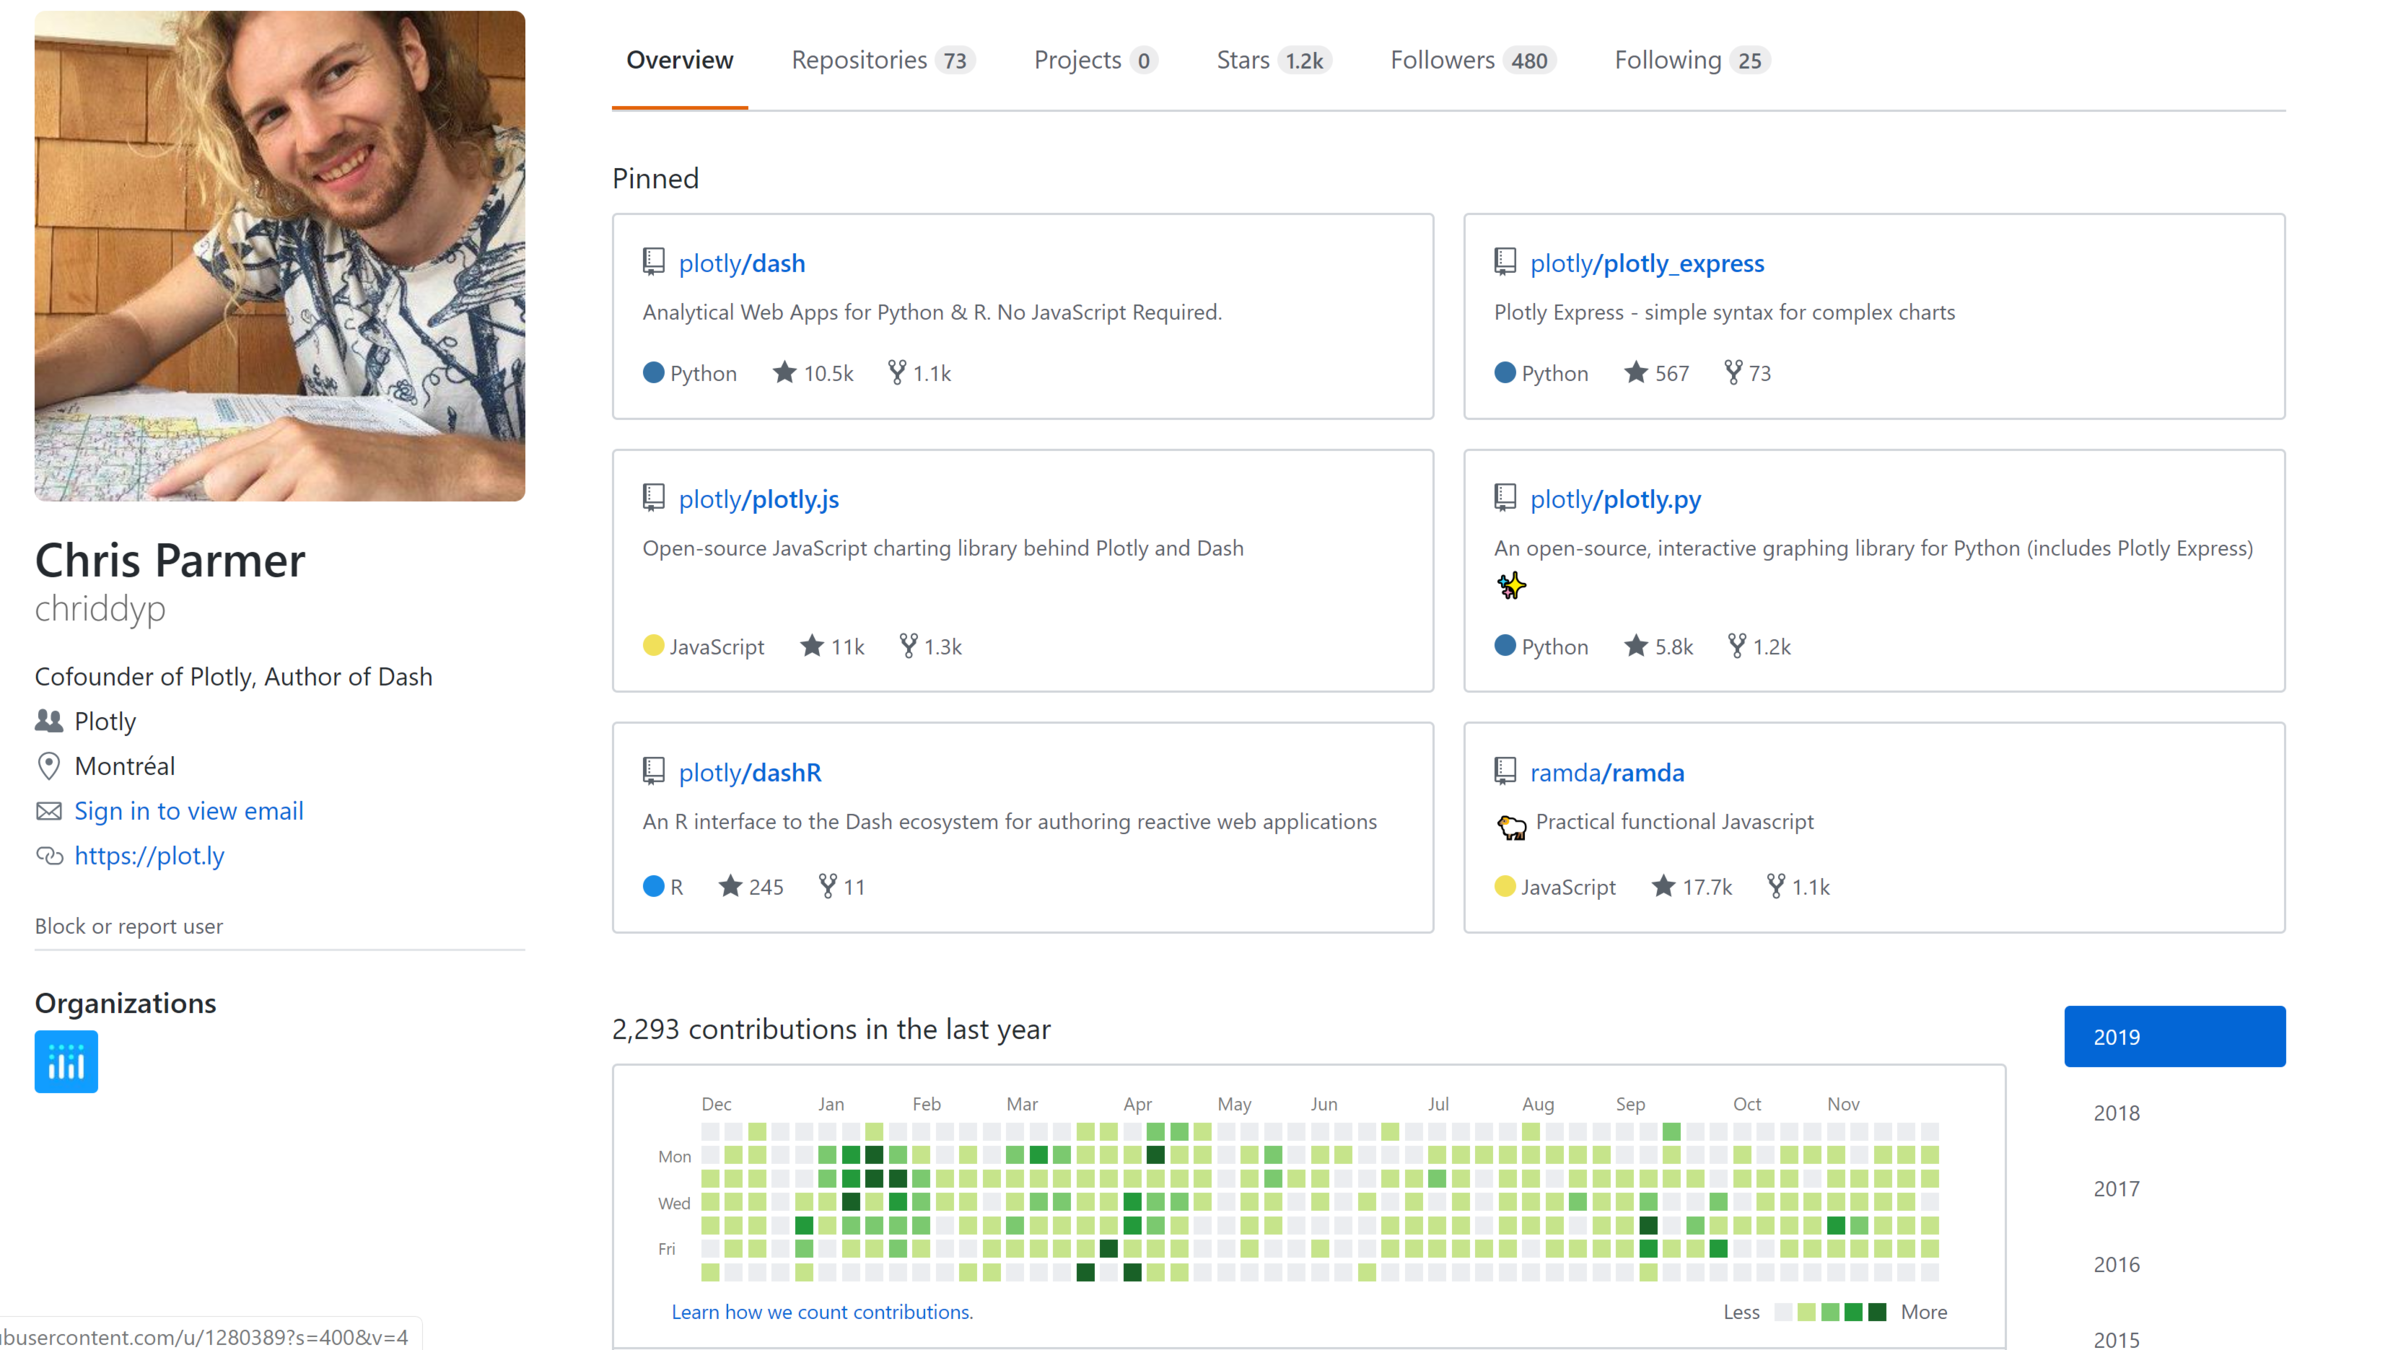
Plotly raised $5.5 million during its Series A funding.
Used by Google, NASA, Boston Globe, Washington Post.
Used open-source software: React JS, Flask
Dash Basics
# Import Dash and both of its component libraries
import dash
import dash_core_components as dcc
import dash_html_components as html
# Create App
app = dash.Dash()
# Define the application layout
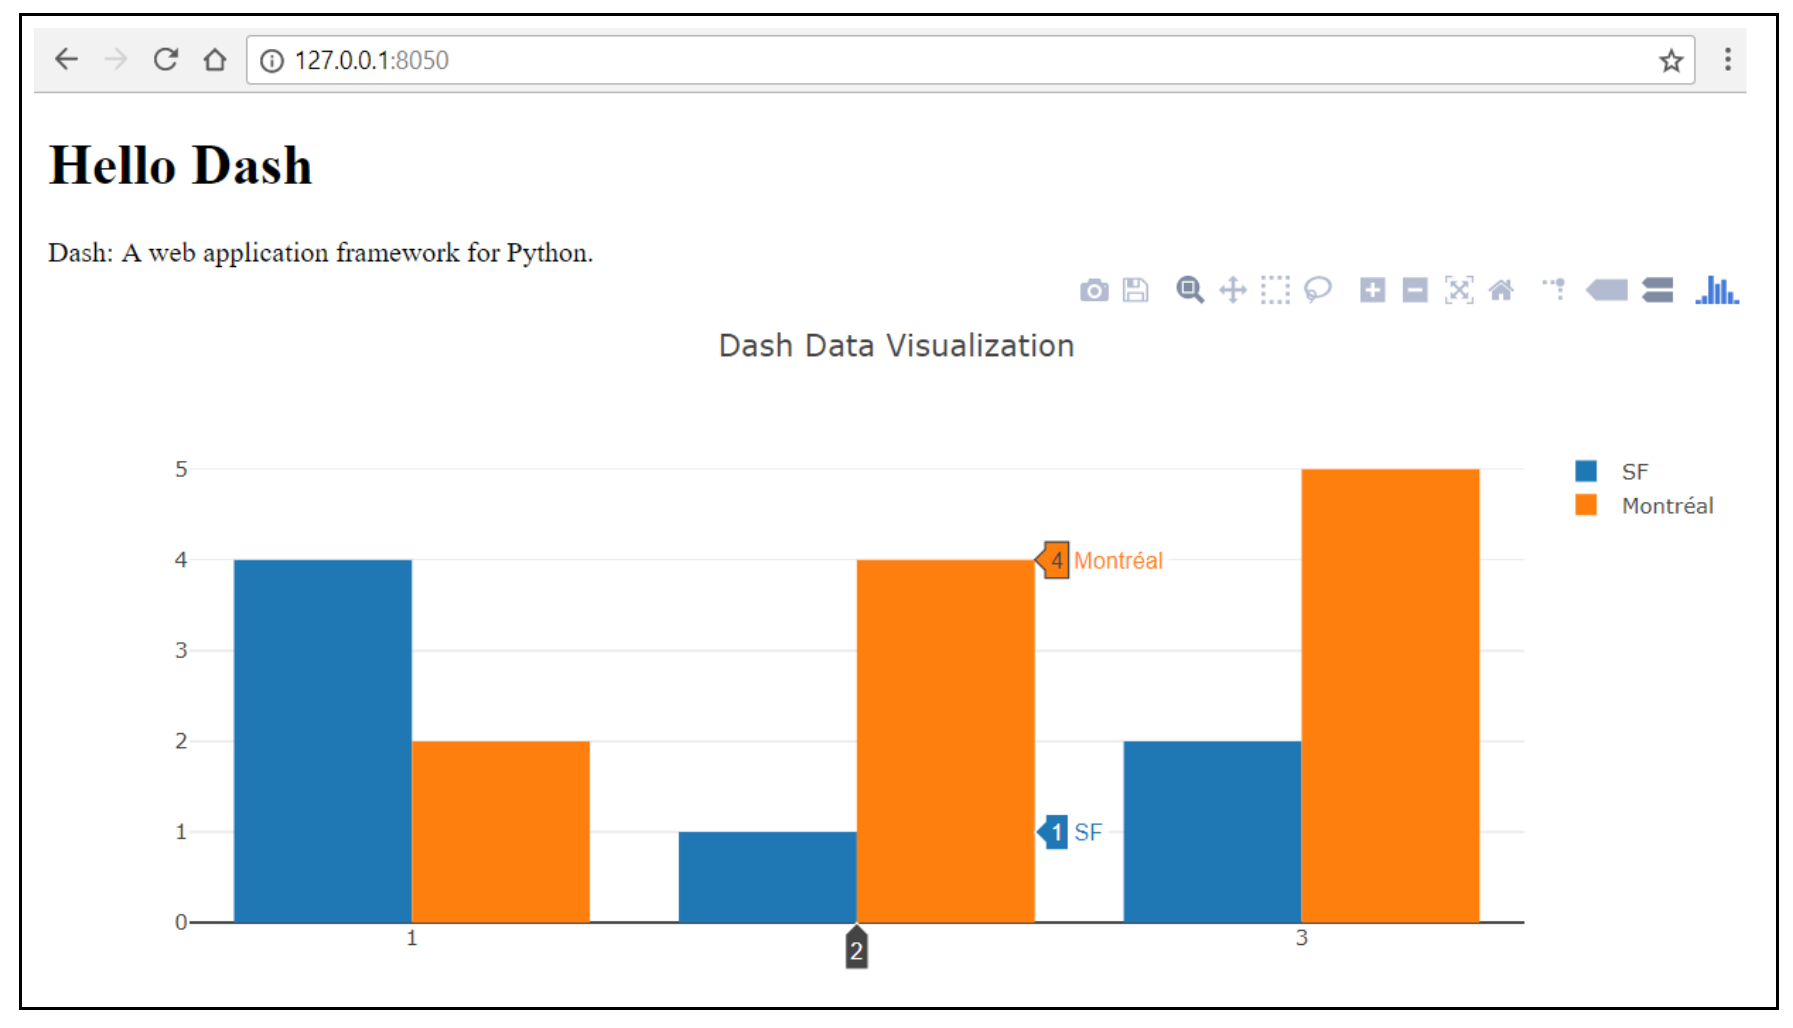
app.layout = html.Div(children=[
html.H1(children='Hello Dash'),
html.Div(children='Dash: A web application framework for Python.'),
dcc.Graph(
id='example-graph',
figure={
'data': [
{'x': [1, 2, 3], 'y': [4, 1, 2], 'type': 'bar', 'name': 'SF'},
{'x': [1, 2, 3], 'y': [2, 4, 5], 'type': 'bar', 'name': u'Montréal'},
],
'layout': {
'title': 'Dash Data Visualization'
}
}
)
])
# Launches a local server
if __name__ == '__main__':
app.run_server(debug=True)
Dash Basics
DashBoard Components
Are provided by the main libaries:
- dash_html_components
- dash_core_components
Html components describe the layout of the page
Core Components for interactive user interfaces. (React component suite)
Third Party libaries:
- dash_bootstrap_components
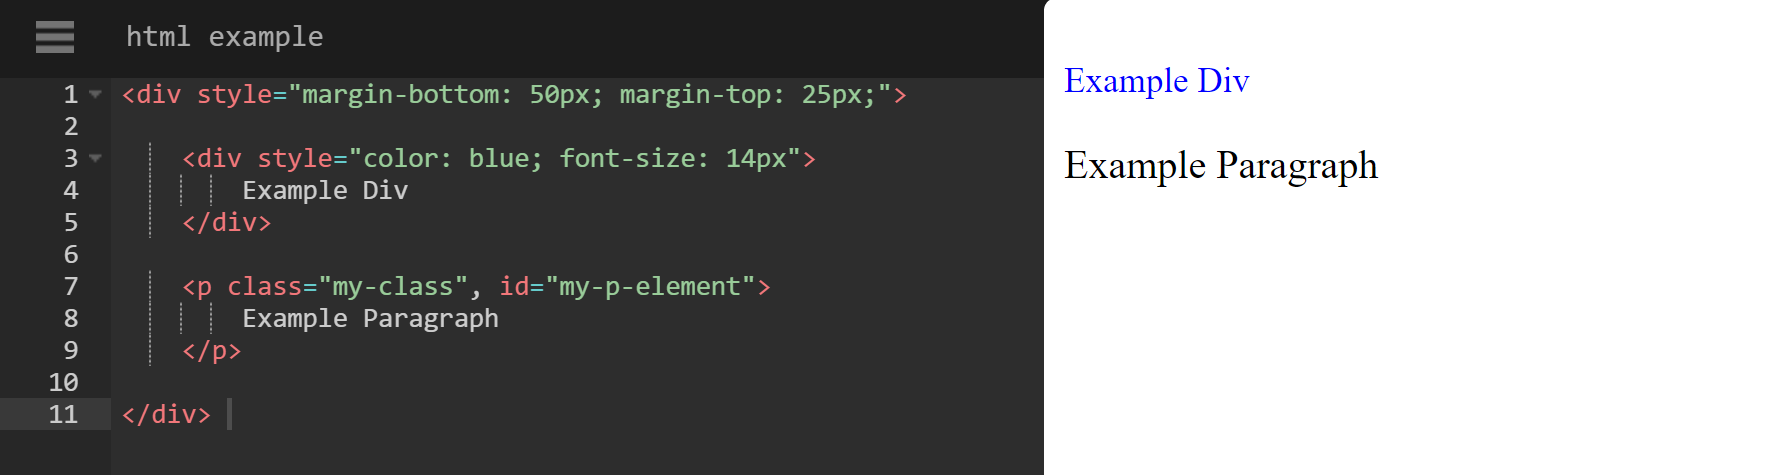
1. Html Components
import dash_html_components as html

html.Div([
    html.Div('Example Div', style={'color': 'blue', 'fontSize': 14}),
    html.P('Example P', className='my-class', id='my-p-element')
], style={'marginBottom': 50, 'marginTop': 25})
2. Core Components
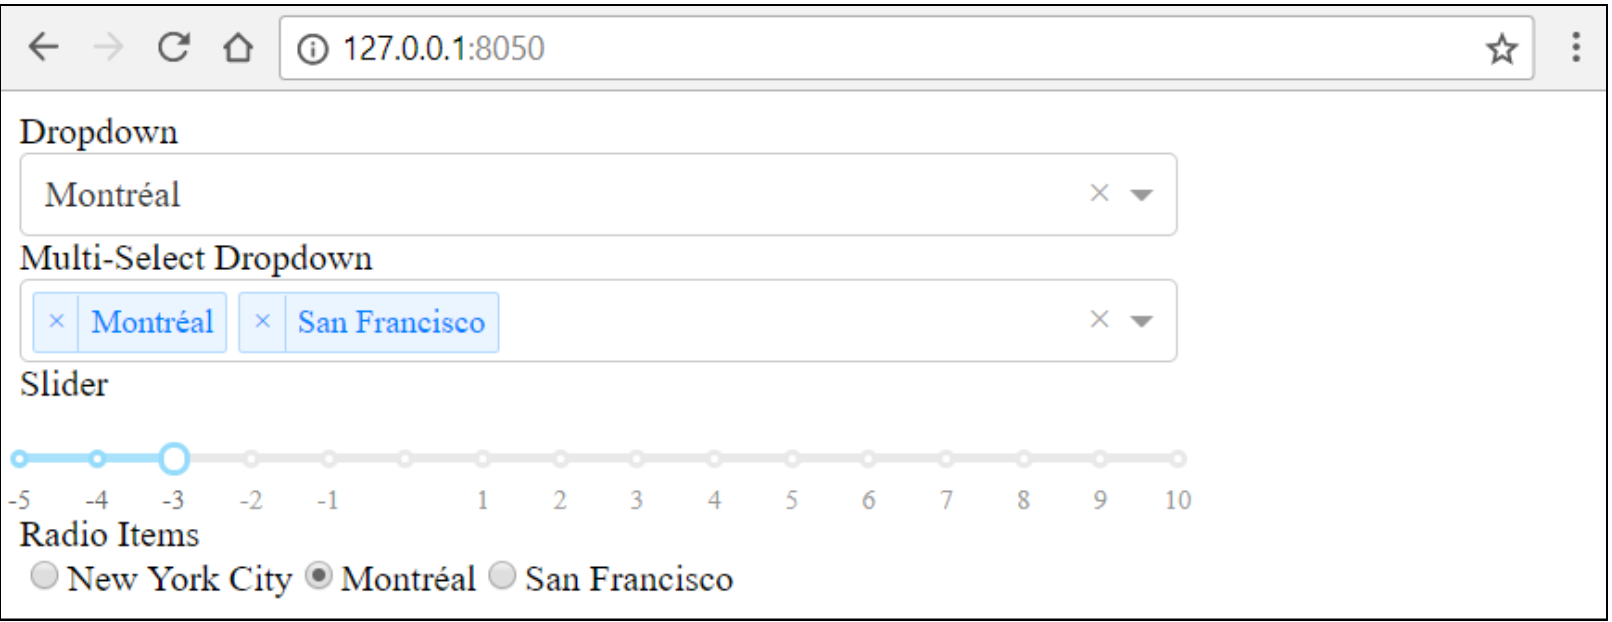
 dcc.Dropdown(
        options=[
            {'label': 'New York City', 'value': 'NYC'},
            {'label': u'Montréal', 'value': 'MTL'},
            {'label': 'San Francisco', 'value': 'SF'}
        ],
        value=['MTL', 'SF'],
        multi=True
    ),
Bootstrap Components
app = dash.Dash(__name__, external_stylesheets=[dbc.themes.BOOTSTRAP])Interactive Comp. Callbacks
import dash
import dash_core_components as dcc
import dash_html_components as html
from dash.dependencies import Input, Output

app = dash.Dash()

app.layout = html.Div([
    dcc.Input(id='my-id', value='initial value', type='text'),
    html.Div(id='my-div')
])

@app.callback(
    Output(component_id='my-div', component_property='children'),
    [Input(component_id='my-id', component_property='value')]
)
def update_output_div(input_value):
    return 'You\'ve entered "{}"'.format(input_value)

if __name__ == '__main__':
    app.run_server()
Callback Basics: Multiple Inputs
@app.callback(
    Output('indicator-graphic', 'figure'),
    [Input('xaxis-column', 'value'),
     Input('yaxis-column', 'value'),
     Input('xaxis-type', 'value'),
     Input('yaxis-type', 'value'),
     Input('year-slider', 'value')])
def update_graph(xaxis_column_name, yaxis_column_name,
                 xaxis_type, yaxis_type,
                 year_value):

                 data, layout = plot()

                 return {'data' : data, 'layout' : layout}
Callback Basics: Multiple Ouputs
@app.callback(
    [Output('square', 'children'),
     Output('cube', 'children'),
     Output('twos', 'children'),
     Output('threes', 'children'),
     Output('x^x', 'children')],
    [Input('num-multi', 'value')])
def callback_a(x):
    return x**2, x**3, 2**x, 3**x, x**x
Callback Basics: Chained
@app.callback(
    Output('cities-radio', 'options'),
    [Input('countries-radio', 'value')])
def set_cities_options(selected_country):
    return [{'label': i, 'value': i} for i in all_options[selected_country]]

@app.callback(
    Output('cities-radio', 'value'),
    [Input('cities-radio', 'options')])
def set_cities_value(available_options):
    return available_options[0]['value']

@app.callback(
    Output('display-selected-values', 'children'),
    [Input('countries-radio', 'value'),
     Input('cities-radio', 'value')])
def set_display_children(selected_country, selected_city):
    return u'{} is a city in {}'.format(
        selected_city, selected_country)
A component/property pair can only be the Output of one callback
Live Updating Components
import dash
import dash_core_components as dcc
import dash_html_components as html
import plotly
from dash.dependencies import Input, Output
import datetime
from pyorbital.orbital import Orbital

satellite = Orbital('TERRA')
app = dash.Dash(__name__)
app.layout = html.Div(
    html.Div([
        html.H4('TERRA Satellite Live Feed'),
        html.Div(id='live-update-text'),
        dcc.Interval(
            id='interval-component',
            interval=1*1000, # in milliseconds
            n_intervals=0
        )]))

@app.callback(Output('live-update-text', 'children'),
              [Input('interval-component', 'n_intervals')])
def update_metrics(n):
    lon, lat, alt = satellite.get_lonlatalt(datetime.datetime.now())
    style = {'padding': '5px', 'fontSize': '16px'}
    return [
        html.Span('Longitude: {0:.2f}'.format(lon), style=style),
        html.Span('Latitude: {0:.2f}'.format(lat), style=style),
        html.Span('Altitude: {0:0.2f}'.format(alt), style=style)]

if __name__ == '__main__':
    app.server.run(debug=True, threaded=True)
Sharing State Between Callbacks
Global variables will break your app!
Dash is designed to work in multi-user environments where multiple people may view the application at the same time and will have independent sessions.
Solutions:
-
In the user's browser session (Hidden Div)
-
User-Based Session Data on the Server (flask_caching or Redis shared memory space)
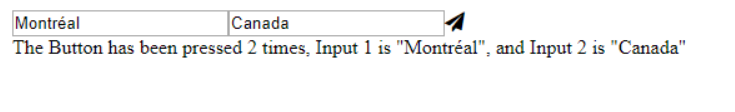
Adding Your Own CSS
app.css.append_css({'external_url': 'https://cdnjs.cloudflare.com/ajax/libs/font-awesome/4.7.0/css/font-awesome.min.css'})

app.layout = html.Div([
    dcc.Input(id='input-1-state', type='text', value='Montréal'),
    dcc.Input(id='input-2-state', type='text', value='Canada'),
    html.I(id='submit-button', n_clicks=0, className='fa fa-send'),
    html.Div(id='output-state')
])
Excellent Documentation
- Adding your own JavaScript
- URL Routing
- Building your own React.js components
- Authentication
- Dash Testing
- Deployment
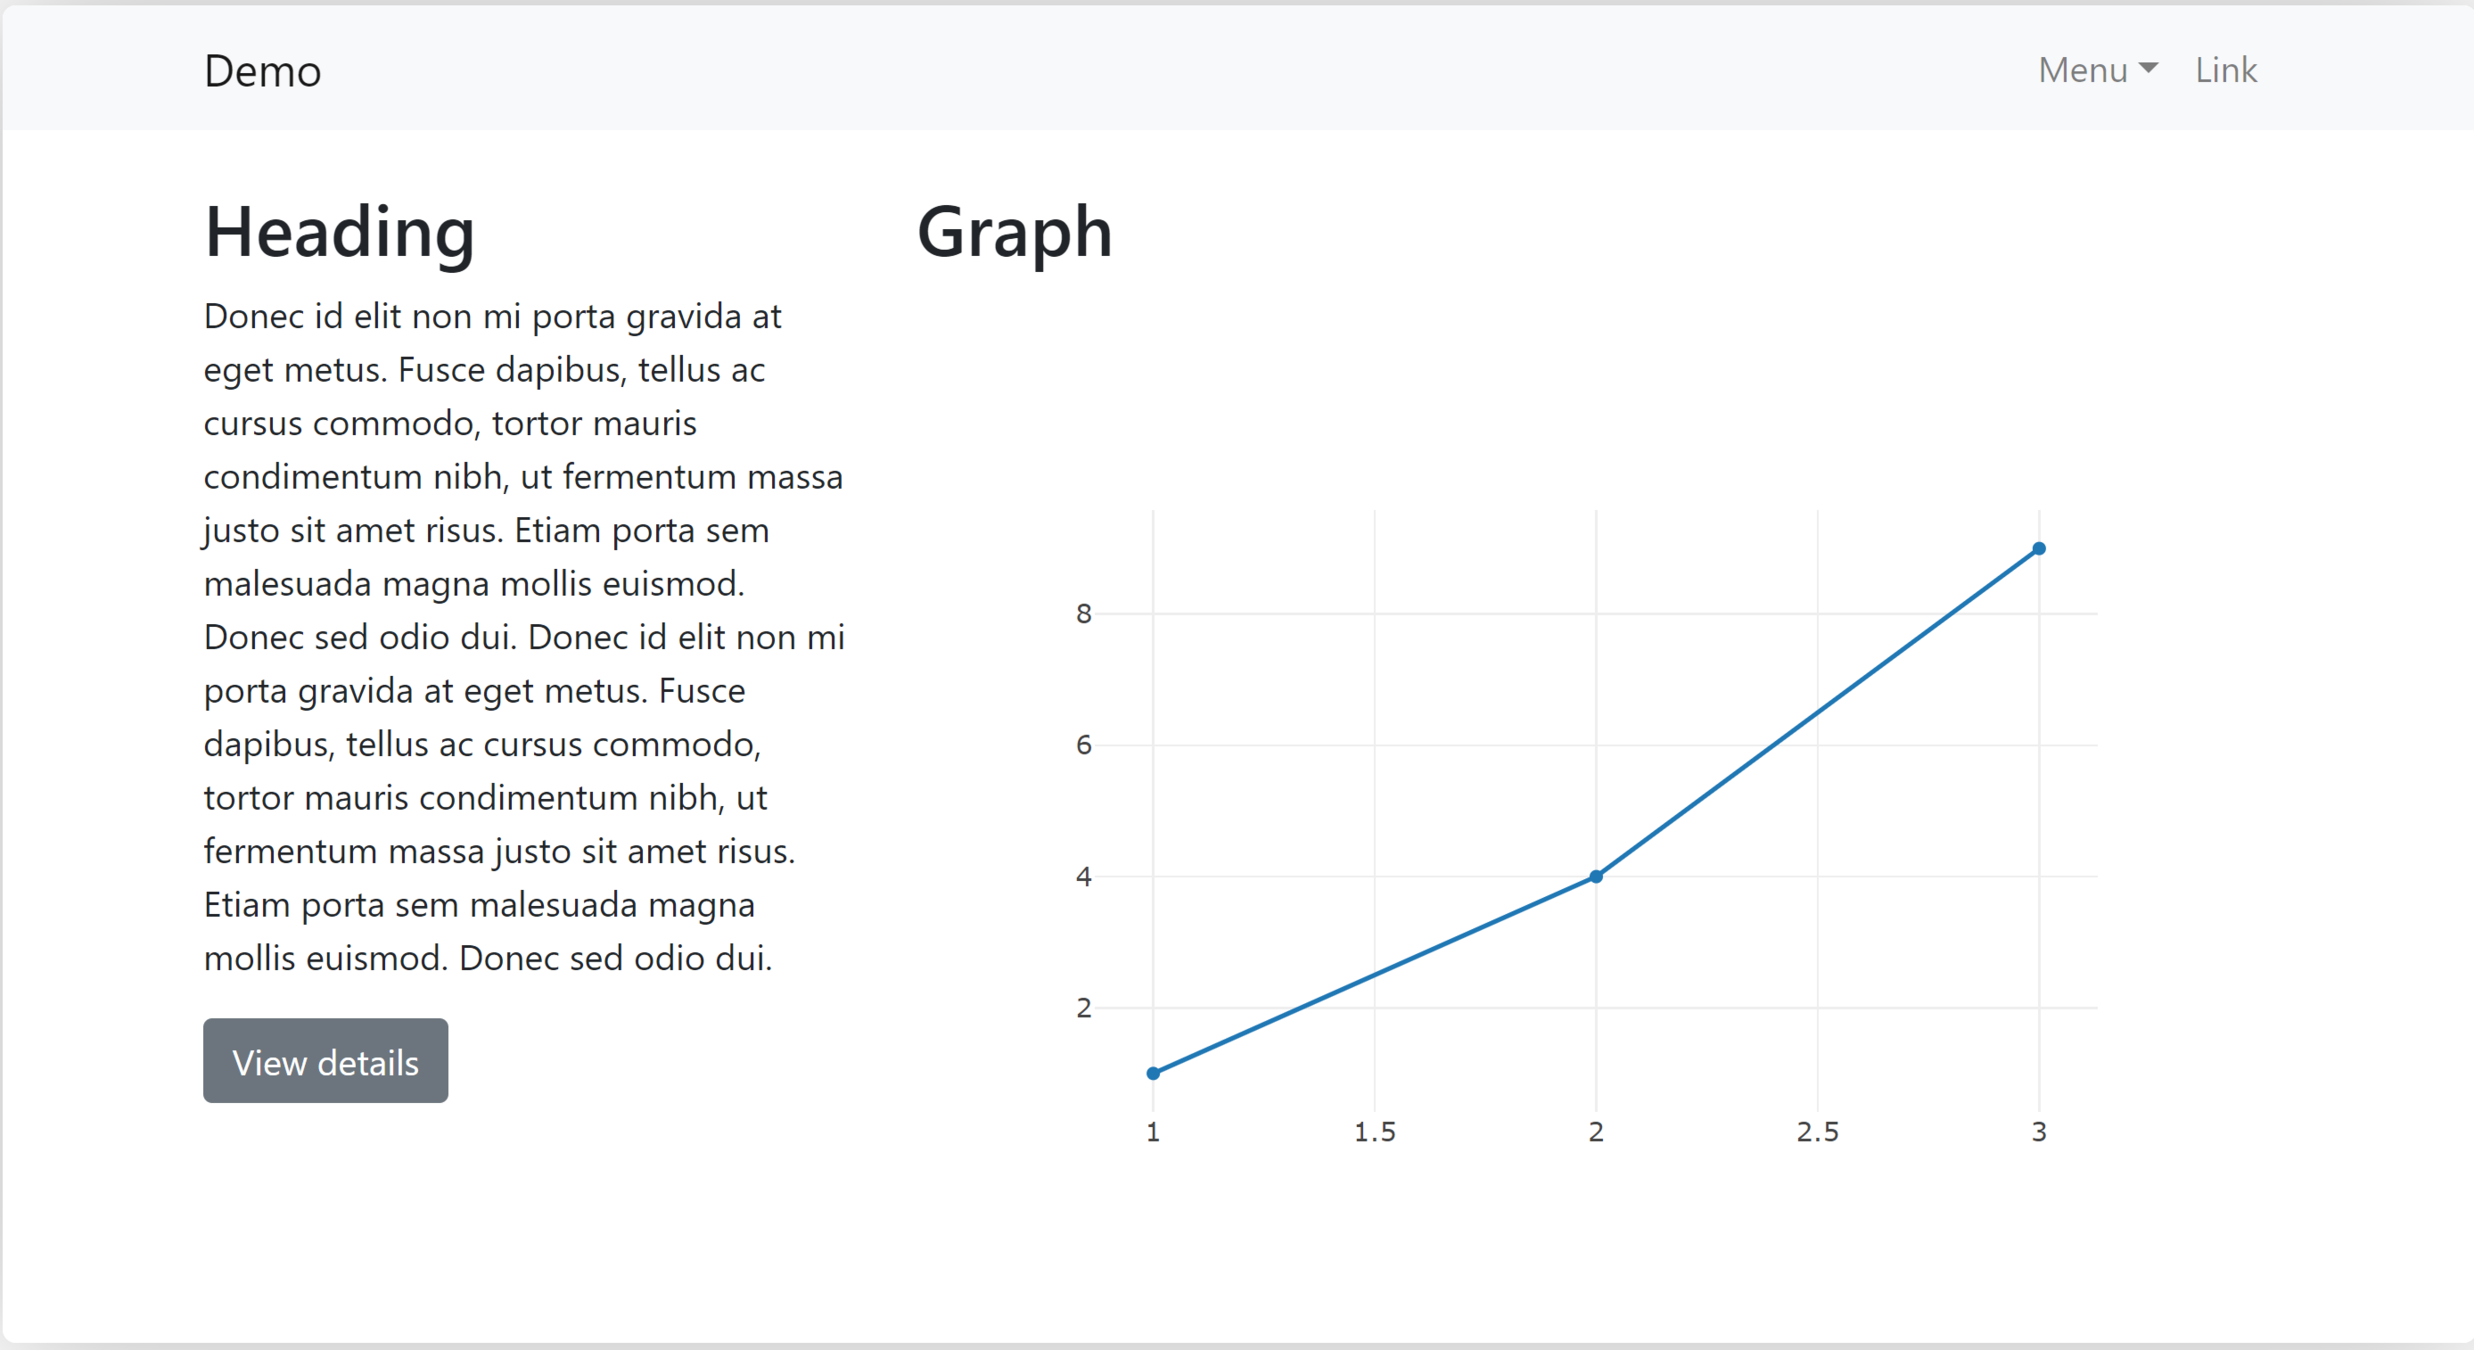
Demo
Conclusion
- Dash is super quick and easy to use
- Great at making a single page dashboard
- However, It can be constraining to use. I highly recommend nesting your Dash app inside a Flask webpage (Jinja) for larger applications
- React.JS core components are why I would use it over a plan Flask webpage (publish & subscribe events)
deck
By chris novi