Developing R Statistical Software Using IQSS Best Practices
Christopher Gandrud
Pre-requisits
- Basic understanding of Git/GitHub
- Basic understanding of R and writing R functions
Motivation/ Objectives
Goals
- robust
- user-friendly
- persistent
- attributable
- enables reproducible research
Build statistical software that is:
Learning Objectives
- Working with RStudio projects
- Writing dynamic and informative documentation
- Software testing
- Continuous integration
- Documenting use of the IQSS Best Practices with an IQSS Report Card
IQSS Best Practices for Statistical Software Development
Caveat (1)
The IQSS Best Practices are based on established work in computer science and hard earned experience,
but they (especially IQSSdevtools) are a work in progress.
Suggestions for improvement are highly encouraged!
Caveat (2)
Don't expect all software projects to necessarily follow the Best Practices.
Instead, think about them as questions you should consider and have good answers to.
1.) is Informatively documented
Best Practice Software:
2.) has an open source license
Best Practice Software:
3.) is comprehensively & automatically tested
Best Practice Software:
4.) is Developed using version control
Best Practice Software:
5.) Developed in the open
Best Practice Software:
6.) Clearly Citable
Best Practice Software:
7.) Uses an IQSS Report Card
Best Practice Software:
Implementation in R
Key resources
(reading)
- IQSS Best Practices (work in progress) https://iqss.gitbooks.io/statistical-software-development-best-practices/content/r_quickstart_guide.html
- Hadley Wickham's R Package development book: http://r-pkgs.had.co.nz/
Key Resources (software)
- XCode (or just Command Line Tools)
- Windows: Rtools http://cran.r-project.org/bin/windows/Rtools/
- devtools R package
- roxygen2
- testthat R package
- RMarkdown
- IQSSdevtools R package (work in progress)
- RStudio
devtools
Contains helper functions for automating many R package creation steps
roxygen2
Makes documenting packages easier
testthat
functions for creating package testing suite
IQSSdevtools
Opinionated wrapping of devtools and testthat to follow IQSS best practics
RStudio Contains a full developer environment to easily access devtools etc.
NOTE: RStudio is not necessary. You can do all of this in the R Console
Key Resources
(Version Control & open develoment)
- Git (version control system)
- GitHub (hosts Git repositories, platform for develoment, e.g. collaboration and bug reporting)
Key Resources (continuous Integration)
- Travis CI (Linux/macOS)
- AppVeyor (Windows)
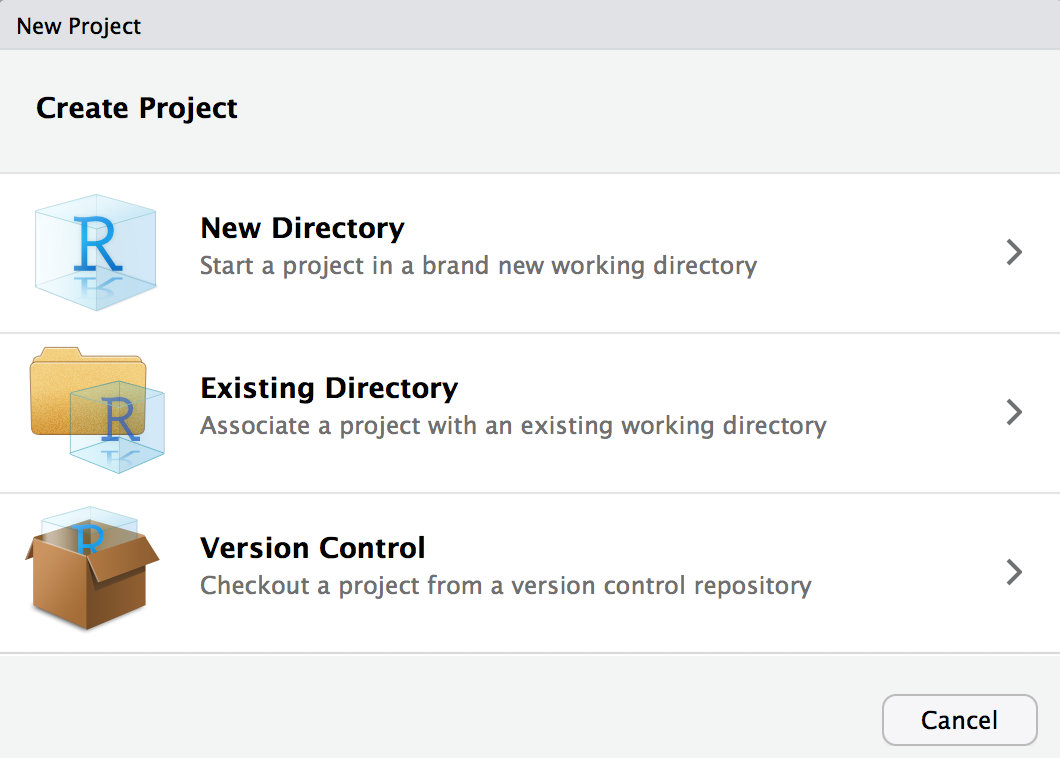
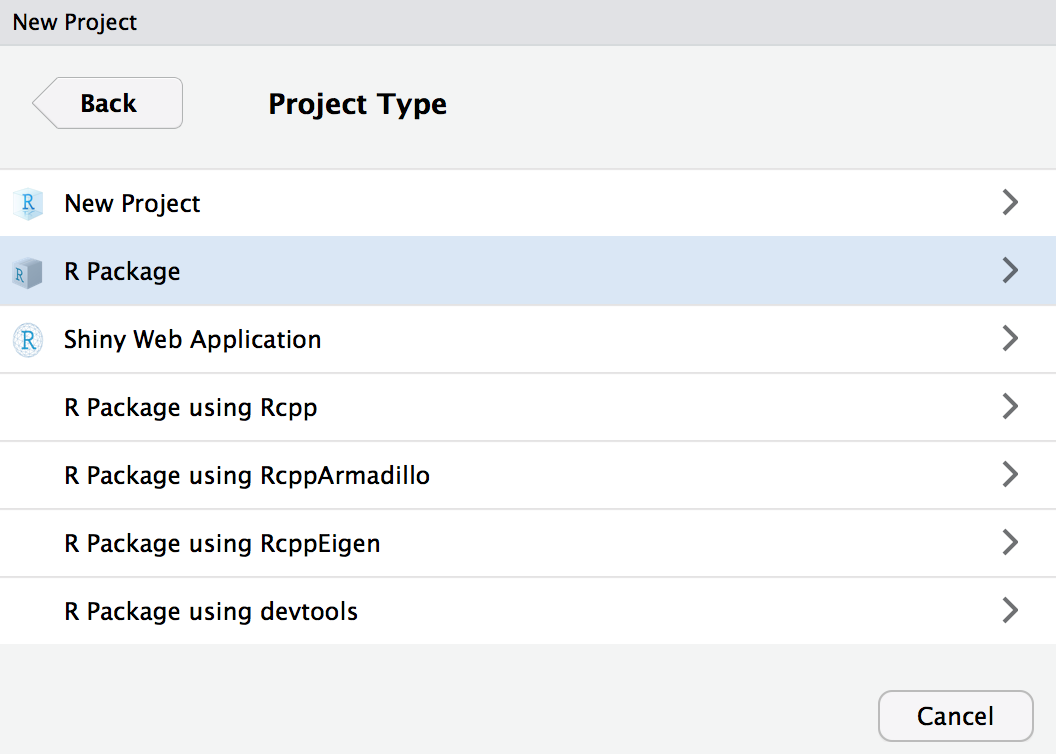
INITIALISING a new package
Initialize in RStudio
File > New Project...
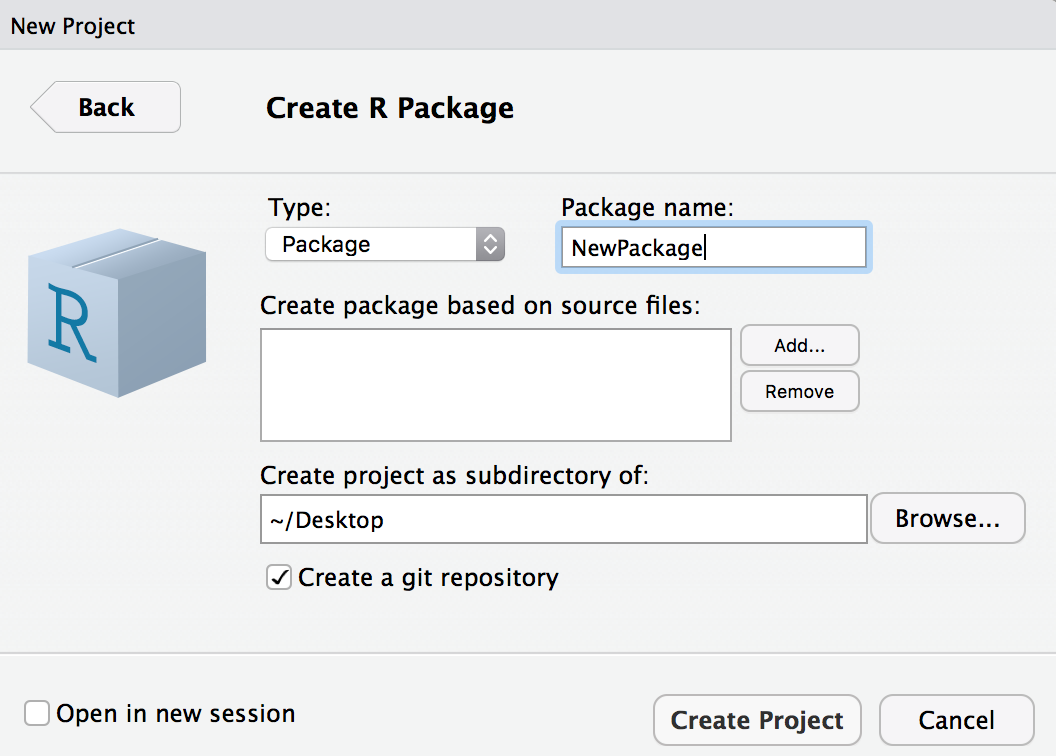
Warning: this is a terrible name for a package
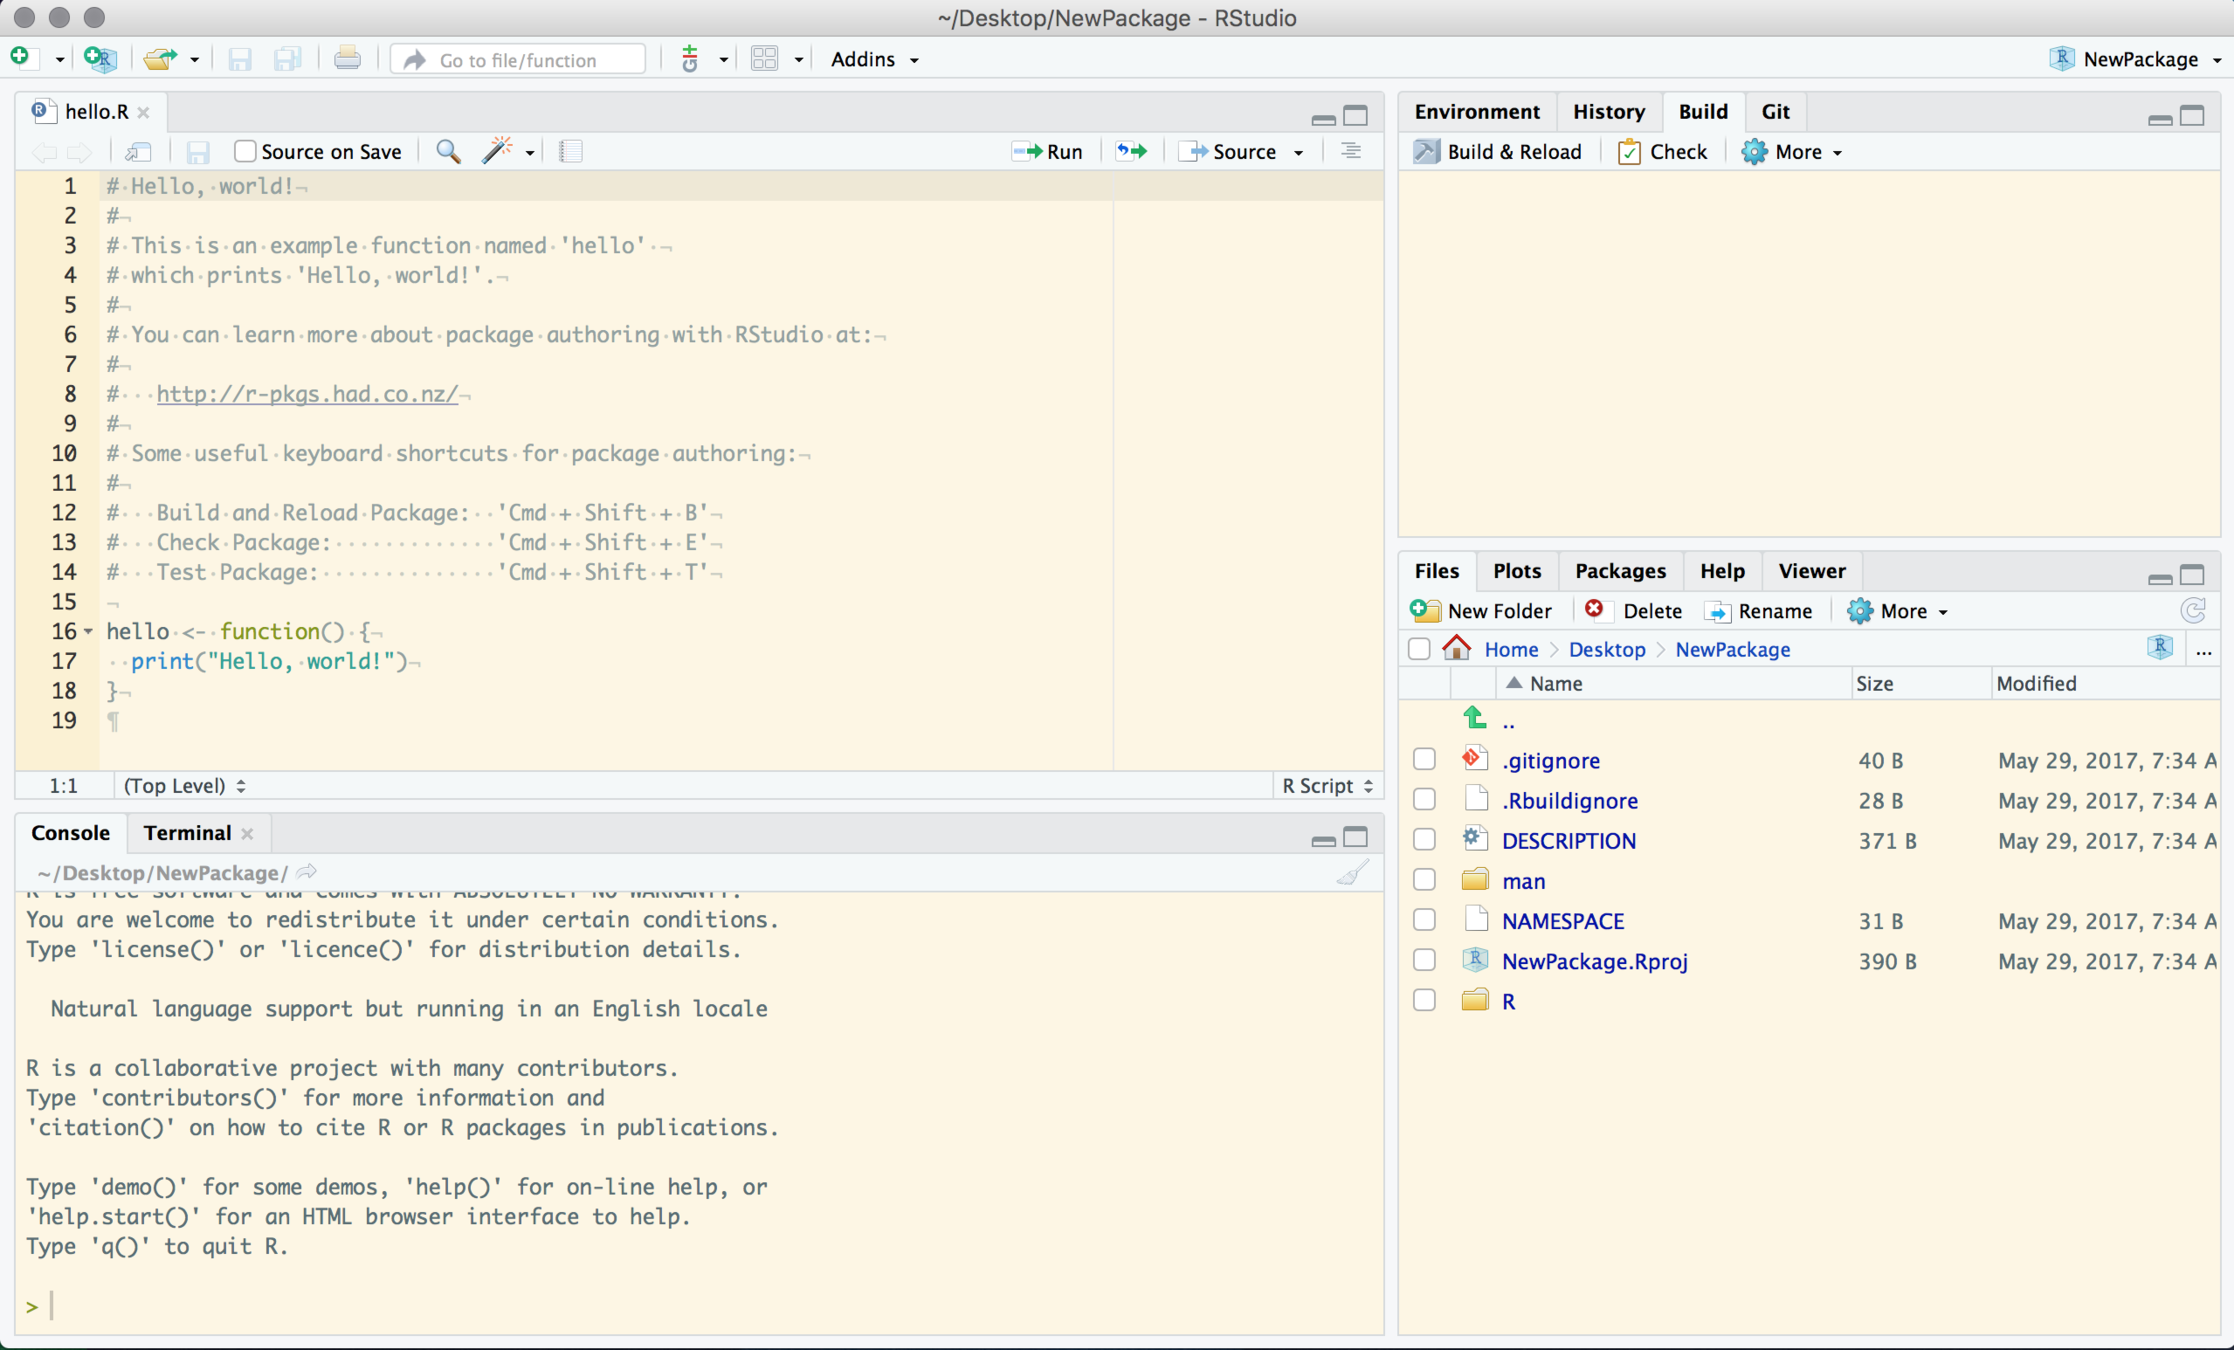
Look around
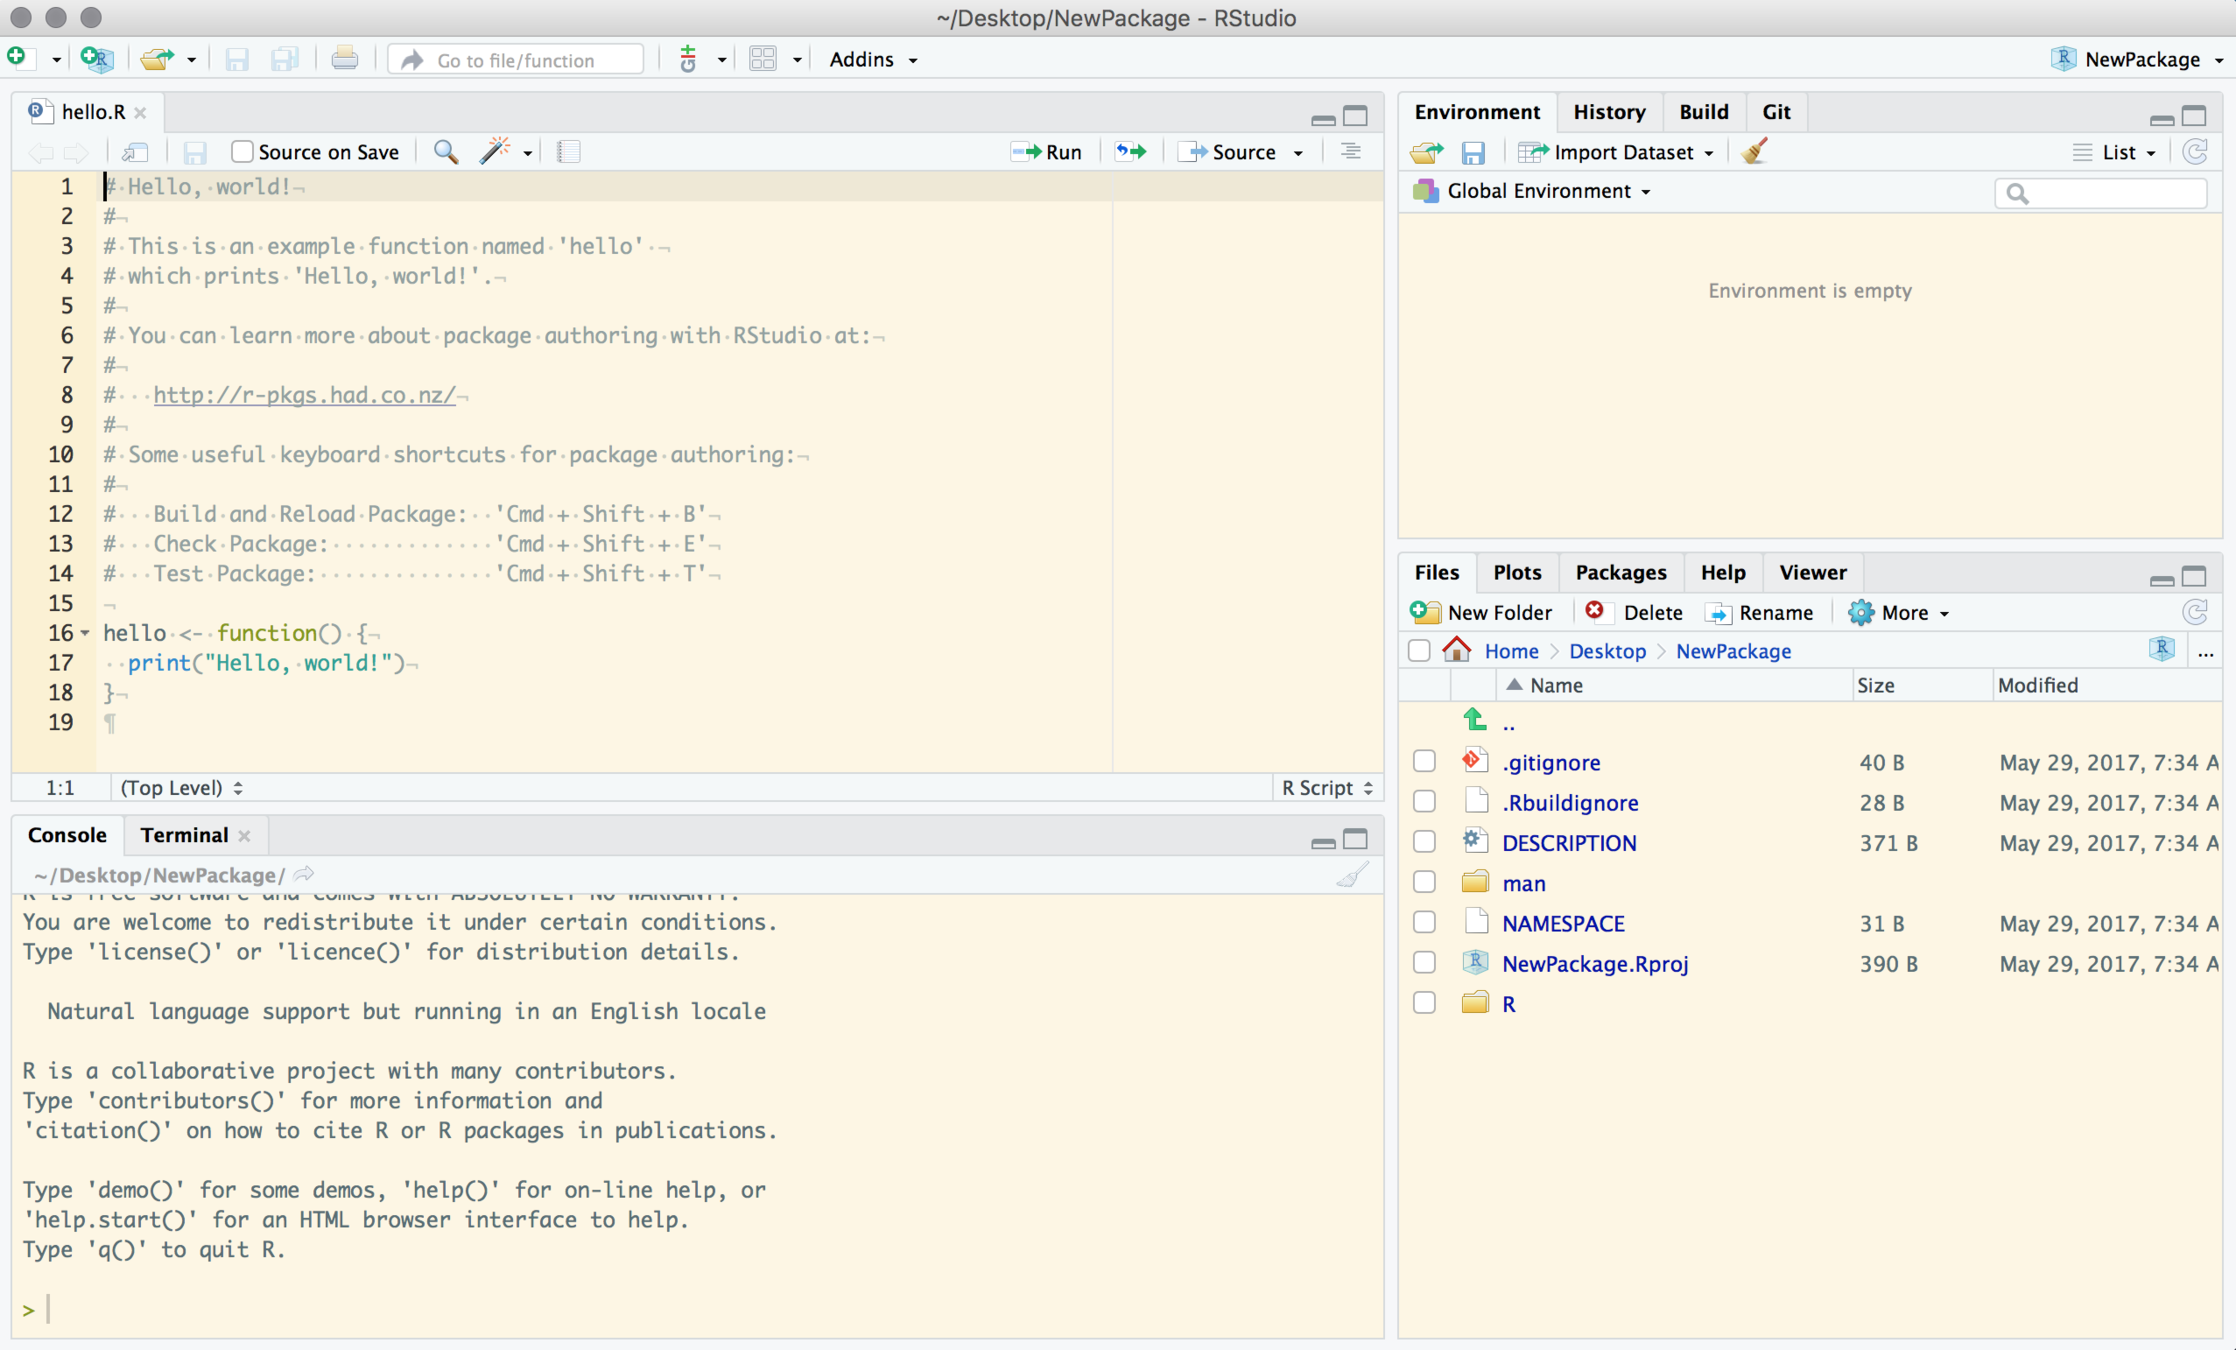
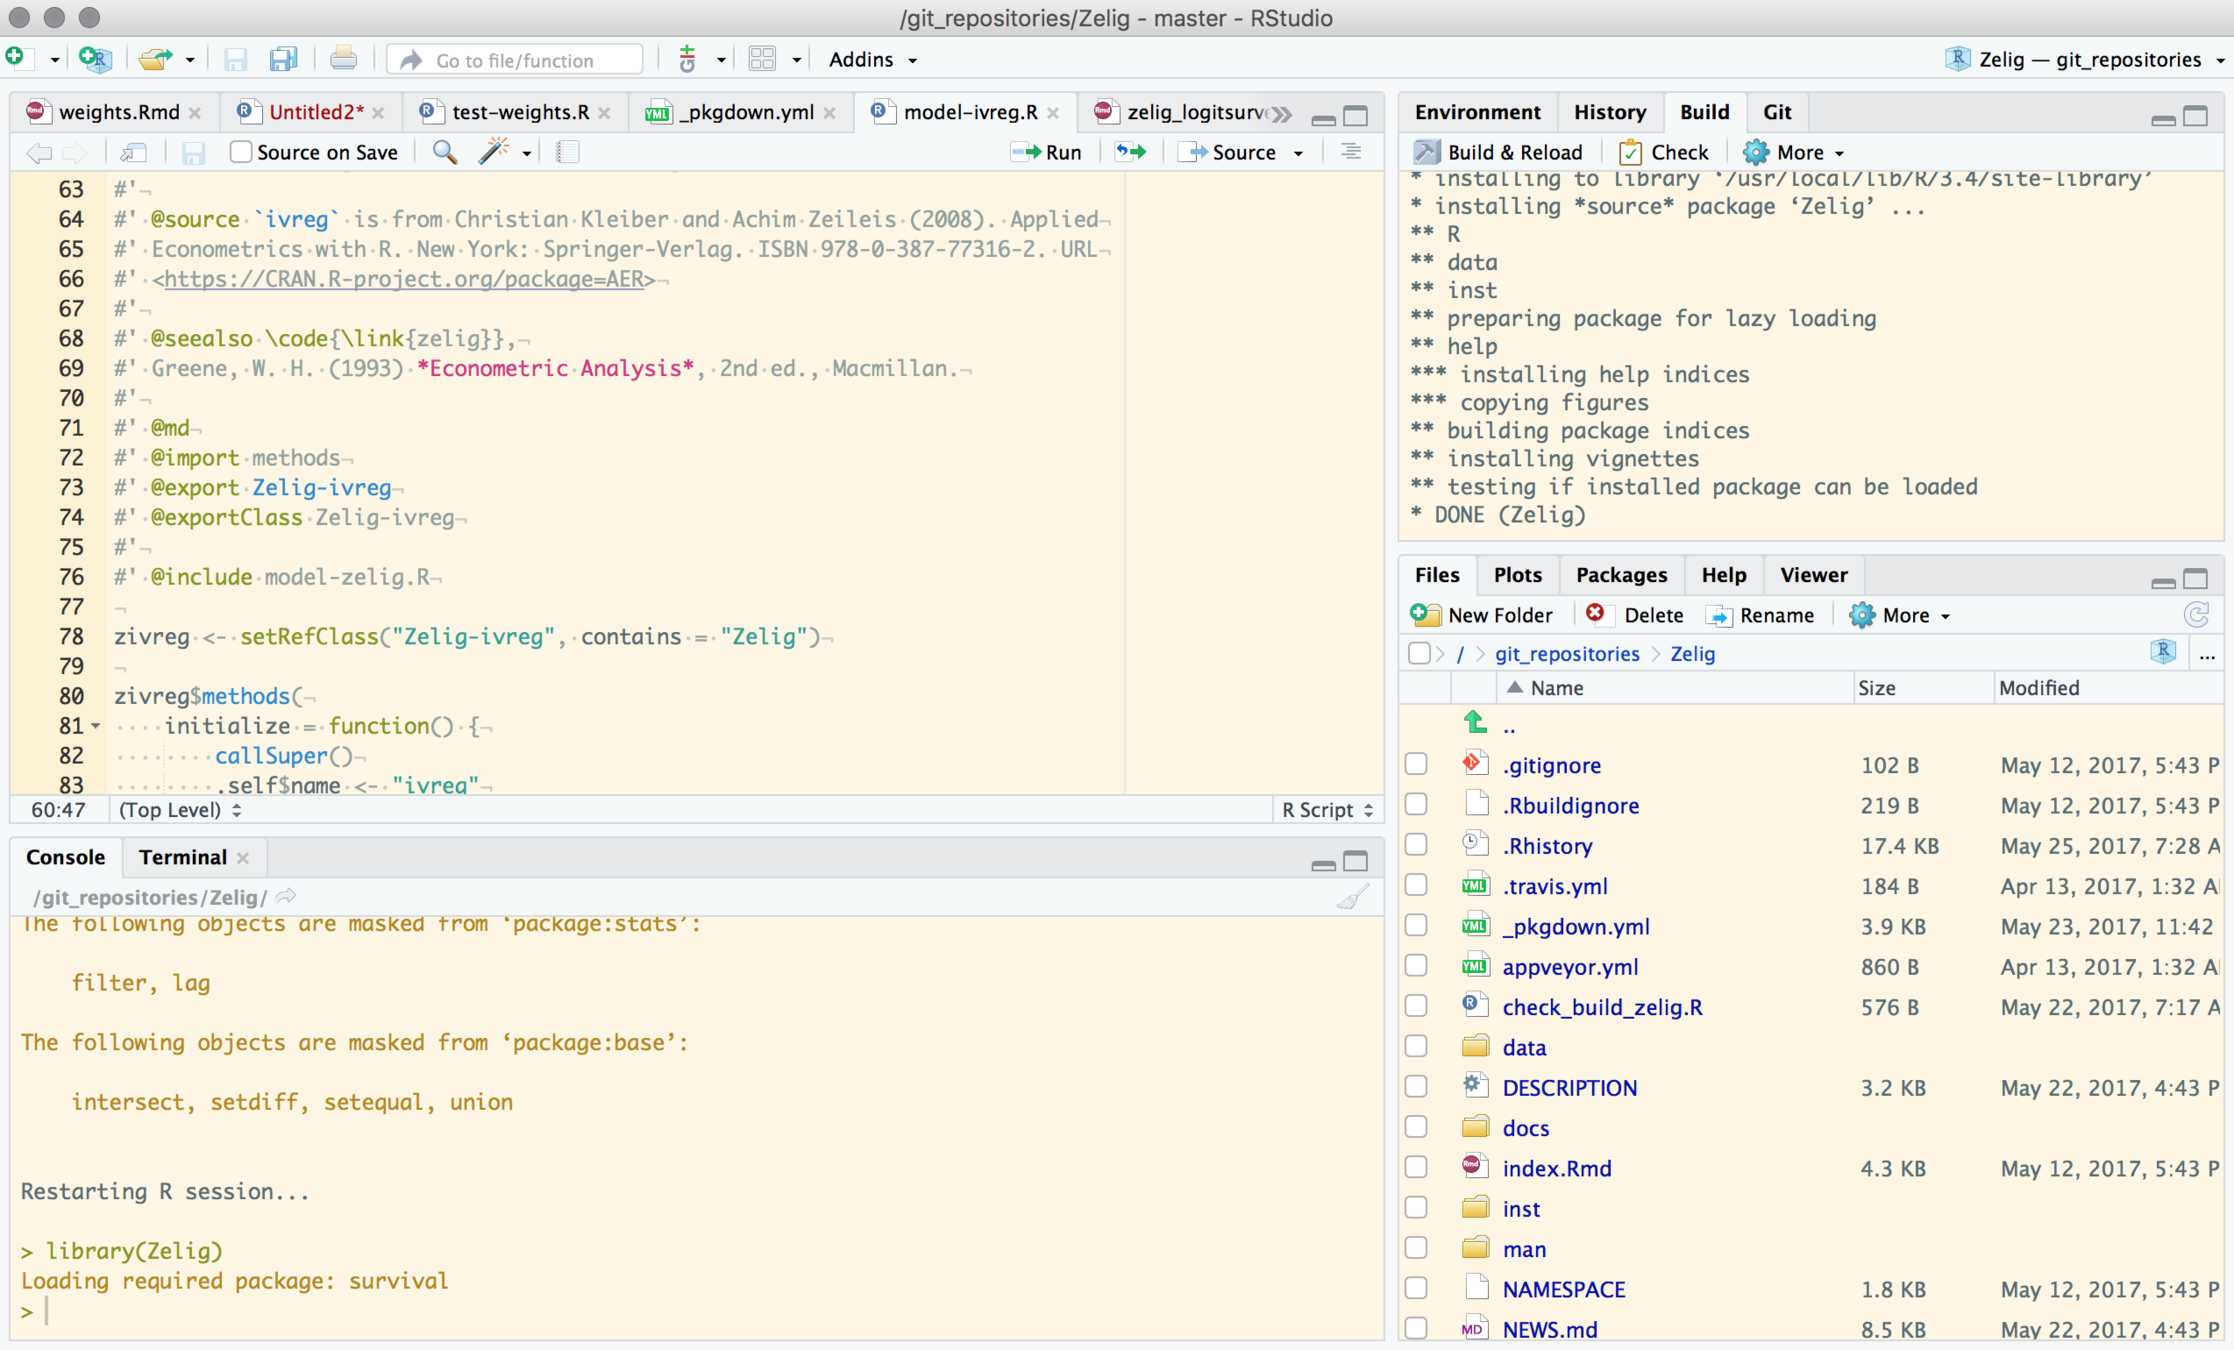
Look around
Source Pane
Look around
Files Pane
Package Tree
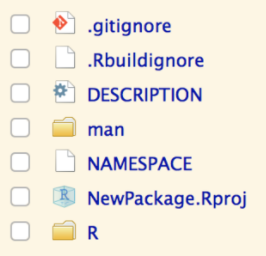
List of files (including regex) for git to ignore
List of files (including regex) for R BUILD to ignore
Machine readable package metadata
Object documentation (probably don't need to edit)
Context for package to look up object names (probably don't need to edit)
RStudio project metadata
R functions
Look around
Build Pane
Setup R Package Build
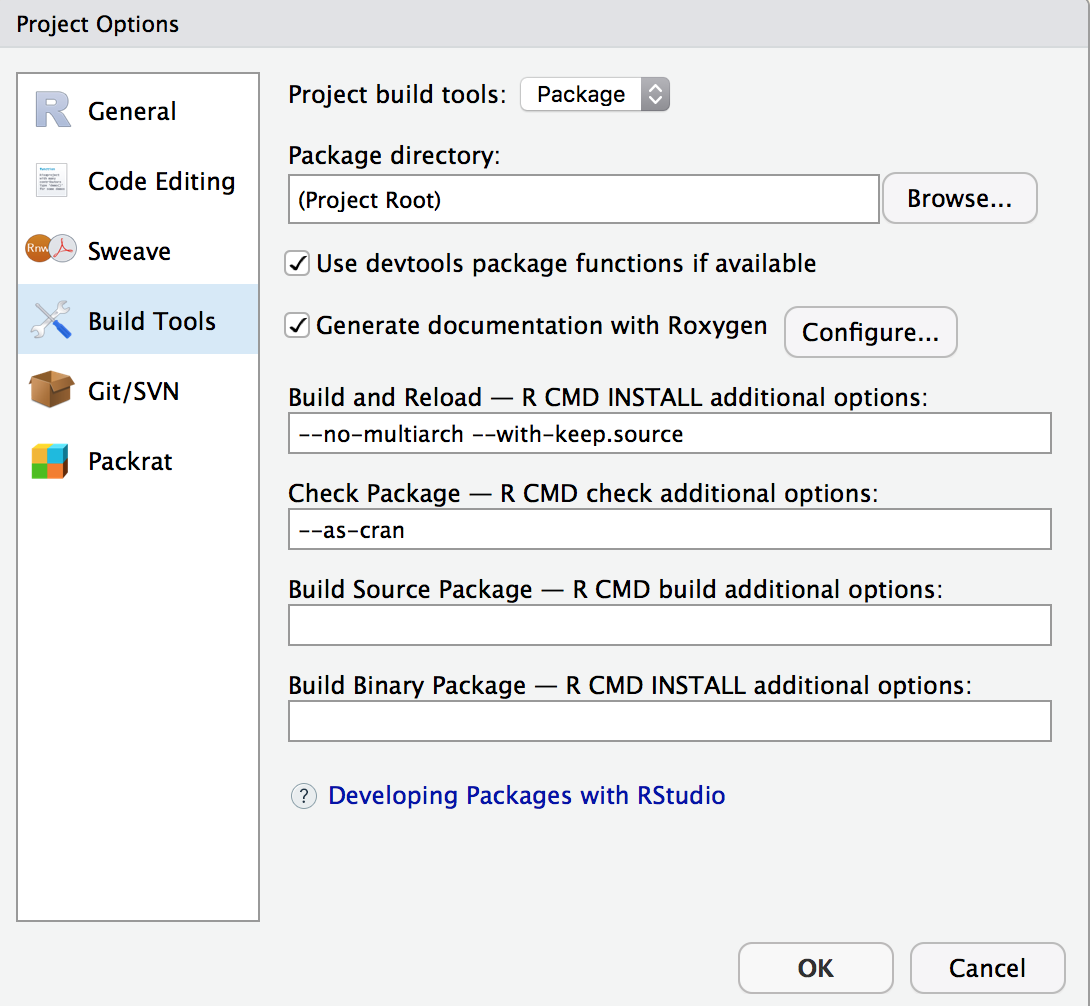


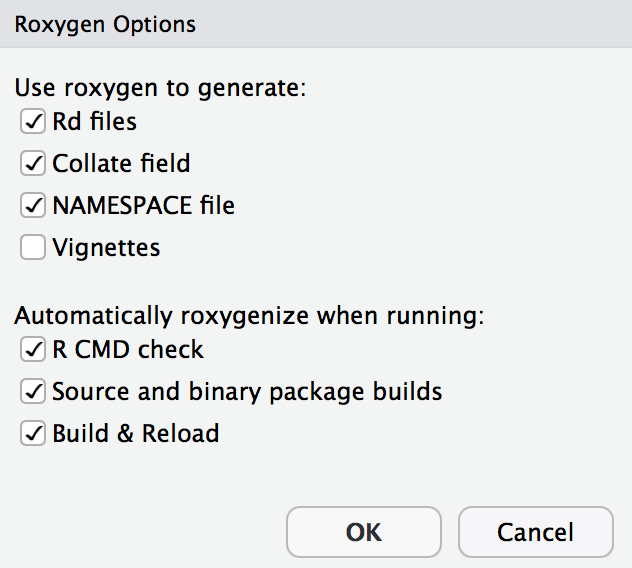
Edit MetaData
In DESCRIPTION
Package: NewPackage
Type: Package
Title: Practice Building a Package
Version: 0.1.0.9000
Author: YOUR NAME
Maintainer: YOURNAME <yourself@somewhere.net>
Description: Practice building a package.
License: GPL >= 3
Imports:
    ggplot2
Encoding: UTF-8
LazyData: true
Roxygen: list(markdown = TRUE)
Semantic versioning
MAJOR.MINOR.PATCH
- MAJOR version when you make incompatible API changes,
- MINOR version when you add functionality in a backwards-compatible manner, and
- PATCH version when you make backwards-compatible bug fixes.
- 0.1.0.9000 indicates development version
Create your 1st function
In a new file R/beta_plot.R:
#' @import ggplot2
#' @export

beta_plot <- function(n = 10000, a = 1, b = 3) {
    # draw distributions
    sims <- rbeta(n = n, shape1 = a, shape2 = b)

    # convert to data frame for ggplot2 compatability
    sims <- data.frame(x = sims)

    # plot probability density function
    ggplot(sims, aes(x)) +
        geom_density() +
        xlab("") + ylab("Probability Density Function") +
        theme_bw()
}
Note: follow a style guide, e.g. http://adv-r.had.co.nz/Style.html
Code available at: http://bit.ly/2rnDnw2
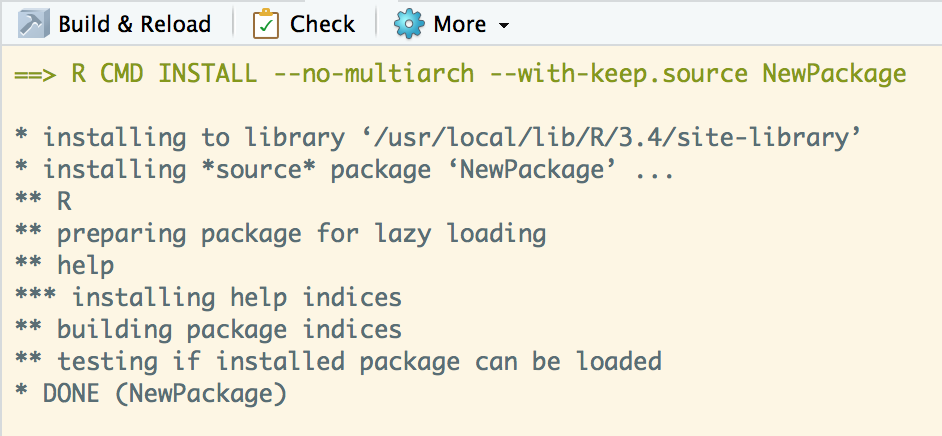
Build Package

Play with it
# load package
library(NewPackage)

# plot various beta distributions
beta_plot(a = 4)
beta_plot(a = 1, b = 2)

# . . . etc . . .
Development on GitHub
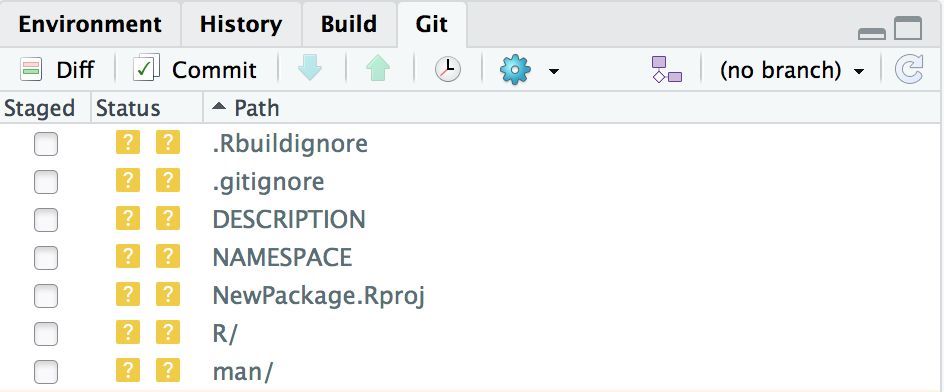
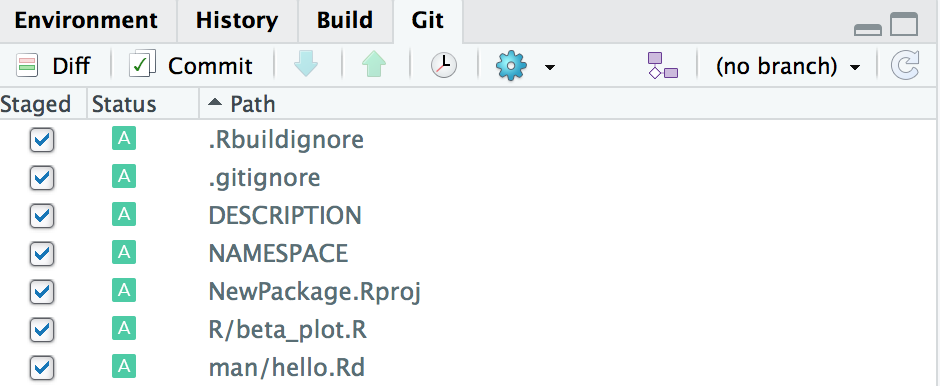
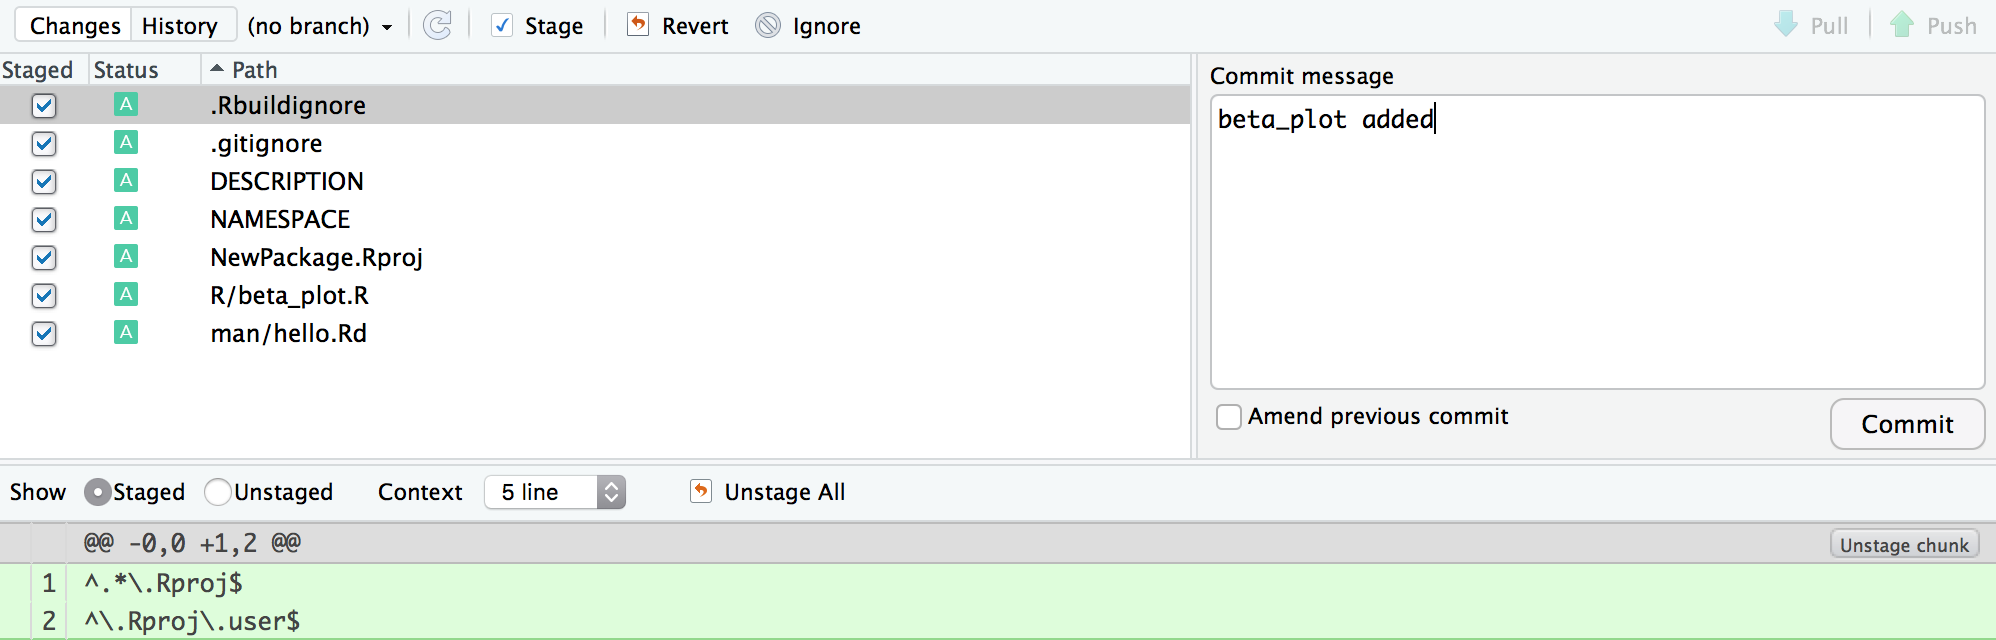
add and Commit changes
Terminal
git add .
git commit -am "beta_plot added"
RStudio
Stage and click commit
If you haven't already, create a GitHub user account:
Create a new Remote repo

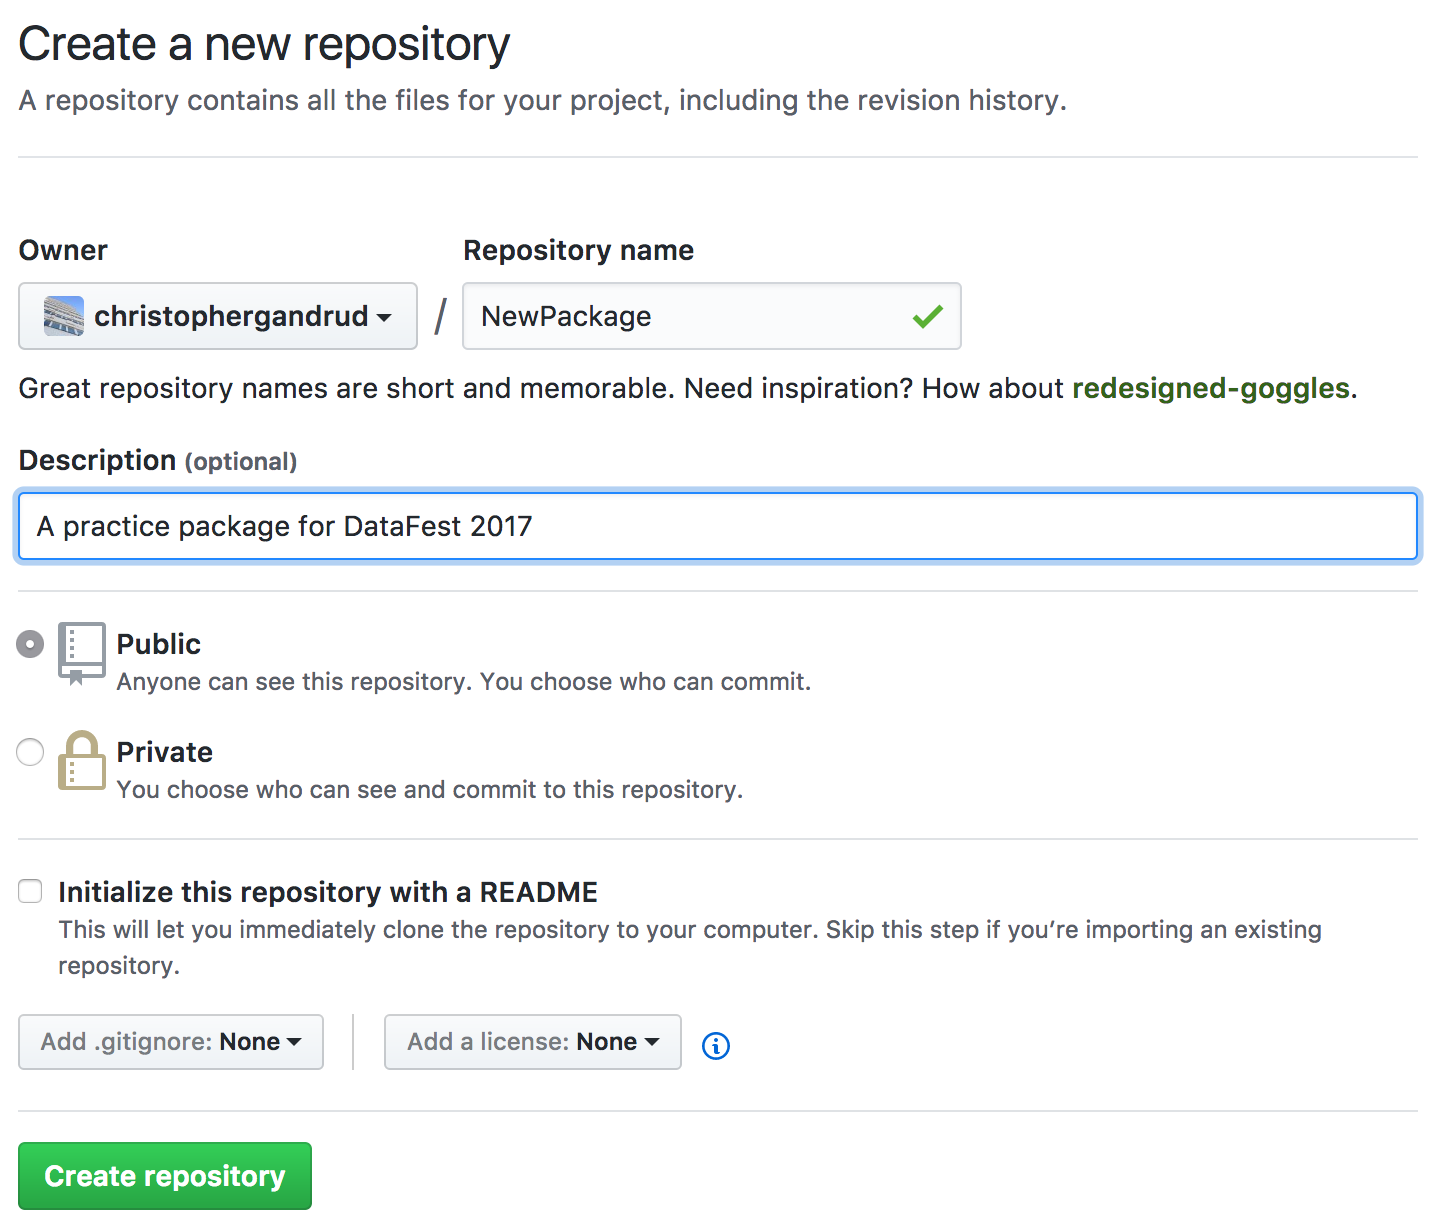
Connect Remote and local Repos

Terminal
git remote add origin https://github.com/USERNAME/NewRepo.git
git push -u origin master
RStudio
git remote add origin https://github.com/USERNAME/NewRepo.git
git push -u origin master
Add GitHub Username and Password
Dynamic Documentation
Documentation
Well-written--fully informative, clear, concise, approachable--documentation is key to:
- adoption
- preventing inadvertent misuse
- enabling collaboration (including with your "future self")
- reproducible research
Dynamic Documentation
Documentation that is executable and executed at build.
Ensures that the docs actually works.
Shows users what to expect.
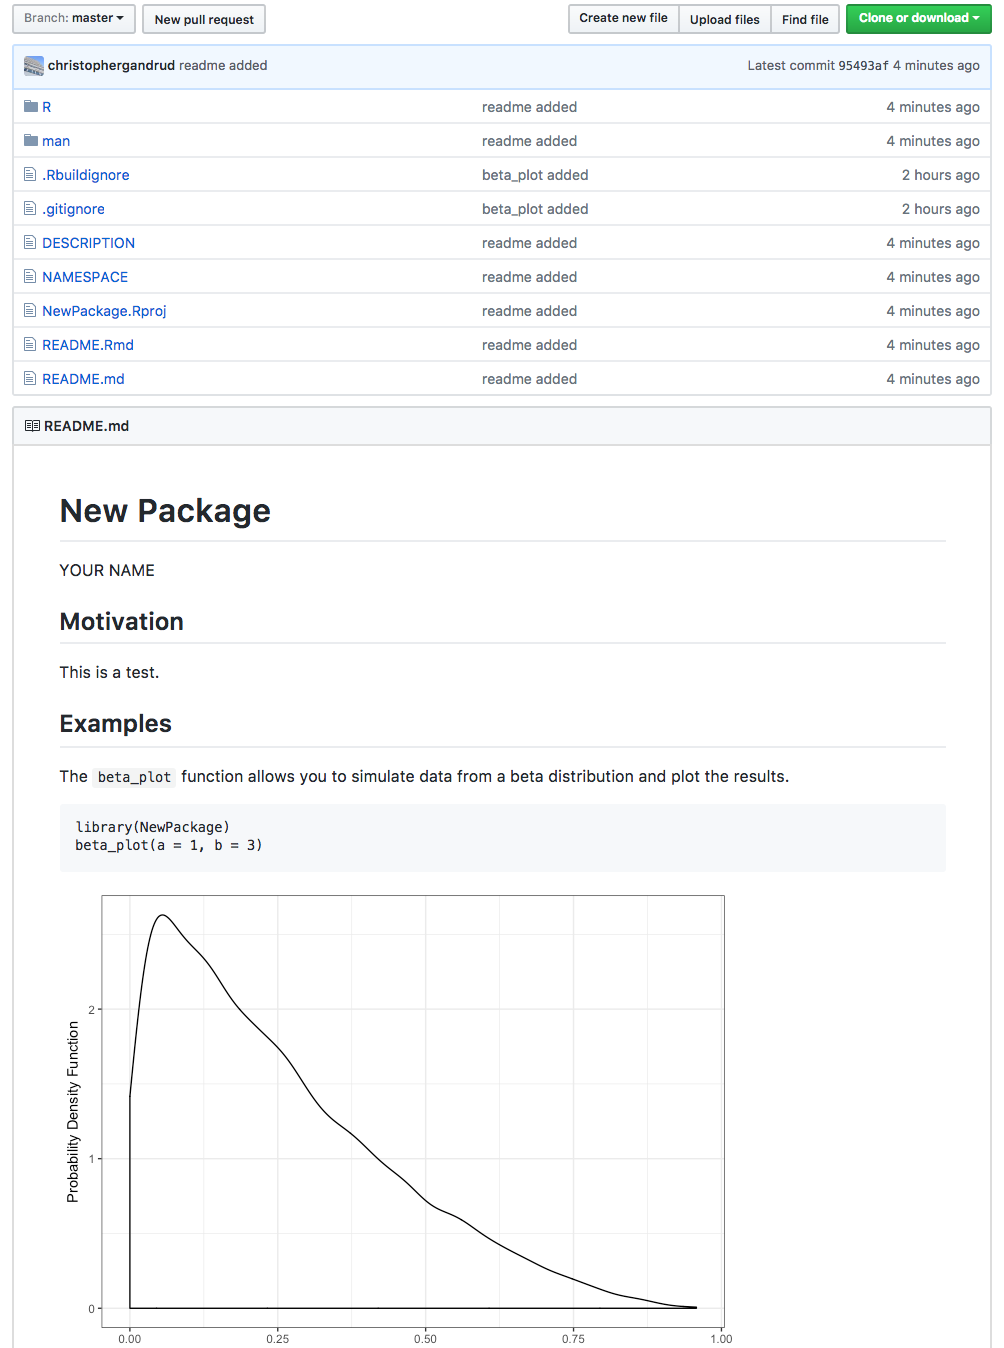
README.MD
All packages should include a README file in their root directory.
The README should:
- be written in Markdown (https://guides.github.com/features/mastering-markdown/)
- include a brief description of the package's purpose, syntax, and a quickstart guide
# New Package

YOUR NAME

## Motivation

This is a test.

## Examples

The `beta_plot` function allows you to simulate data from a
beta distribution and plot the results.
(incomplete README.MD
README.RMD
Ideally the README should include executable RMarkdown examples for dynamic documentation.
R Markdown is Markdown that allows you to include executable code "chunks"
See: https://www.rstudio.com/wp-content/uploads/2016/03/rmarkdown-cheatsheet-2.0.pdf
# Add template README.RMD and
# README.Rmd to .Rbuildignore

devtools::use_readme_rmd()
README.RMD
---
output: md_document
---

<!-- README.md is generated from README.Rmd. Please edit that file -->

```{r setup, include=FALSE}
knitr::opts_knit$set(
        stop_on_error = 2L
)
knitr::opts_chunk$set(
        fig.path="man/figures/"
)
```

# New Package

YOUR NAME

## Motivation

This is a test.

## Examples

The `beta_plot` function allows you to simulate data from a
beta distribution and plot the results.

```{r}
library(NewPackage)
beta_plot(a = 1, b = 3)
```
Text
Code available at: http://bit.ly/2reKW40
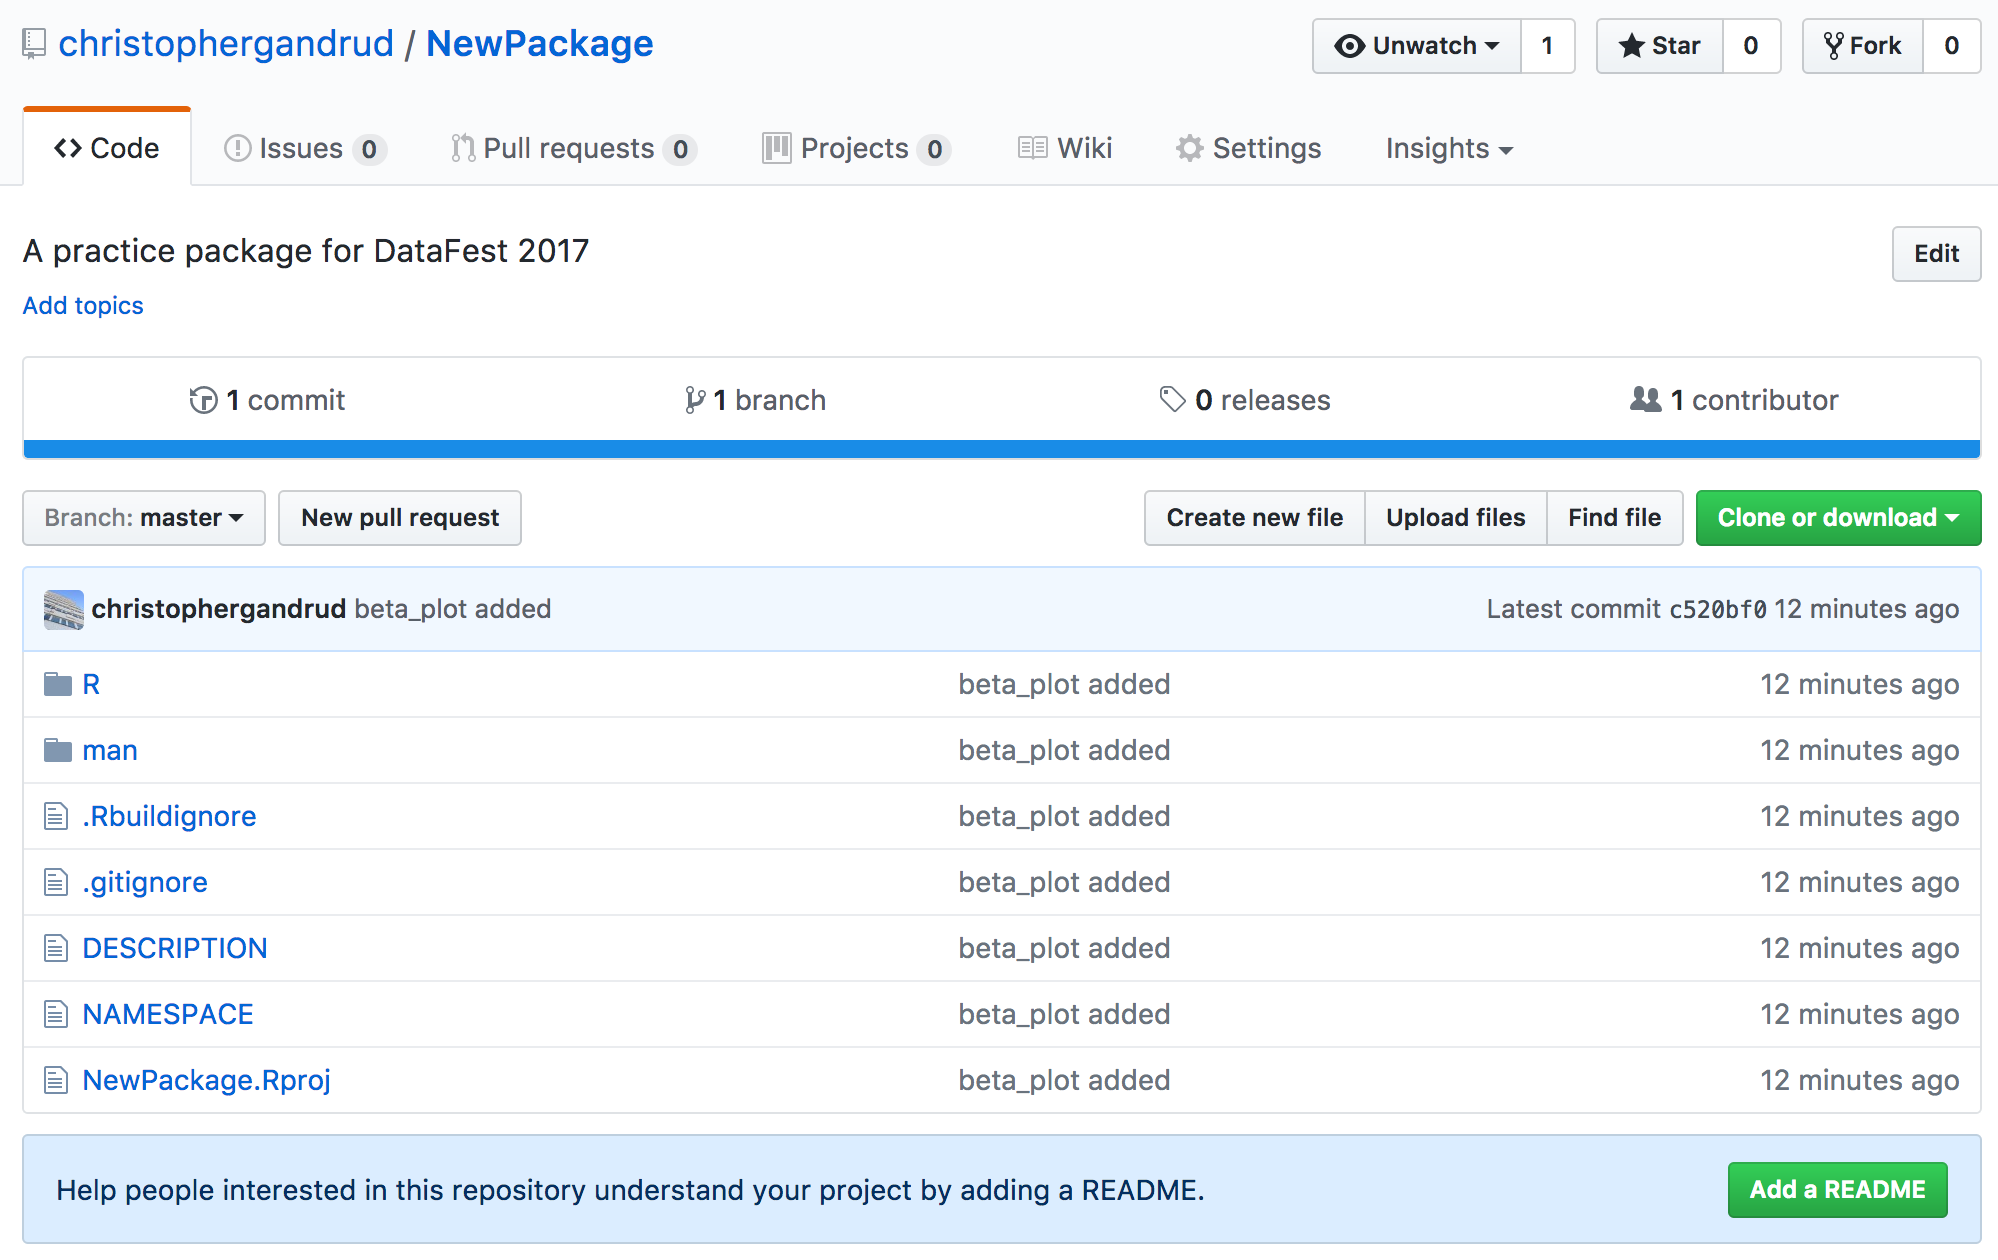
Commit and Push to GitHub
NEWS.md
Document all of the changes made to your package at each version in the NEWS.md file (often called CHANGELOG in other languages)
Roxygen Documentation
Provides a standard way of documenting your package where:
- documentation and code is adjacent (easier to maintain)
- dynamically inspects documentation (more robust)
- abstracts some of the package building work (e.g. NAMESPACES)
- Much easier to write than R's native documentation markup language (which is sort-of-LaTeX). Can even be written in Markdown.
Roxygen Documentation
#' @import ggplot2
#' @export

beta_plot <- function(n = 10000, a = 1, b = 3) {
    # draw distributions
    sims <- rbeta(n = n, shape1 = a, shape2 = b)

    # convert to data frame for ggplot2 compatability
    sims <- data.frame(x = sims)

    # plot probability density function
    ggplot(sims, aes(x)) +
        geom_density() +
        xlab("") + ylab("Probability Density Function") +
        theme_bw()
}
This is Roxygen
Description and argument documentation
#' Draw values from a beta distribution and plot the probability density
#' function
#'
#' @param n number of observations to draw
#' @param a non-negative alpha parameter of the beta distribution
#' @param b non-negative beta parameter of the beta distribution
#'
#' @import ggplot2
#' @export

beta_plot <- function(n = 10000, a = 1, b = 3) {
    # draw distributions
    sims <- rbeta(n = n, shape1 = a, shape2 = b)

    # convert to data frame for ggplot2 compatability
    sims <- data.frame(x = sims)

    # plot probability density function
    ggplot(sims, aes(x)) +
        geom_density() +
        xlab("") + ylab("Probability Density Function") +
        theme_bw()
}
Function Details
#' Draw values from a beta distribution and plot the probability density
#' function
#'
#' @param n number of observations to draw
#' @param a non-negative alpha parameter of the beta distribution
#' @param b non-negative beta parameter of the beta distribution
#'
#' @details The Beta distribution with parameters \eqn{a} and \eqn{b} has
#' density:
#'
#' \deqn{
#'     \Gamma(a+b)/(\Gamma(a)\Gamma(b))x^(a-1)(1-x)^(b-1)
#' }
#'
#' for \eqn{a > 0}, \eqn{b > 0} and \eqn{0 \le x \le 1}.
#'
#' @seealso \code{\link{rbeta}}, \code{\link{geom_density}}
#' @import ggplot2
#' @export
Executable Exampes
#' Draw values from a beta distribution and plot the probability density
#' function
#'
#' @param n number of observations to draw
#' @param a non-negative alpha parameter of the beta distribution
#' @param b non-negative beta parameter of the beta distribution
#'
#' @details The Beta distribution with parameters \eqn{a} and \eqn{b} has
#' density:
#'
#' \deqn{
#'     \Gamma(a+b)/(\Gamma(a)\Gamma(b))x^(a-1)(1-x)^(b-1)
#' }
#'
#' for \eqn{a > 0}, \eqn{b > 0} and \eqn{0 \le x \le 1}.
#'
#' @examples
#' # Draw from beta distribution with parameters a = 1 and b = 3
#' beta_plot(a = 1, b = 3)
#'
#' @seealso \code{\link{rbeta}}, \code{\link{geom_density}}
#' @import ggplot2
#' @export
Will be run when you check package
After Build
?beta_plot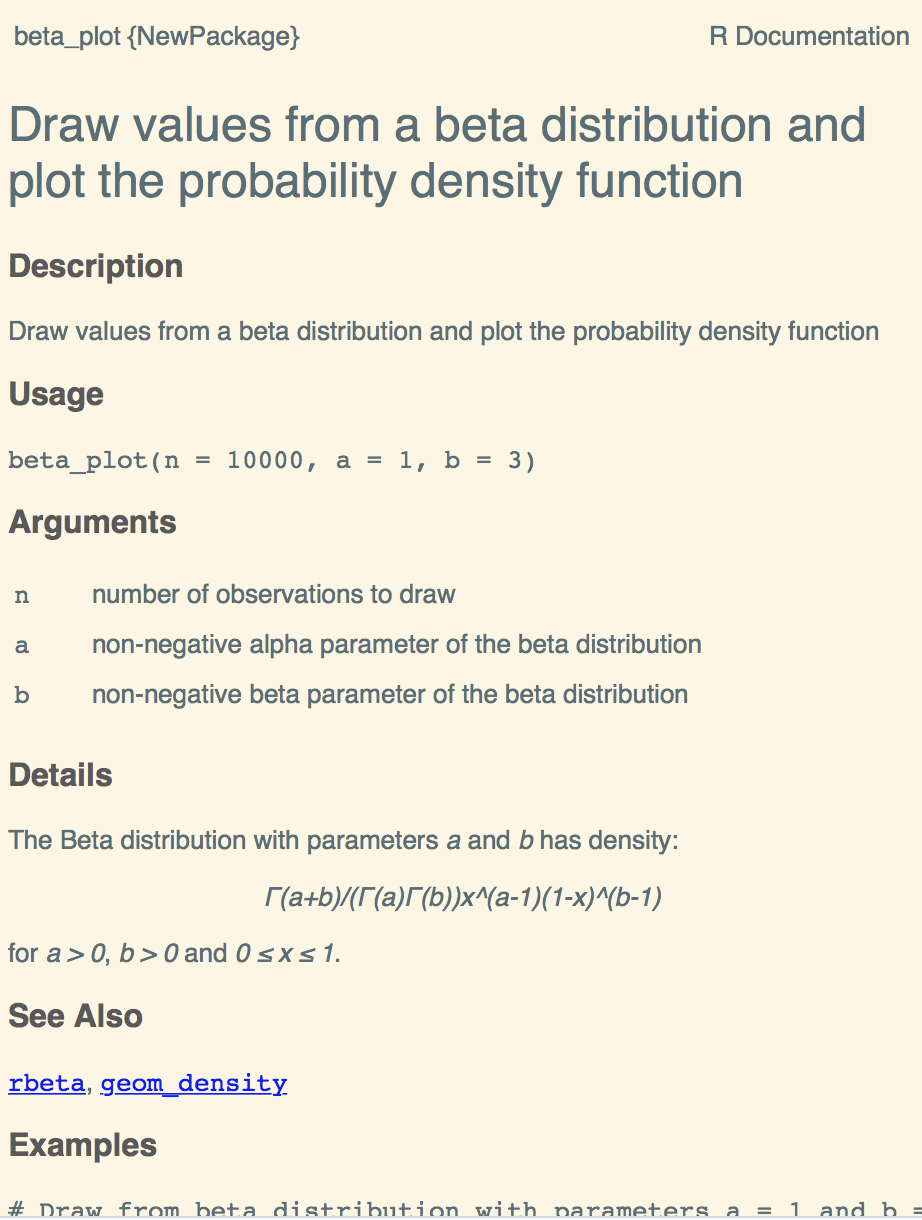
Tests
When do you want your package to fail?
As soon as possible.
So you can fix it quickly.
Building a Testing suite allows you to fail faster.
Enabling more robust code.
Test-Driven Development
Make the test before making the feature.
Tests
Try to include automatically and regularly run tests of your package's full capabilities
This includes both:
- what you require the package to do (REQUIRE tests)
- what your package can't do (FAILURE tests)
Failure Testing
Make sure that if your code is going to fail that is does so quickly and informatively.
What do we want to test?
beta_plot <- function(n = 10000, a = 1, b = 3) {
    # draw distributions
    sims <- rbeta(n = n, shape1 = a, shape2 = b)

    # convert to data frame for ggplot2 compatability
    sims <- data.frame(x = sims)

    # plot probability density function
    ggplot(sims, aes(x)) +
        geom_density() +
        xlab("") + ylab("Probability Density Function") +
        theme_bw()
}
Require Tests
- Draws the correct distribution
- A plot of the PDF is returned
Failure Tests
- Function fails informatively when users supply a, b, or n less than or equal to 0.
Set up Test Suite with devtools
devtools::use_testthat()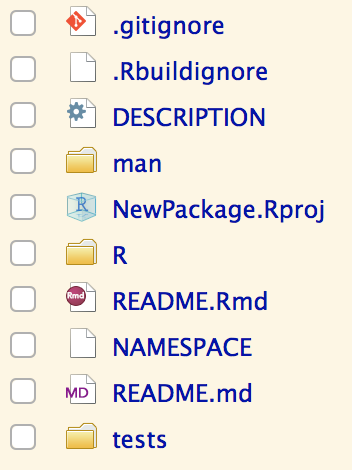
Set up Test Suite with devtools
Tests in R source files called test-*.R
Calls that apply to all tests (e.g. loading packages used by all tests)
FAILURE Test
test_that("FAILURE TEST: don't accept a, b, n values <= 0", {
    expect_error(beta_plot(a = 0))
    expect_error(beta_plot(b = -1))
    expect_error(beta_plot(n = -3))
})
In tests/testthat/test-beta_plot.R:
FAILURE Test
test_that("FAILURE TEST: don't accept a, b, n values <= 0", {
    expect_error(beta_plot(a = 0))
    expect_error(beta_plot(b = -1))
    expect_error(beta_plot(n = -3))
})
In tests/testthat/test-beta_plot.R:
Do these successfully fail?
(Inadequate) FAILURE Test
beta_plot(a = 0)beta_plot(b = -1)beta_plot(n = -2)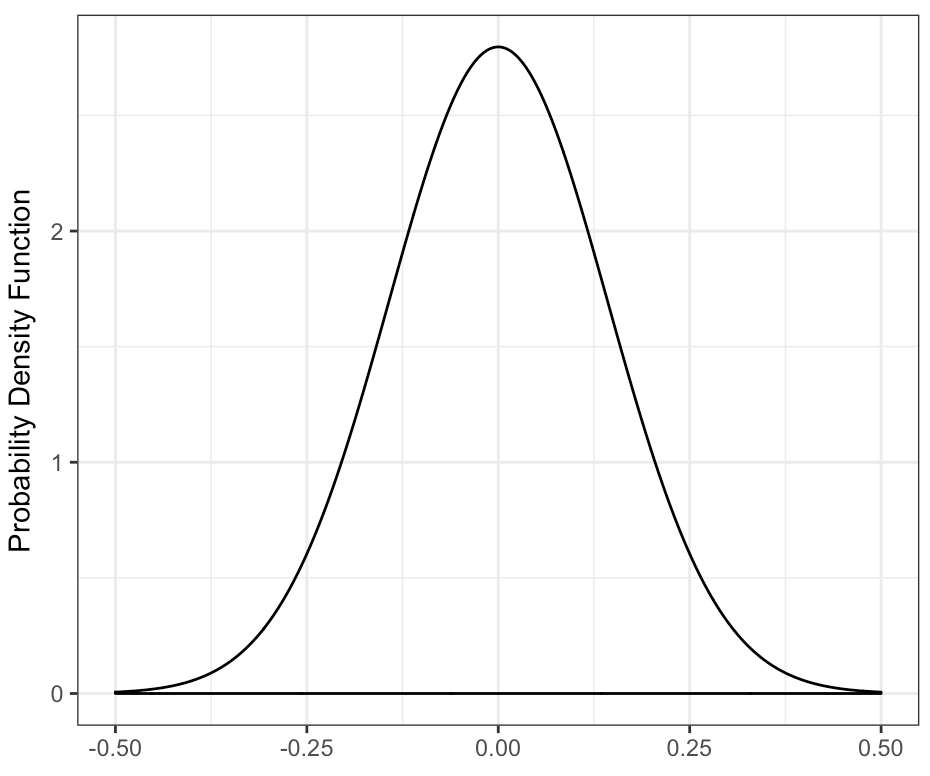

Warning messages:
1: In rbeta(n = n, shape1 = a, shape2 = b) : NAs produced
2: Removed 10000 rows containing non-finite values (stat_density).
Error in rbeta(n = n, shape1 = a, shape2 = b) : invalid argumentsImprove Function
beta_plot <- function(n = 10000, a = 1, b = 3) {
    # ensure non-zero/negative argument values
    if (any(n <= 0, a <= 0, b <= 0))
        stop("n, a, and b arguments must be greater than 0.", call. = FALSE)

    # draw distributions
    sims <- rbeta(n = n, shape1 = a, shape2 = b)

    # convert to data frame for ggplot2 compatability
    sims <- data.frame(x = sims)

    # plot probability density function
    ggplot(sims, aes(x)) +
        geom_density() +
        xlab("") + ylab("Probability Density Function") +
        theme_bw()
}
Improve Tests
test_that("FAILURE TEST: don't accept a, b, n values <= 0", {
    expect_error(beta_plot(a = 0),
                 "n, a, and b arguments must be greater than 0.")
    expect_error(beta_plot(b = -1),
                 "n, a, and b arguments must be greater than 0.")
    expect_error(beta_plot(n = -2),
                 "n, a, and b arguments must be greater than 0.")
})
On your own:
Create REQUIRE tests (note: not a trivial task with stochastic and graphical output)
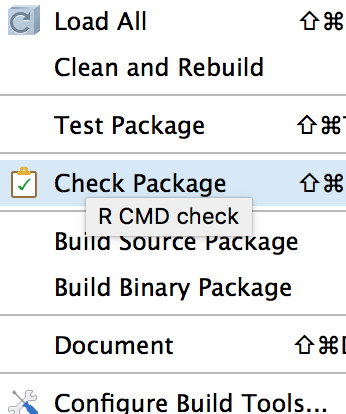
Build and Check Package

Runs tests and CRAN CHECK
CRAN: Comprehensive R Archive Network
Debugging Build and Check
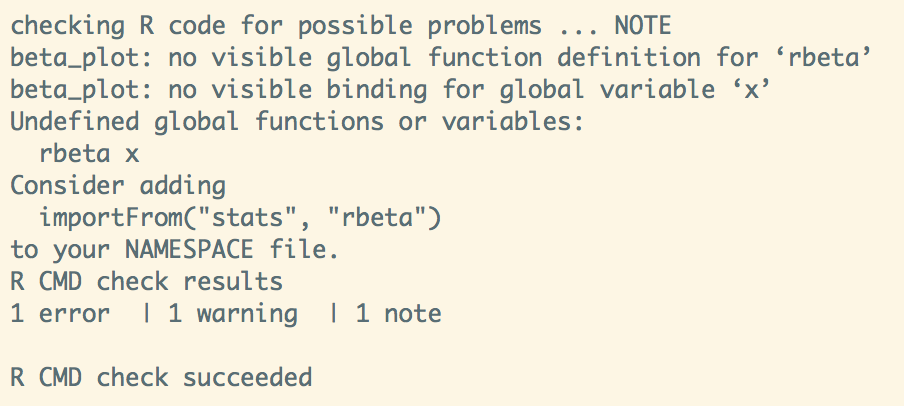
#' @import ggplot2
#' @importFrom stats rbeta
#' @export

beta_plot <- function(n = 10000, a = 1, b = 3) {
    x <- NULL
    # ensure non-zero/negative argument values
    if (any(n <= 0, a <= 0, b <= 0))
stop("n, a, and b arguments must be greater than 0.", call. = FALSE)- Original aim: avoid " integration hell" by merging changes into a master as often as possible
- Also refers to build servers that build the software and (can) run included tests.
- Useful for testing remotely on " clean" systems
- Can test on multiple operating systems
Continuous Integration

Windows
Linux/macos

SetUp Steps
- Have your package source code on GitHub
- Include
.travis.yml
and
appveyor.yml in your project's
root directory
- Can automate with devtools: use_travis() and use_appveyor()
- Login to the services and tell them to watch your package's GitHub repo. E.g. in TravisCI:

Now every time you push changes to GitHub:

More on Testing: http://slides.com/christophergandrud/failing-faster
IQSS Best Practices Report Card
Document your compliance with the IQSS Best practices
IQSSdevtools::check_best_practices()IQSS Report Card
Survey results for NewPackage:
---------------------------------------
Documentation:
  readme: yes
  roxygen: yes
  news: no
  bugreports: no
  vignettes: no
  website:
    openscholar: no
    pkgdown_website: no
License:
  gpl3_license: yes
Version_Control:
  git: yes
  github: yes
Testing:
  uses_testthat: yes
  uses_travis: no
  uses_appveyor: no
  build_check:
    build_check_completed: yes
    no_check_warnings: yes
    no_check_errors: yes
    no_check_notes: yes
  test_coverage: 100
Background:
  package_name: NewPackage
  package_version: 0.1.0.9000
  package_language: R
  package_commit_sha: 59c60f0118650cc77075da0c6f5631894a9e14ce
  iqss_bestpractices_version: 0.0.0.9000
  iqssdevtools_version: 0.0.0.9000
  check_time: 2017-05-30 11:41:59
Additional
Additional
- Create a package website with pkgdown: http://hadley.github.io/pkgdown/
- Push package to CRAN (don't actually do with your example package they will get angry)
Developing Statistical Software Using IQSS Best Practices
By Christopher Gandrud


