
Advanced tools for strategic planning and energy efficient operation in public buildings and cities
BEEMind


Un consorci de:
En col·laboració amb:
BEEMind
Technology for resilient buildings and cities 4.0
- BEEMind is an AI powered environment that integrates three key pillars: a semantic web technologies to make data fully interoperable, a big data architecture to manage large data volumes, and a set of intelligent tools to analyze, predict, and optimize urban environments.
-
It is structured around the following tools:
- MindCity
- MindOpera
AI-based solutions to enhance climate resilience in buildings and urban environments
BEEMind tools
MindCity
MindOpera
MindCity
BEEMind tools : MindCity
Ciutats 4.0 : high resilient cities in practice
This solution helps municipalities and consortia go digital and manage their data effectively on a local level.
It is a key tool for smart cities, energy planning, adapting to climate change, and making decisions about urban retrofitting
What does it do? It checks out KPIs for buildings and helps plan for climate change:
-
City microclimate model
-
Rates how vulnerable buildings are to climate issues
-
Forecasts energy upgrades and adaptation strategies
-
Sends heat wave alerts 4 days ahead
-
Aids in designing urban green spaces and shelters
Description
BEEMind tools : MindCity
-
Integration, processing, and visualization of large amounts of urban data at the building level
-
AI driven models to improve cities and make them more resilient against extreme weather events.
-
Figuring out specific geospatial indicators that connect to climate action and the shift towards cleaner energy.
-
Evaluation of vegetation and urban climatology scenarios
Funcionalities
Cities 4.0: Environmentally Smart
-
Facilitates strategic decision-making in the energy, climate, and urban planning fields
-
Optimizes resources and processes for large-scale city data analysis
-
Improves coordination between technical departments and citizen interaction
-
Highly scalable to any city in Europe
Beneffits
Unlocks powerful data visualization solutions for consultancies
Data integration Across Various Scales
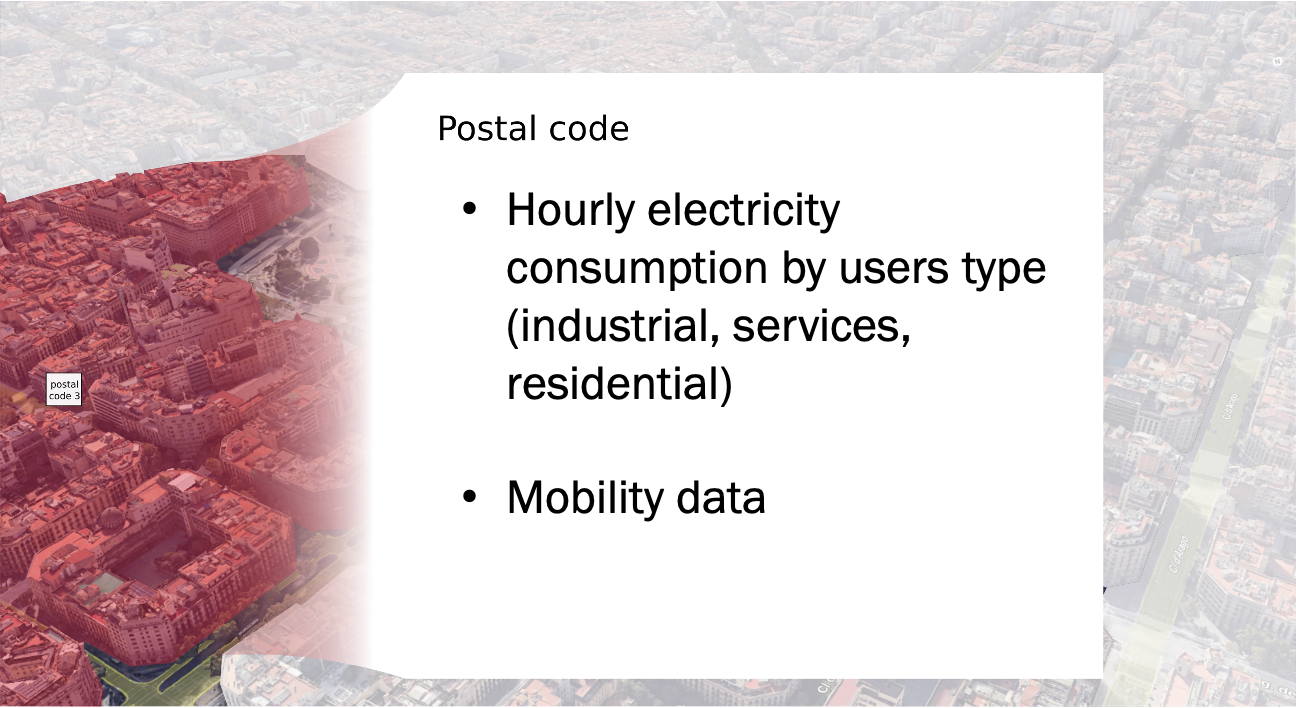
3. Data at building level
2. Data at census code level
1. Data at postal code level
BEEMind tools : MindCity
AI powered geo models
BEEMind tools : MindCity
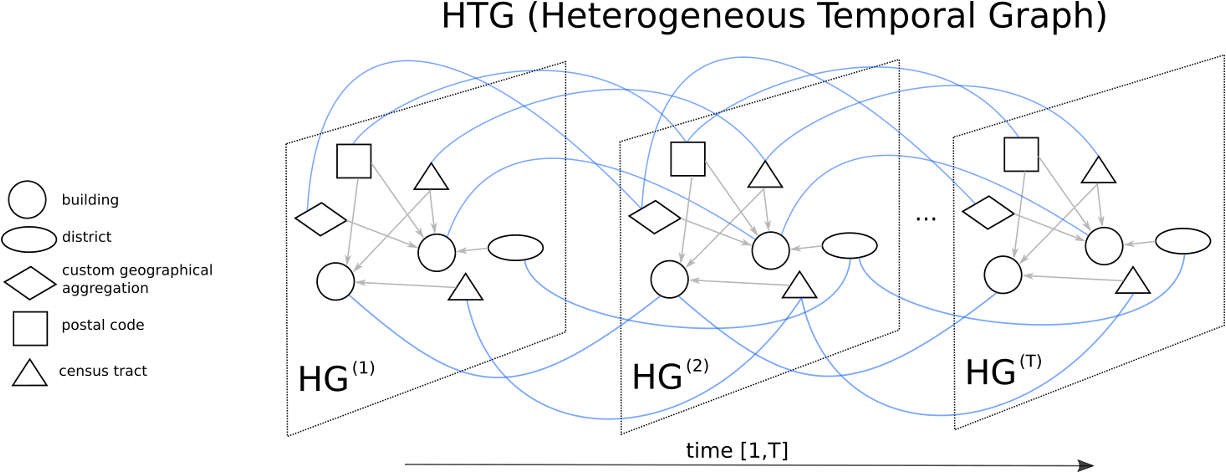
We develop machine learning and Graph Convolutional Neural Network (GCNN) models
To enable microclimate assessment and learning patterns from geo-structured data (buildings, streets, use, energy, etc.).
Estimation of KPIs for all buildings without data
It is a digital landscape, a dynamic knowledge graph that brings urban exploration to life.
Definition of future climate mitigation and adaptation scenarios
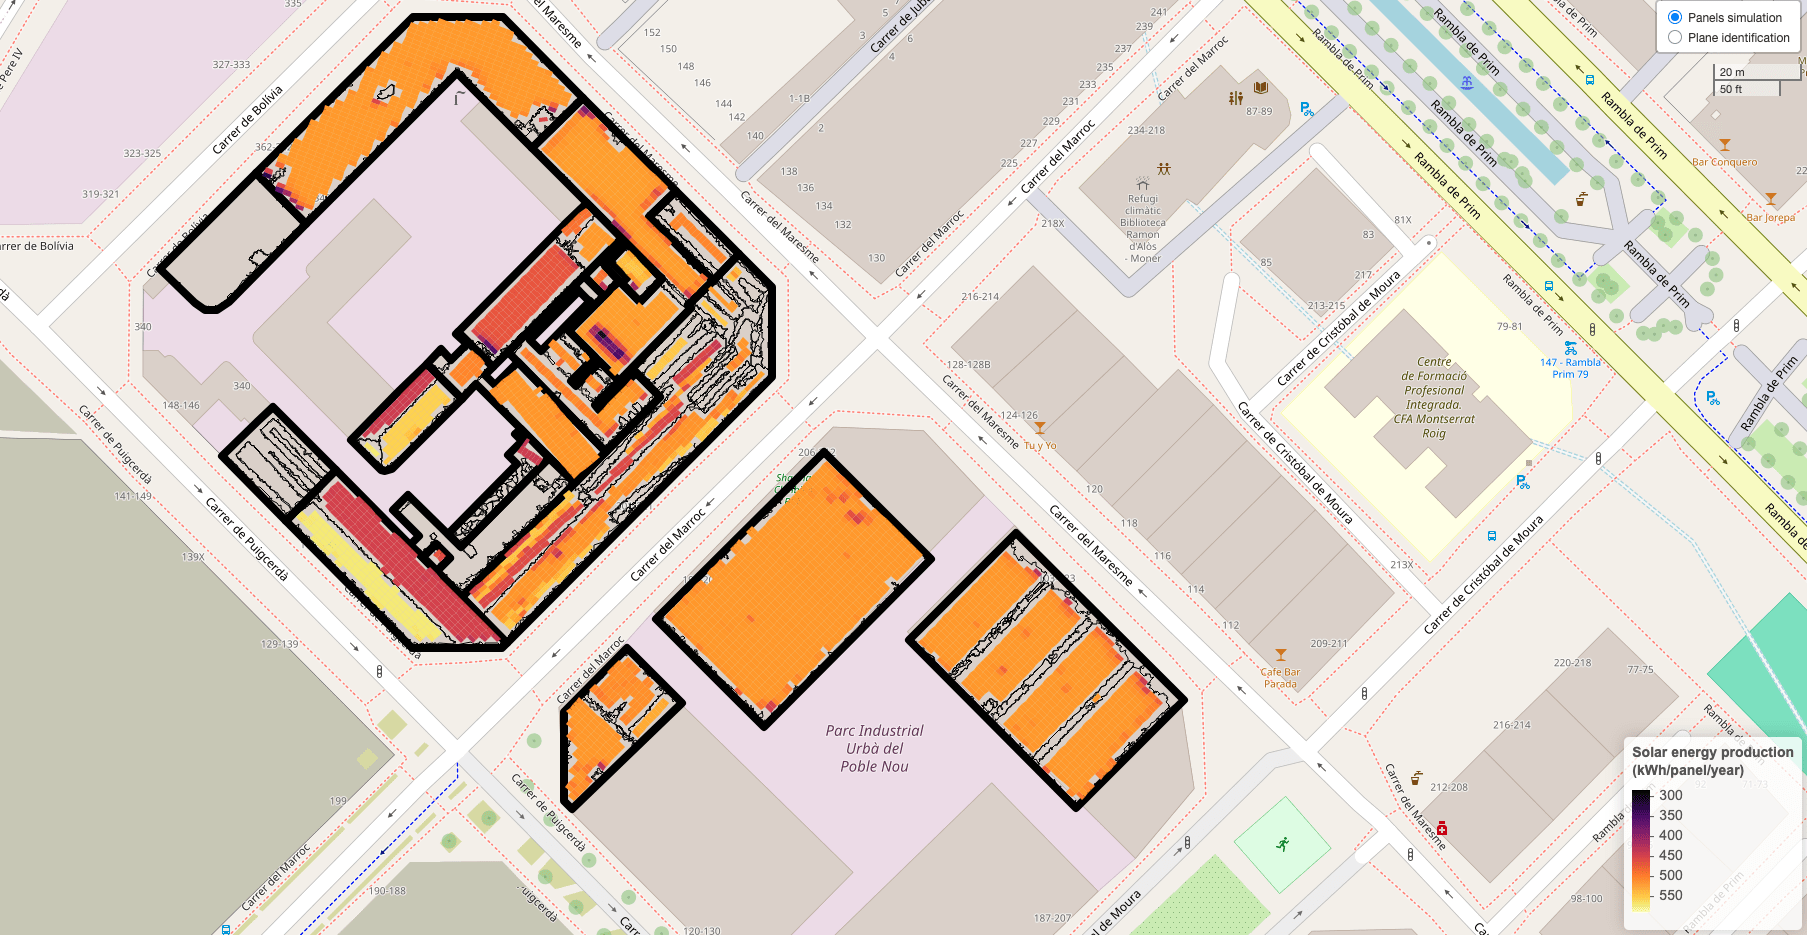
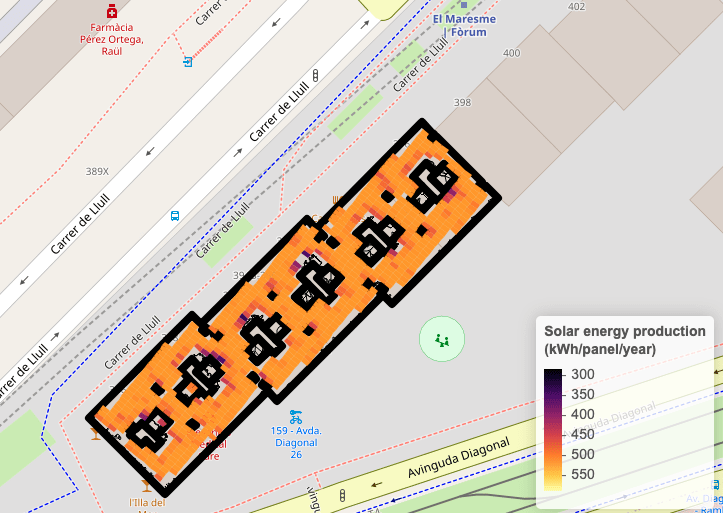
Integrated function for large-scale analysis of the potential for photovoltaic solar installations in urban environments.
A key differentiator is the ability to provide hourly generation profiles that take into account shading effects in urban areas.
Prospecció massiva d'autoconsum fotovoltaic
-
Detection of potential rooftops using cadastral and LiDAR data
-
Detailed shadow calculation from neighboring buildings
-
Sizing of PV installations using the open-source PySAM library
BEEMind tools : MindCity
Functionalities
BEEMind tools : MindCity
Use cases
-
Optimizes resources and processes
For large-scale analysis of geo referenced urban data -
Improves coordination
Between municipal technical departments and citizen interaction -
High scalability
For any city in Spain
-
Climate vulnerability map
Detect vulnerable areas based on large number of KPIs -
Support buildings energy retrofitting
Identify and prioritize buildings with the greatest needs -
Actions to adapt to heat waves
Optimizing climate shelters, better climate communications and greening
Impacts
Cities 4.0: Environmentally Smart
MindOpera
BEEMind : MindOpera
Edificis 4.0 : Operativa global d'edificis 4.0
Modular solution for integrating operational data from public or private buildings, with the goal of improving energy efficiency, facilitating maintenance, and centralizing knowledge about their operation.
An essential tool for entities managing multiple buildings: standard data orchestration, predictive maintenance, energy efficiency...
Description
Dashboard administració MindOpera
Monitoring and predictive control
Energy optimization
Operació 4.0 d'edificis
-
Modular cloud architecture
-
Automatic aggregation and validation
-
Multi-building supervision
-
Anomaly detection
-
Predictive maintenance
-
Comprehensive equipment monitoring
-
Semantic standardization
-
Real-time intelligence
BEEMind : MindOpera
BEEMind : MindOpera
-
Integration of heterogeneous operational data (consumption and temperature, maintenance orders, energy efficiency measures, RES generation, cadastre, BIM, and SCADA data)
-
Automatic harmonization of records from multiple sources (Modbus, Bacnet, DEXMA, etc.)
-
Generation of operational indicators (self-consumption, PR, CO₂ avoided, etc.)
-
Adaptable visualizations for each infrastructure
-
AI modules focused on predictive maintenance, control, and energy optimization
Functionalitalities
Benefits
-
Orchestration and harmonization of large volumes of operational data from buildings
-
Improves overall management of equipment and commercial buildings
-
Reduces supervision time and generates smart alerts
-
High interoperability and communication with management and maintenance systems
-
Suitable for managers of public and commercial building portfolios
Buildings 4.0: Global Operation of Buildings 4.0
BEEMind tools : MindOpera
Use cases
-
Centralized management of technical systems
-
Automatic generation of KPIs and operational alerts
-
Continuous monitoring of HVAC, lighting, DHW, and ventilation systems
-
-
Early detection of anomalies in technical systems
-
Identification of inconsistencies in electricity generation/export or device behavior
-
Real-time performance analysis with interpolation and timestamp control
-
Efficient operation through reduced downtime and failure anticipation
Value
Improves service continuity and prevents penalties due to malfunctioning
Cities 4.0: Environmentally Smart
BEEMind tools : MindOpera
-
Monitoring of PV self-consumption systems
-
Data logging for inverters, statuses, temperatures, irradiance, etc.
-
Performance tracking and calculation of KPIs such as PR, CO₂ avoided, and equivalent households
-
-
Monitoring in multi-building or multi-company scenarios
-
Capacity for progressive data growth and aggregated monitoring
-
High interoperability, failure anticipation, and improved service continuity
Maximizes production and facilitates the justification of subsidies.
Cities 4.0: Environmentally Smart
Use cases
Value
Tecnology BEEMind
big data architecture
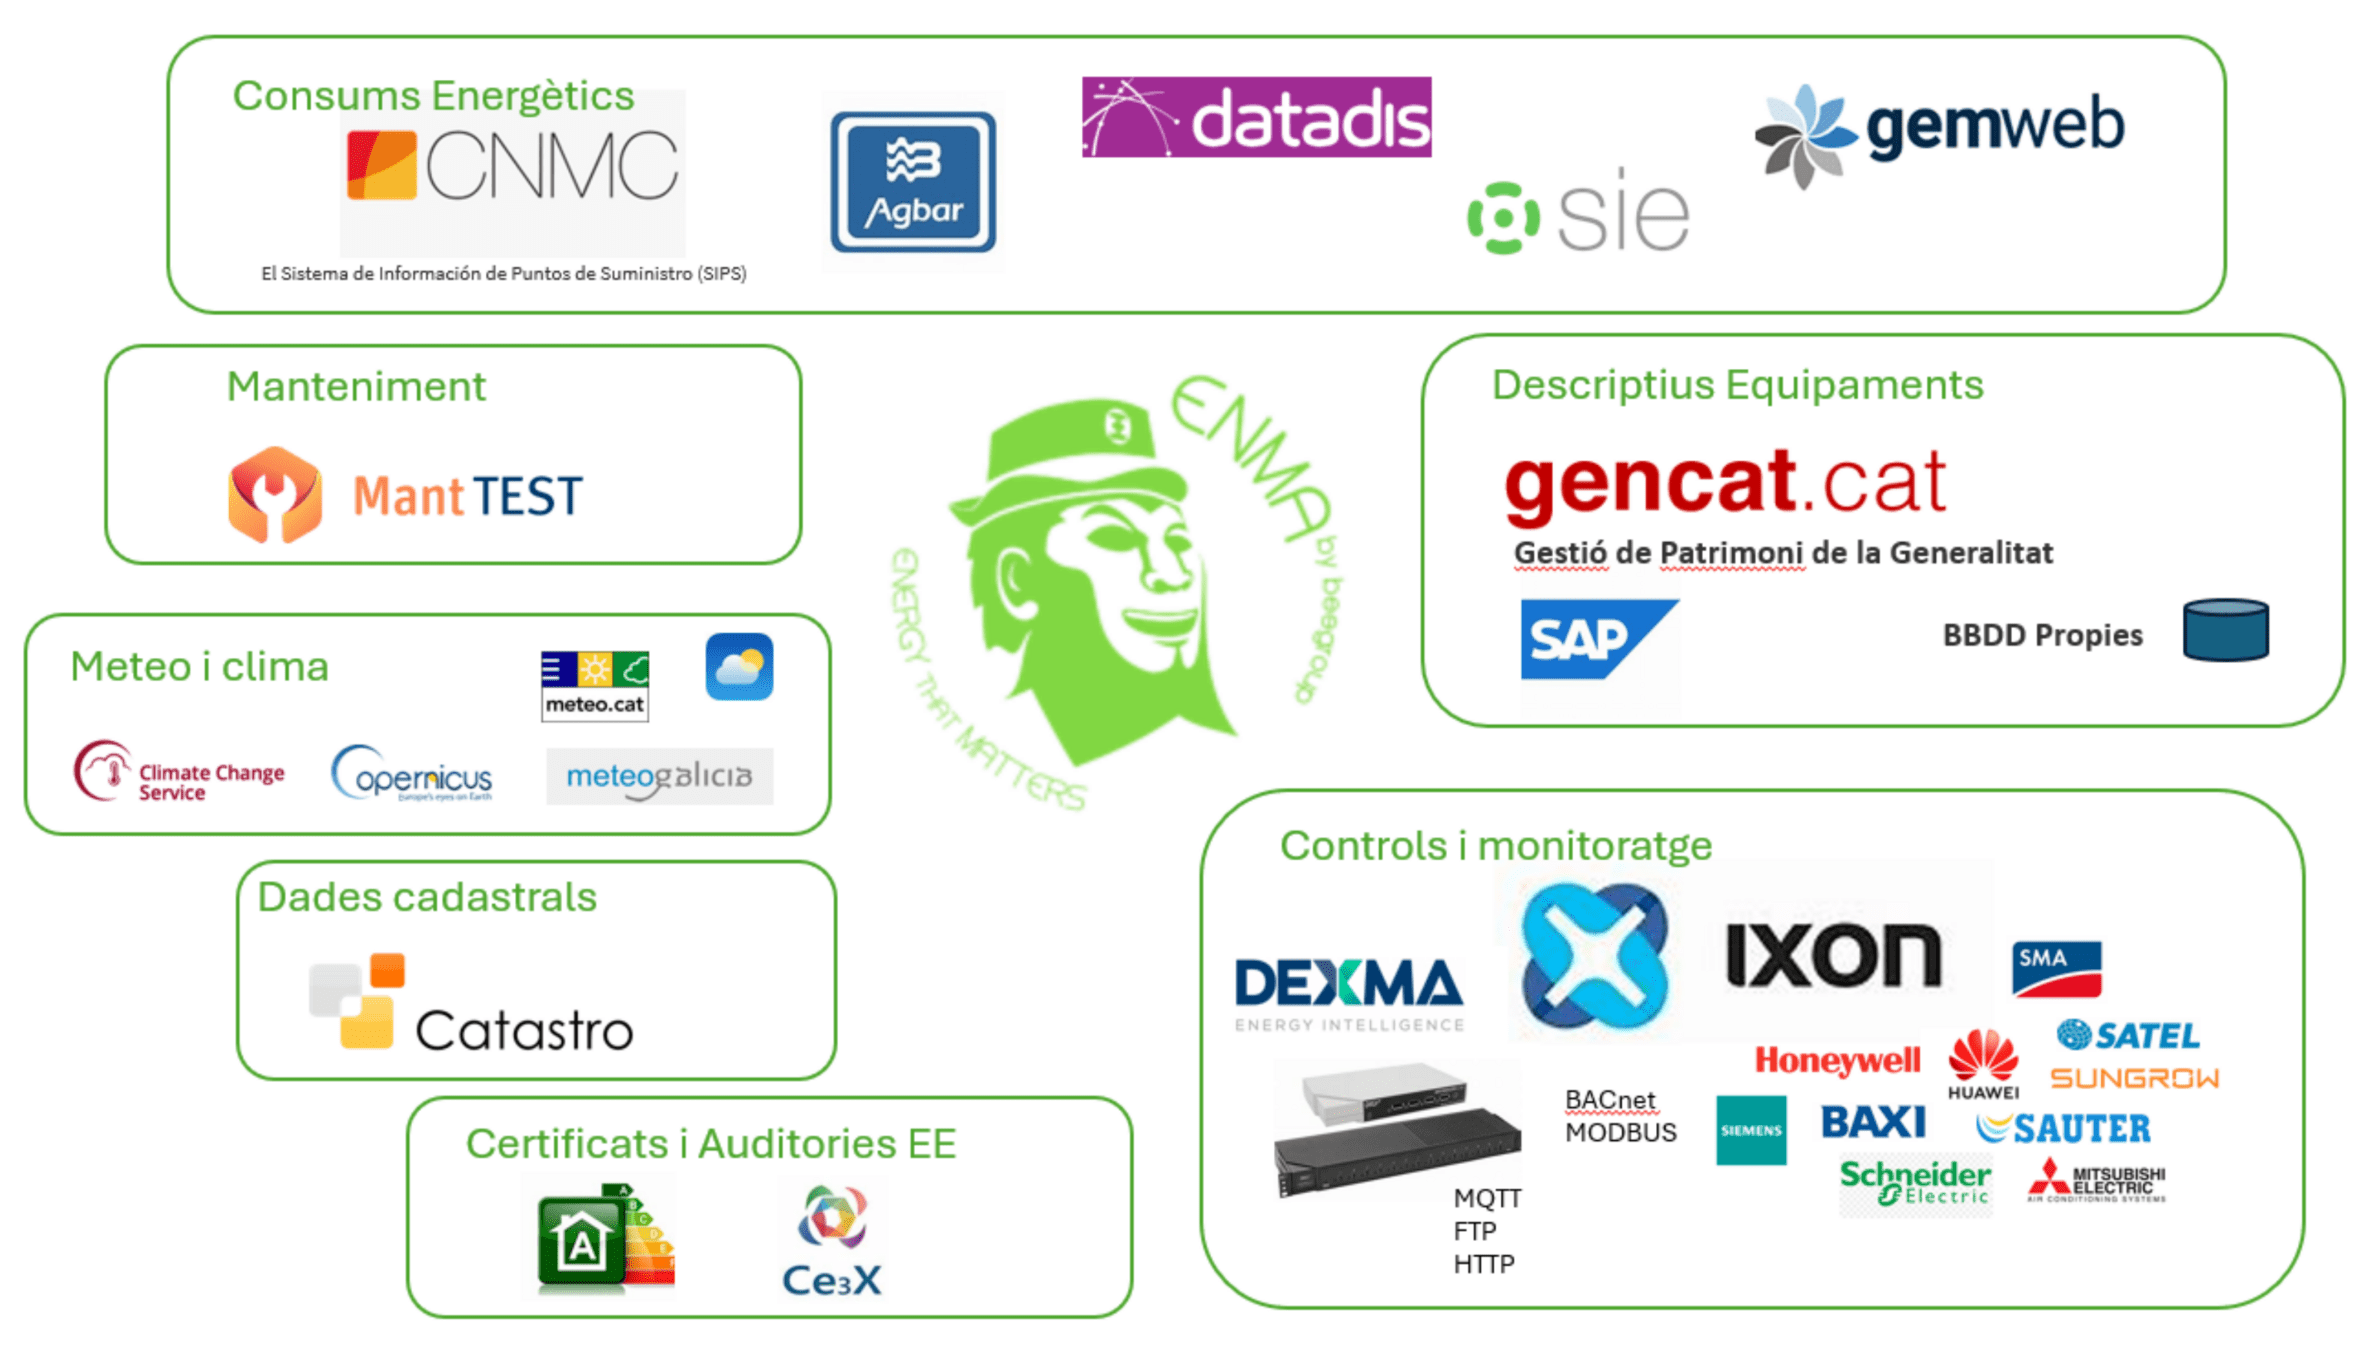
BEEMind-ENMA
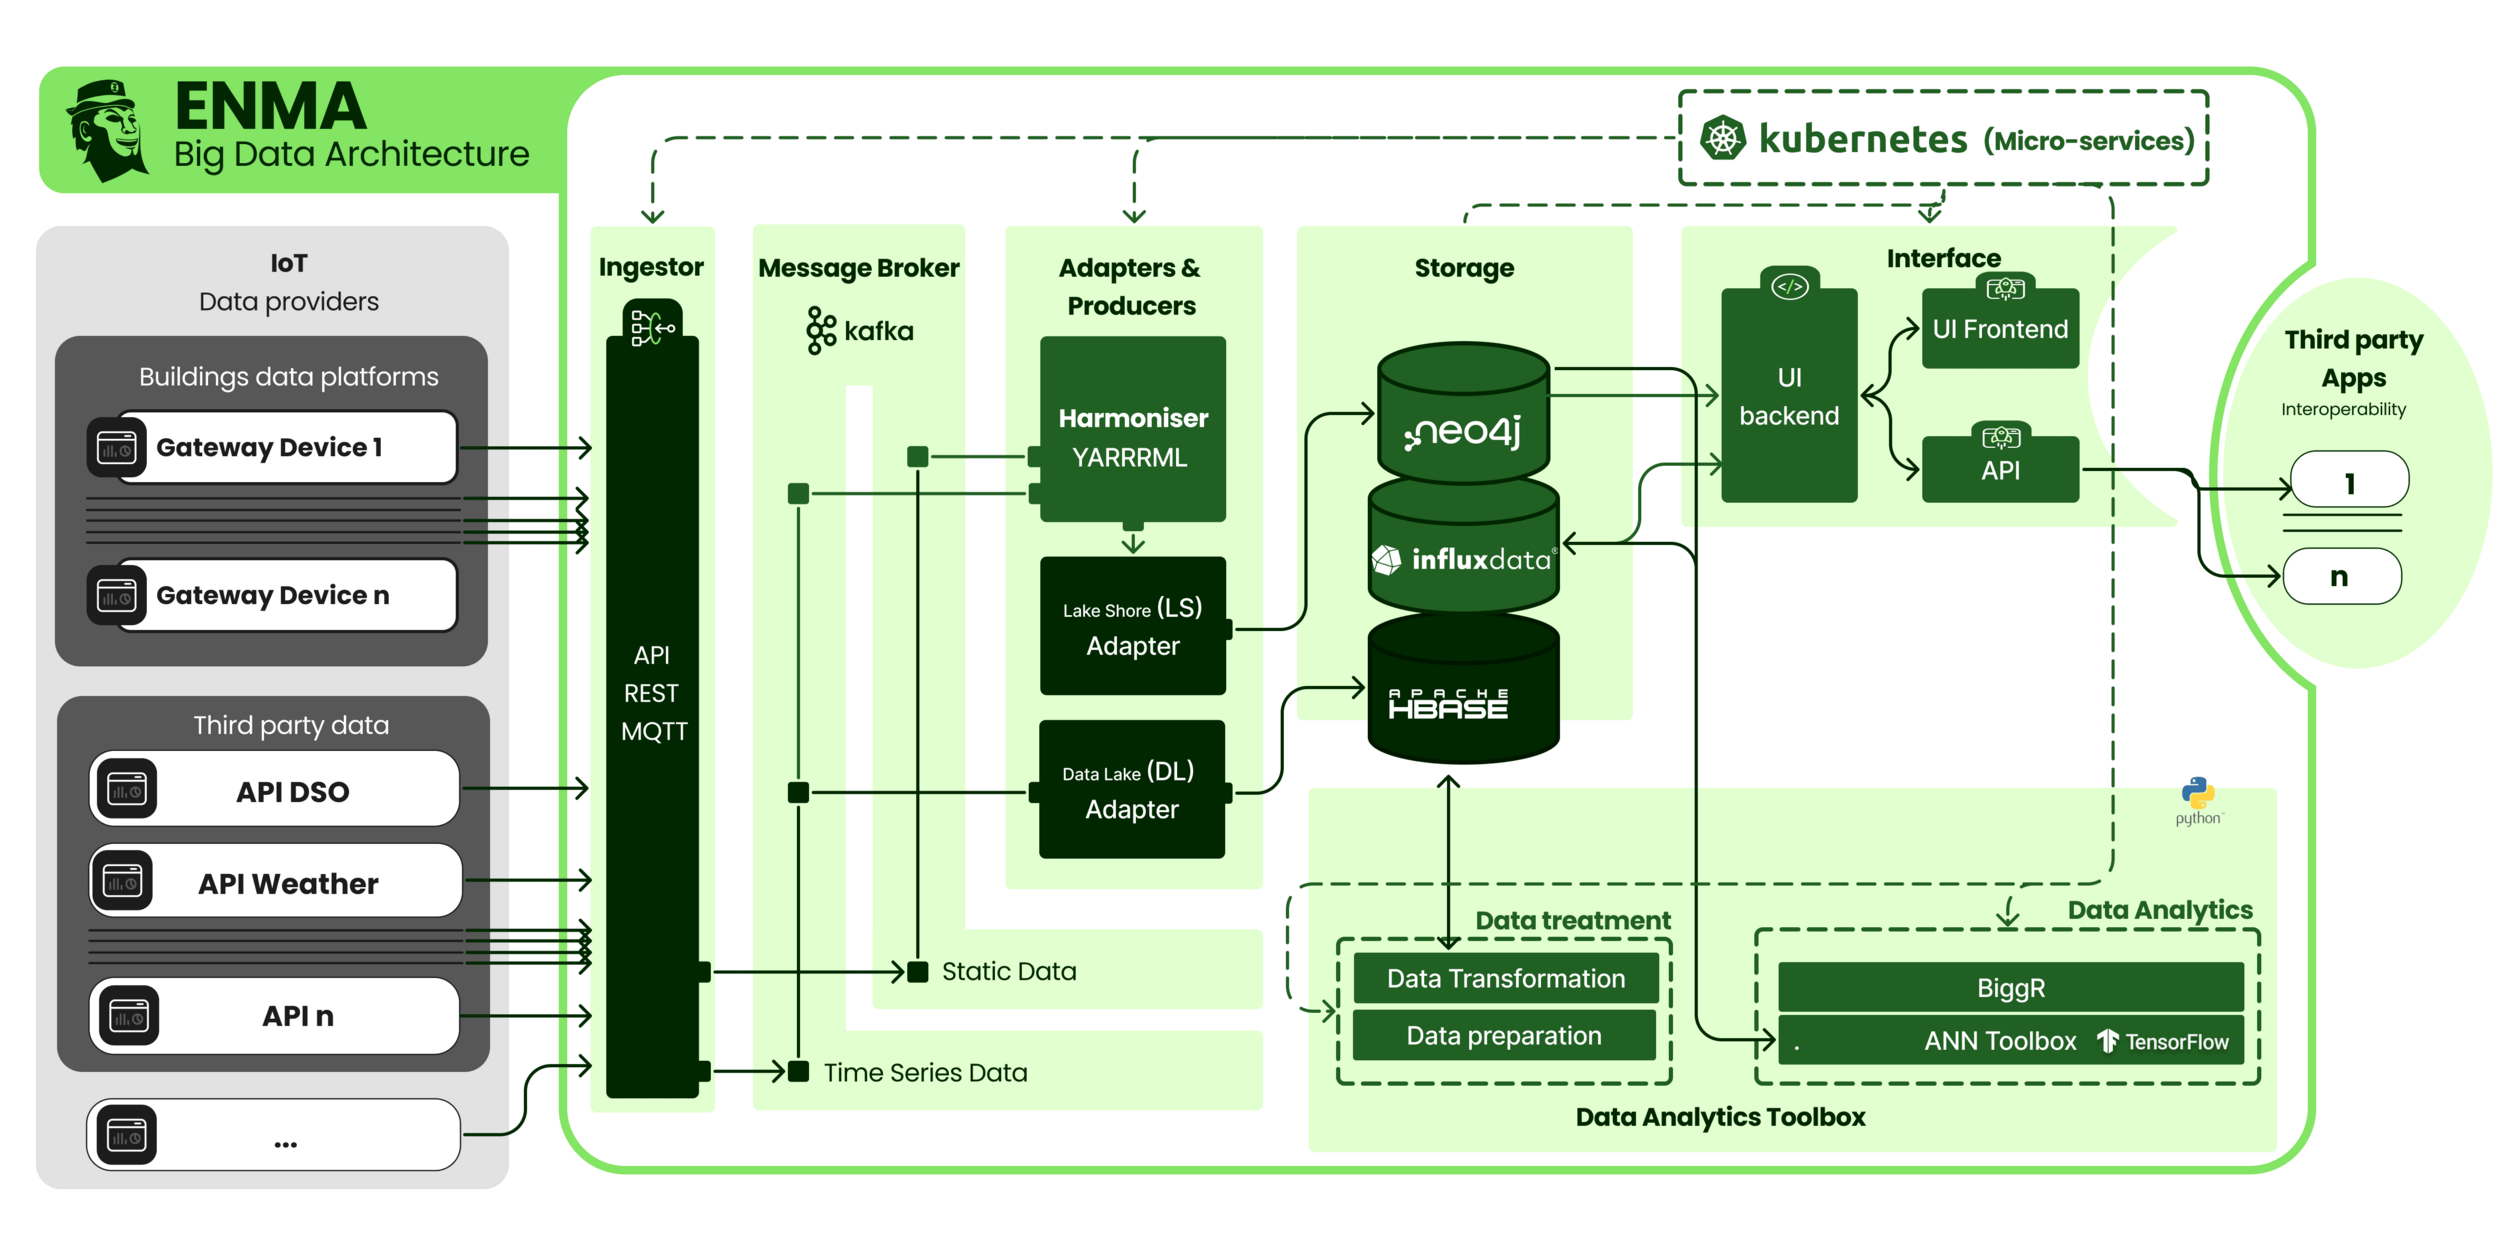
big data integration
Ingestion
Harmonization
ENMA architecture
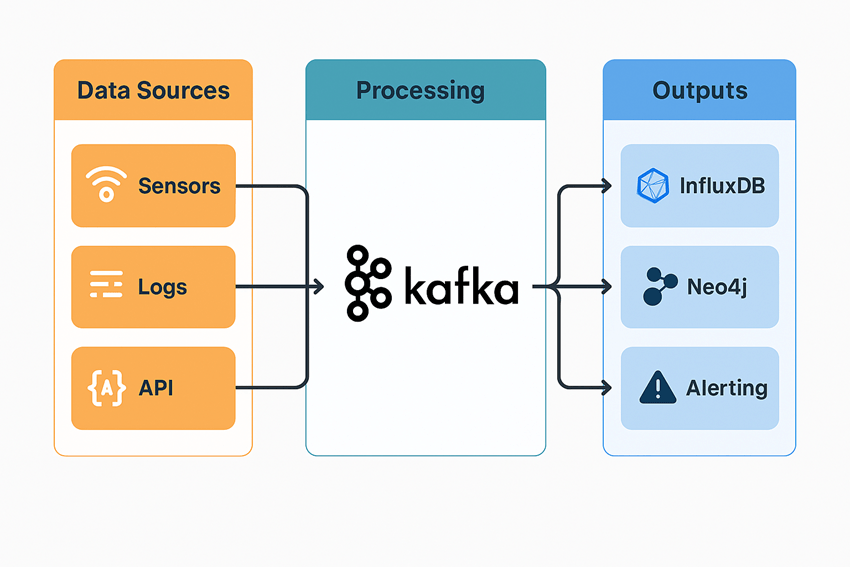
ENMA is an open-source big data architecture developed by CIMNE.

-
Real-time data ingestion from sensors, meters, and external platforms (API-REST, MQTT, Kafka)
-
Standardization and semantic harmonization using W3C ontologies (BIGG)
-
Advanced analysis using AI and machine learning models
-
Visualization and export through public and private APIs
What is it?
What does it do?
Applied uses
Enables the collection, harmonization, and intelligent analysis of large volumes of heterogeneous data for
Offers services in the city of Barcelona and in 10,000 buildings of the Generalitat de Catalunya.
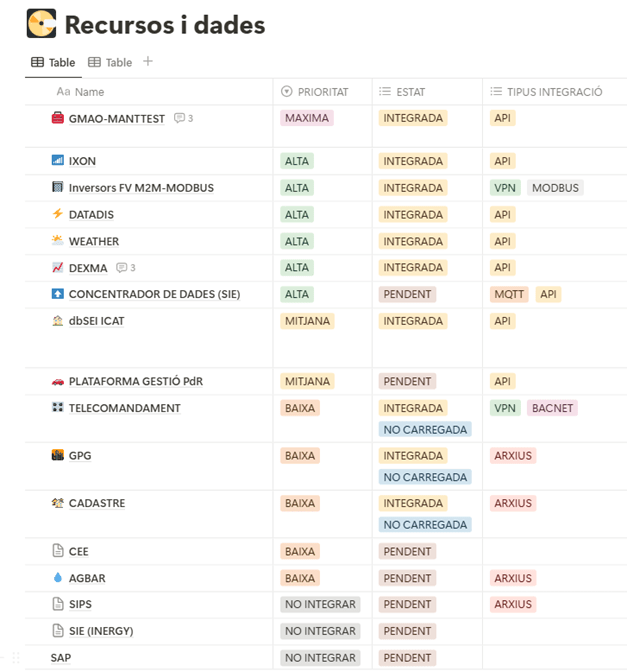
big data architecture
Ingestion
Massive data integration
ENMA in action
Ingestion processes
BEEMind: Data ingestion
- Executed manually or periodically
- Reading from websites, files, external databases, or APIs.
- Implemented using Python scripts.
Dades socio-econòmiques


Dades urbanes obertes


Actualització continua dels datasets
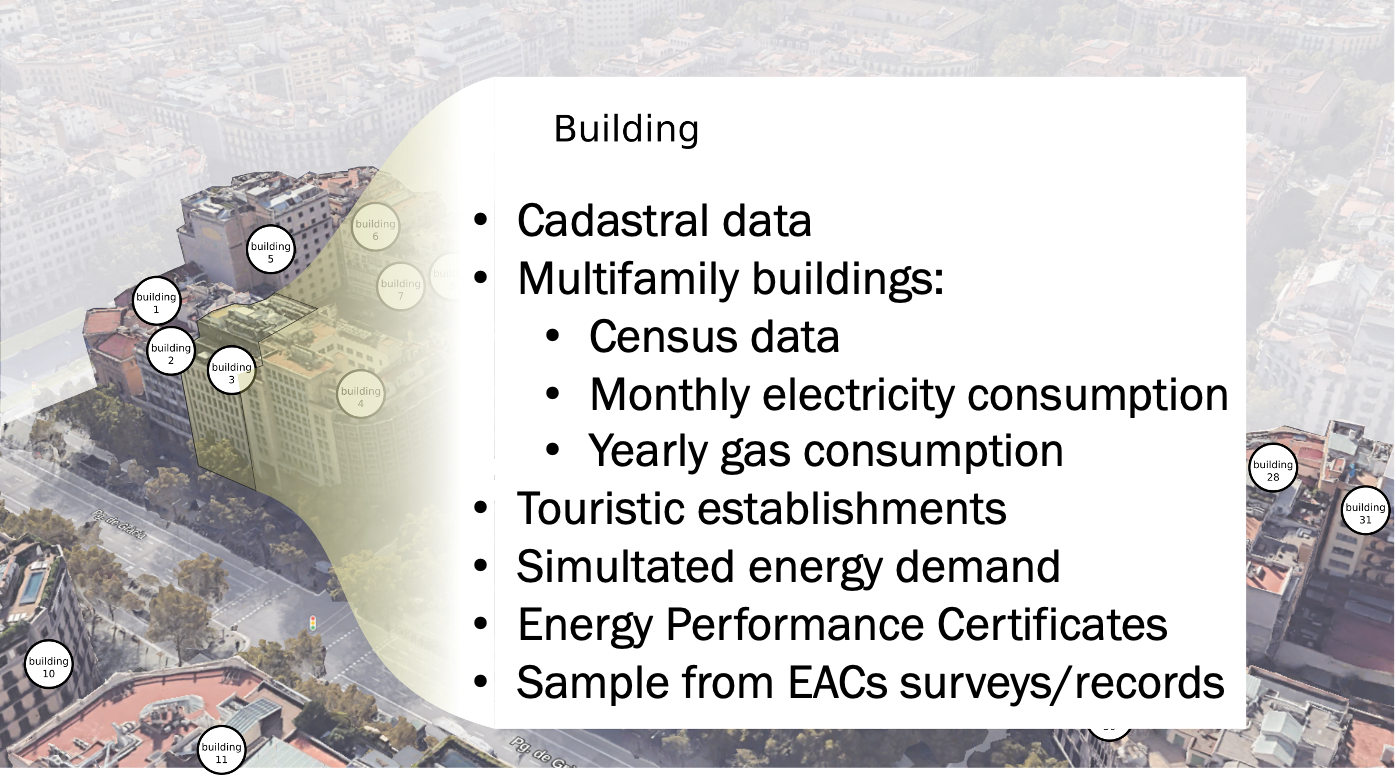
-
Cadastral (INSPIRE + CAT Files)
-
Energy Efficiency Certificates
-
Electricity and gas consumption (Annual per building, hourly by postal code)
-
Meteorological data (Historical, forecasts)
-
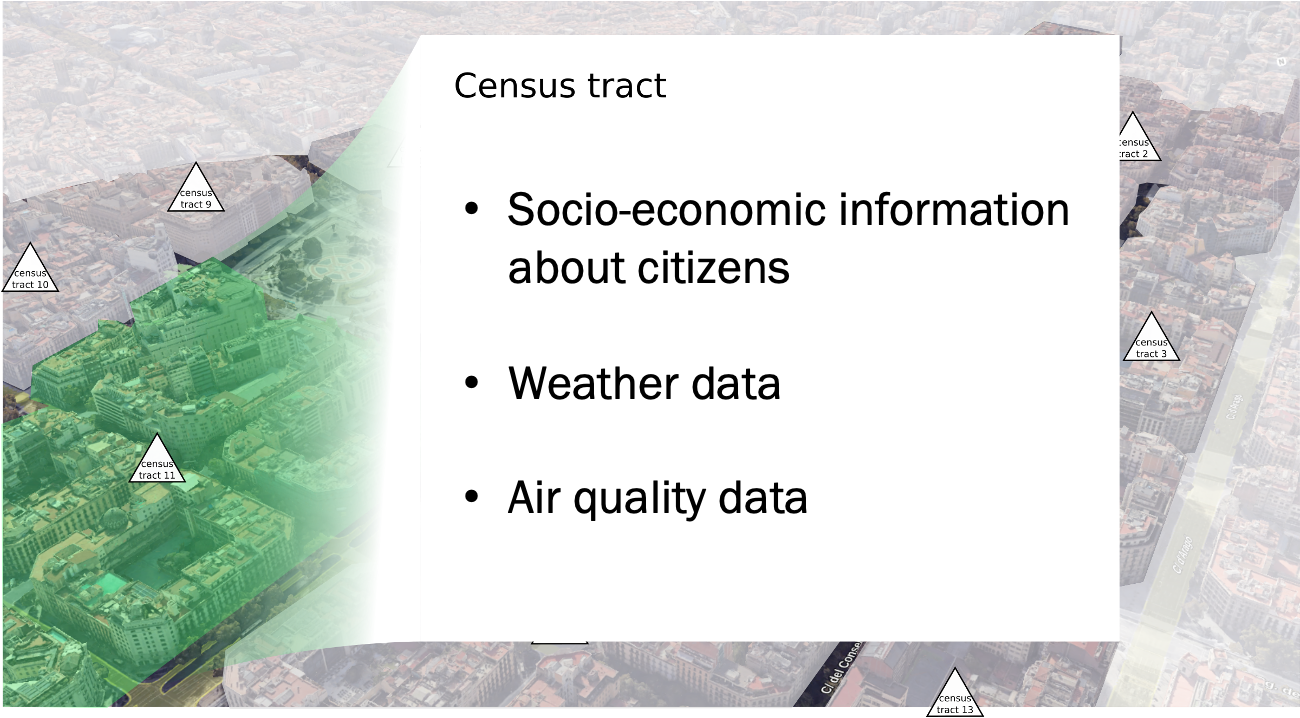
Socioeconomic indicators (Census, income atlases...)
-
Climate shelters
-
Administrative layers
-
Vegetation indices
-
Tourism-related establishments
-
Mortality and morbidity due to extreme heat events
MindCity: Data sources

MindCity: Data ingestion
Massive data integration
-
IoT sensors via Modbus and BACNET protocols
-
Data from renewable generation systems (PV)
-
Satellite meteorological data
-
Real-time energy consumption
-
Maintenance data (CMMS)
-
Integration with SCADA data sources
-
Cadastral data
-
Data from official inventories

Integració massiva de dades
MindOpera: Data sets used
MindOpera: Data ingestion and integration
Data harmonization
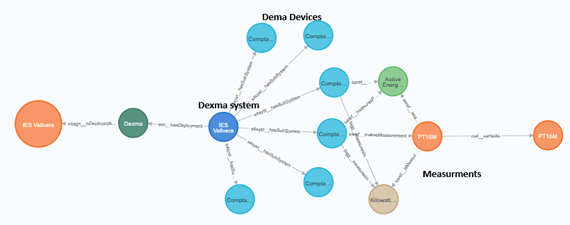
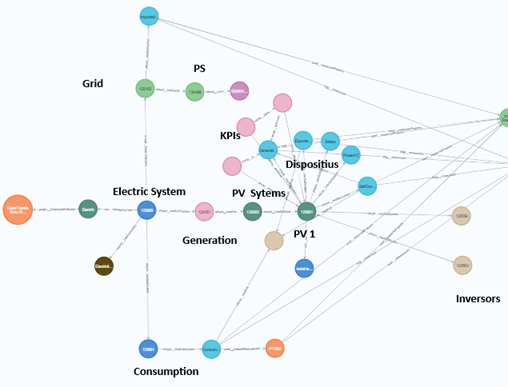
BEEMind: Data ontology
The ontology at the core of our solutions
Applied semantic web technologies:
Understanding and organizing data is as important as the algorithms themselves
Massive data integration
BIGG: l'ontologia de dades que enllaça des de sensors a carrers
Reuse
-
saref, s4blg, s4city, s4agri:
- buildings, devices
-
ssn:
- systems, deployments
-
geosp:
- geolocation
-
qudt:
- units
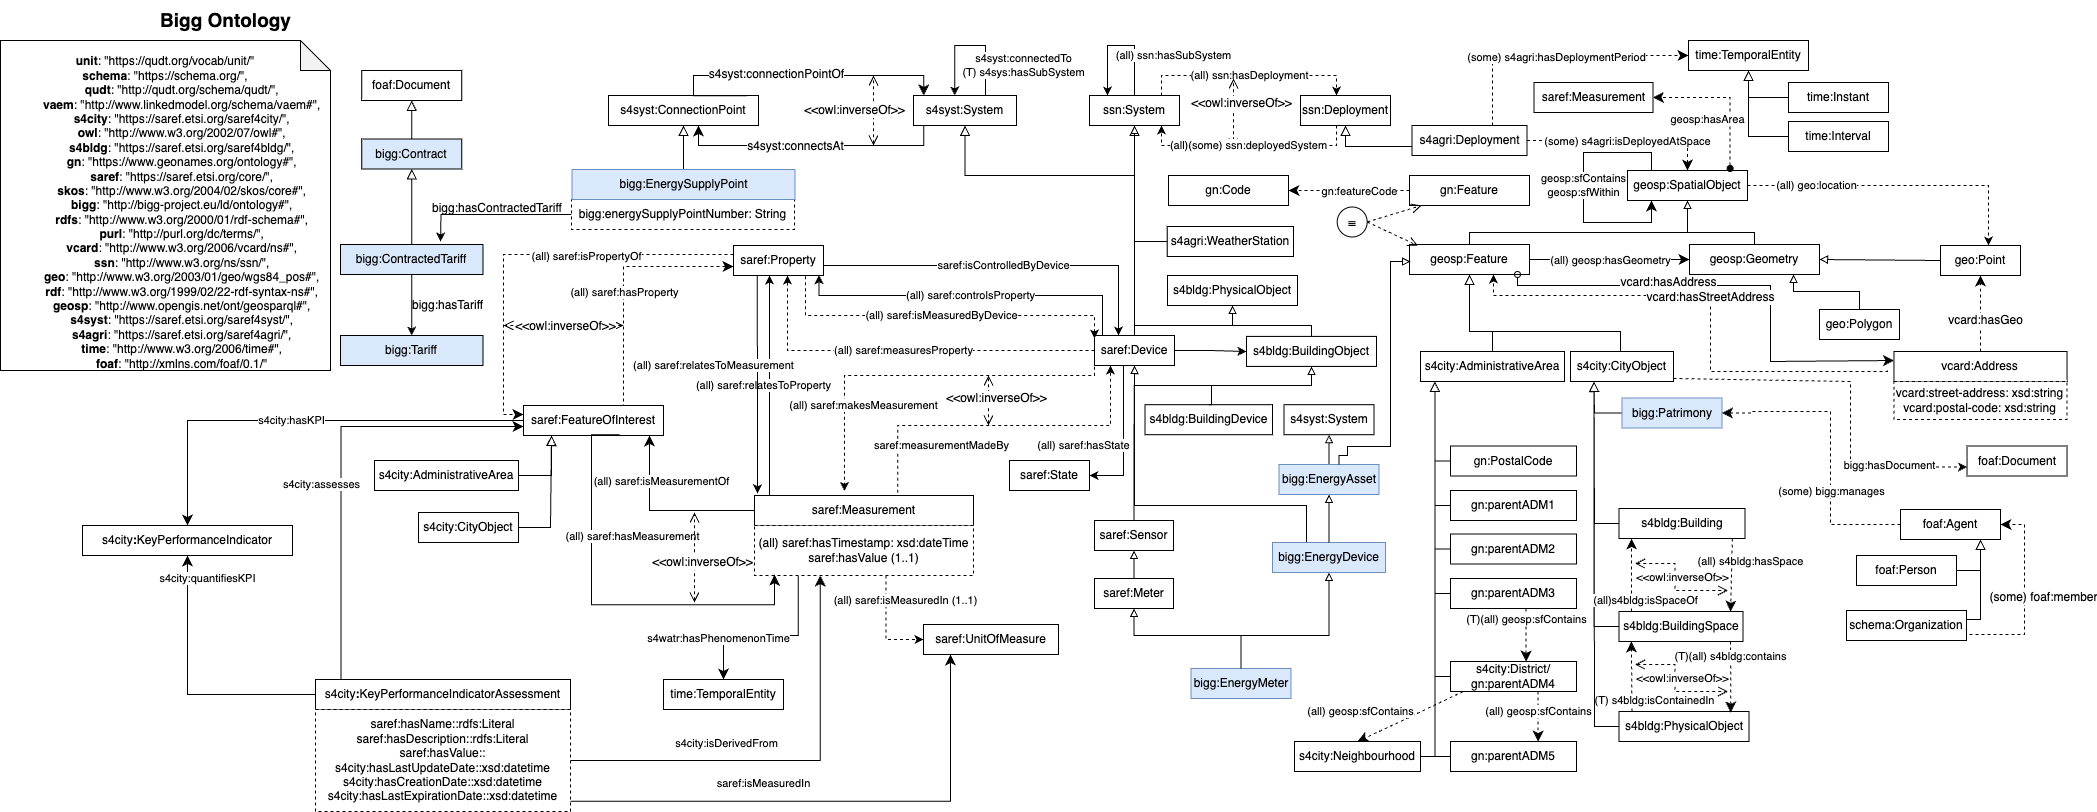
BEEMind: Data ontology
BIGG: the common data ontology
Case studies: iCAT, ICAEN, Aj.Barcelona
The Orchestrator of Infraestructures.cat
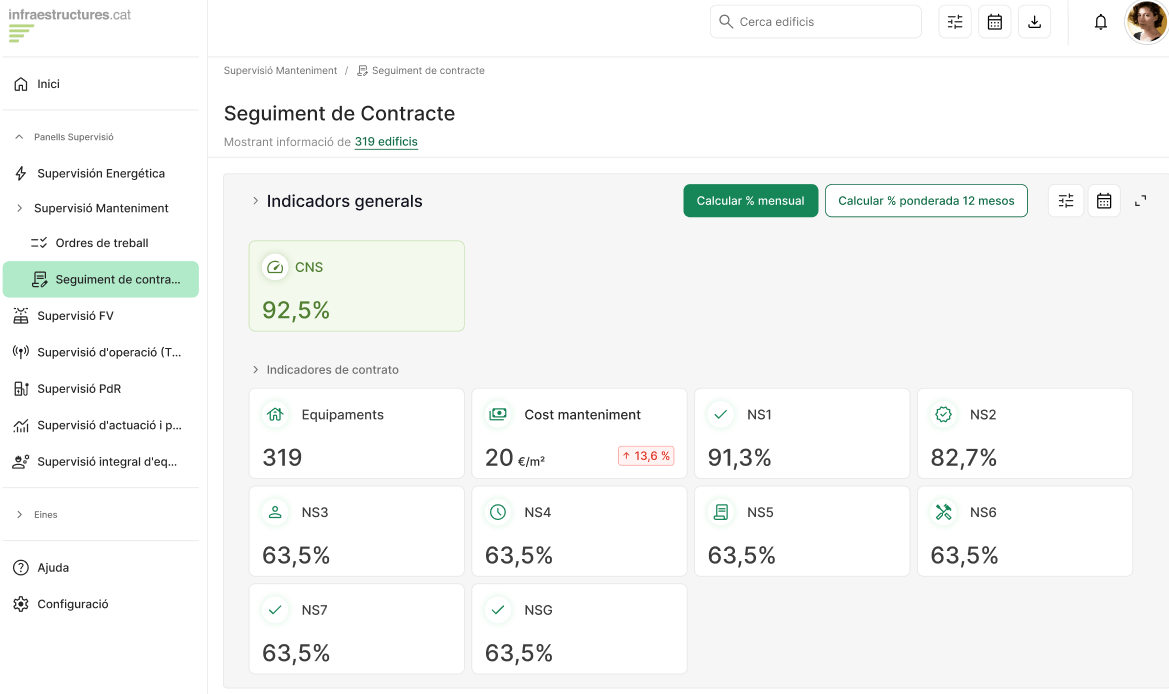
MindOpera: Data Orchestrator
Deploy a data orchestration infrastructure for public buildings with monitoring and remote-control systems, integrating structural, operational, and energy data.
Infraestructures.cat
Integrator of all equipment data under the direct management of Infraestructures.cat:
-
Real-time data for optimal operation of hundreds of buildings
-
Data provision to diferent internal and external actors. (Energy department, Maintenace department, clients, etc)
-
Predictive maintenance, anomaly detection, consumption and generation forecasting
- Infraestructures.cat
- CIMNE-BEE Group
Actions
Goals
Main actors
Some KPI
Infraestructures.cat
MindOpera currently supports an ecosystem of over 10,000 equipments, including:
1,000 with structured maintenance data,
Over 40,000 zones and 100,000 digital assets,
More than 1 million work orders processed.
It integrates data from over 250,000 IoT devices via protocols such as Modbus and BACnet, collecting real-time information from building control systems.
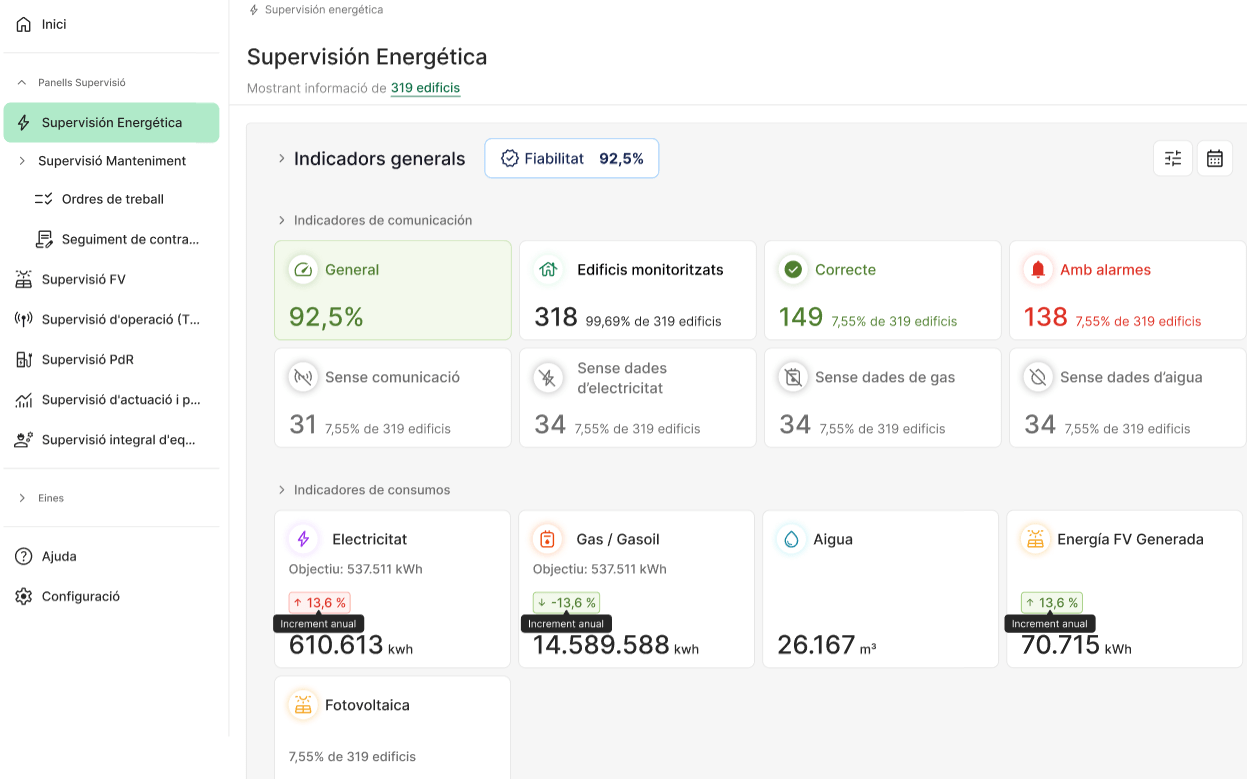
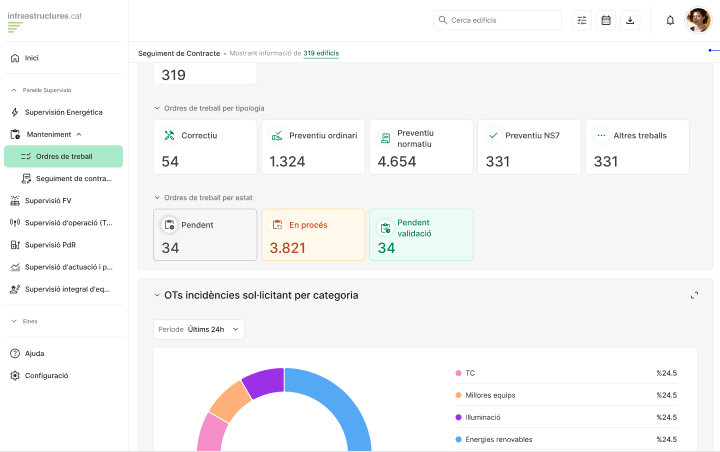
Dashboard administració
MindOpera: Data Orchestrator
MindOpera: Data Orchestrator
Infraestructures.cat
Tecnology used
This project uses ENMA as the basic infrastructure for BEEMind:
-
Kubernetes enables the management and scalability of deployed services, ensuring high availability and efficient application execution.
-
Apache Kafka serves as a distributed messaging platform, enabling reliable and real-time transmission of large volumes of data between the system's components.
Direct management: Data control and analysis
The main processes are organized into four distinct stages:
A. Data collection
B. Data storage
C. Static harmonization
D. Time series processing
Model intellligence
-
Predictive maintenance
-
Generation forecasting
-
Predictive self-consumption balancing
MindOpera: Data Orchestrator
Tool

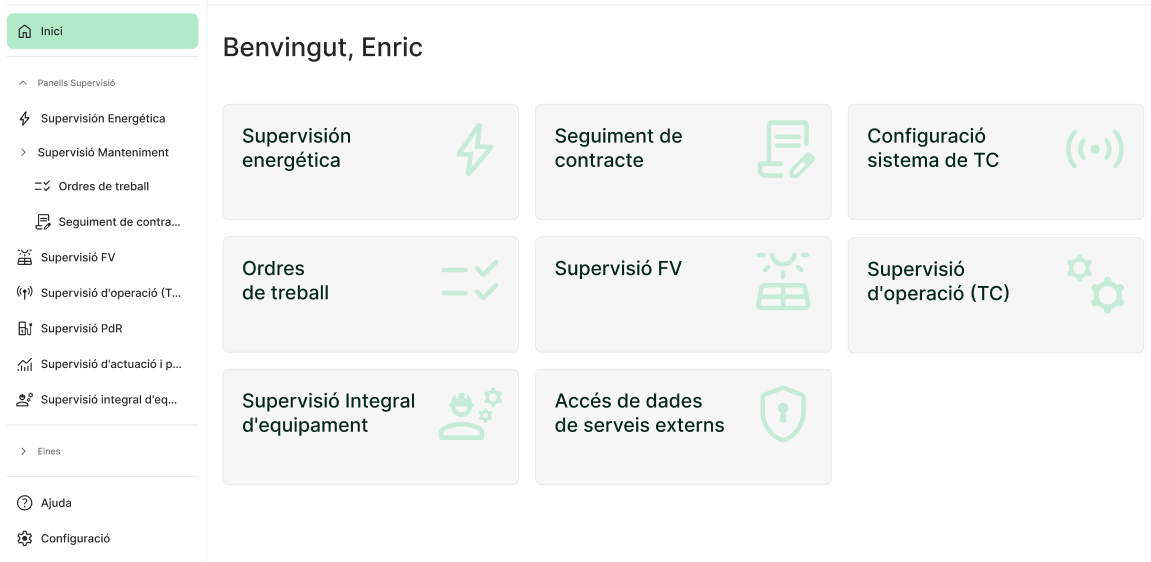
Home
Admin Dashboard
MindOpera: Data Orchestrator
The tool
Monitoring: Tracking KPIs
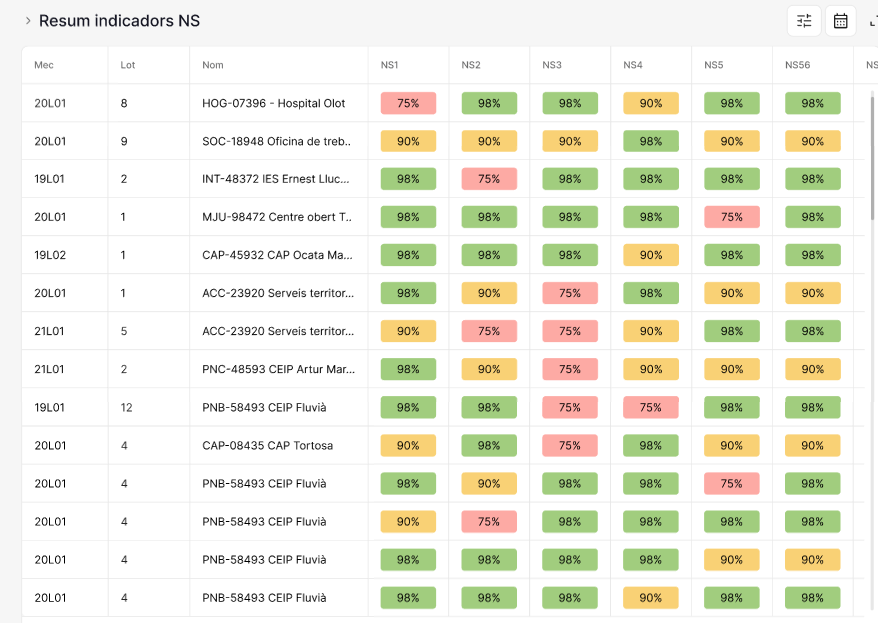
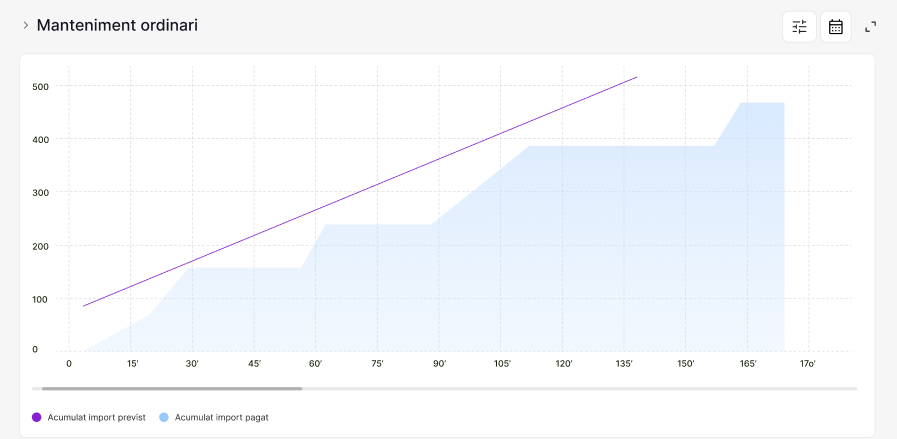
MindOpera: Data Orchestrator
Control and Maintenance
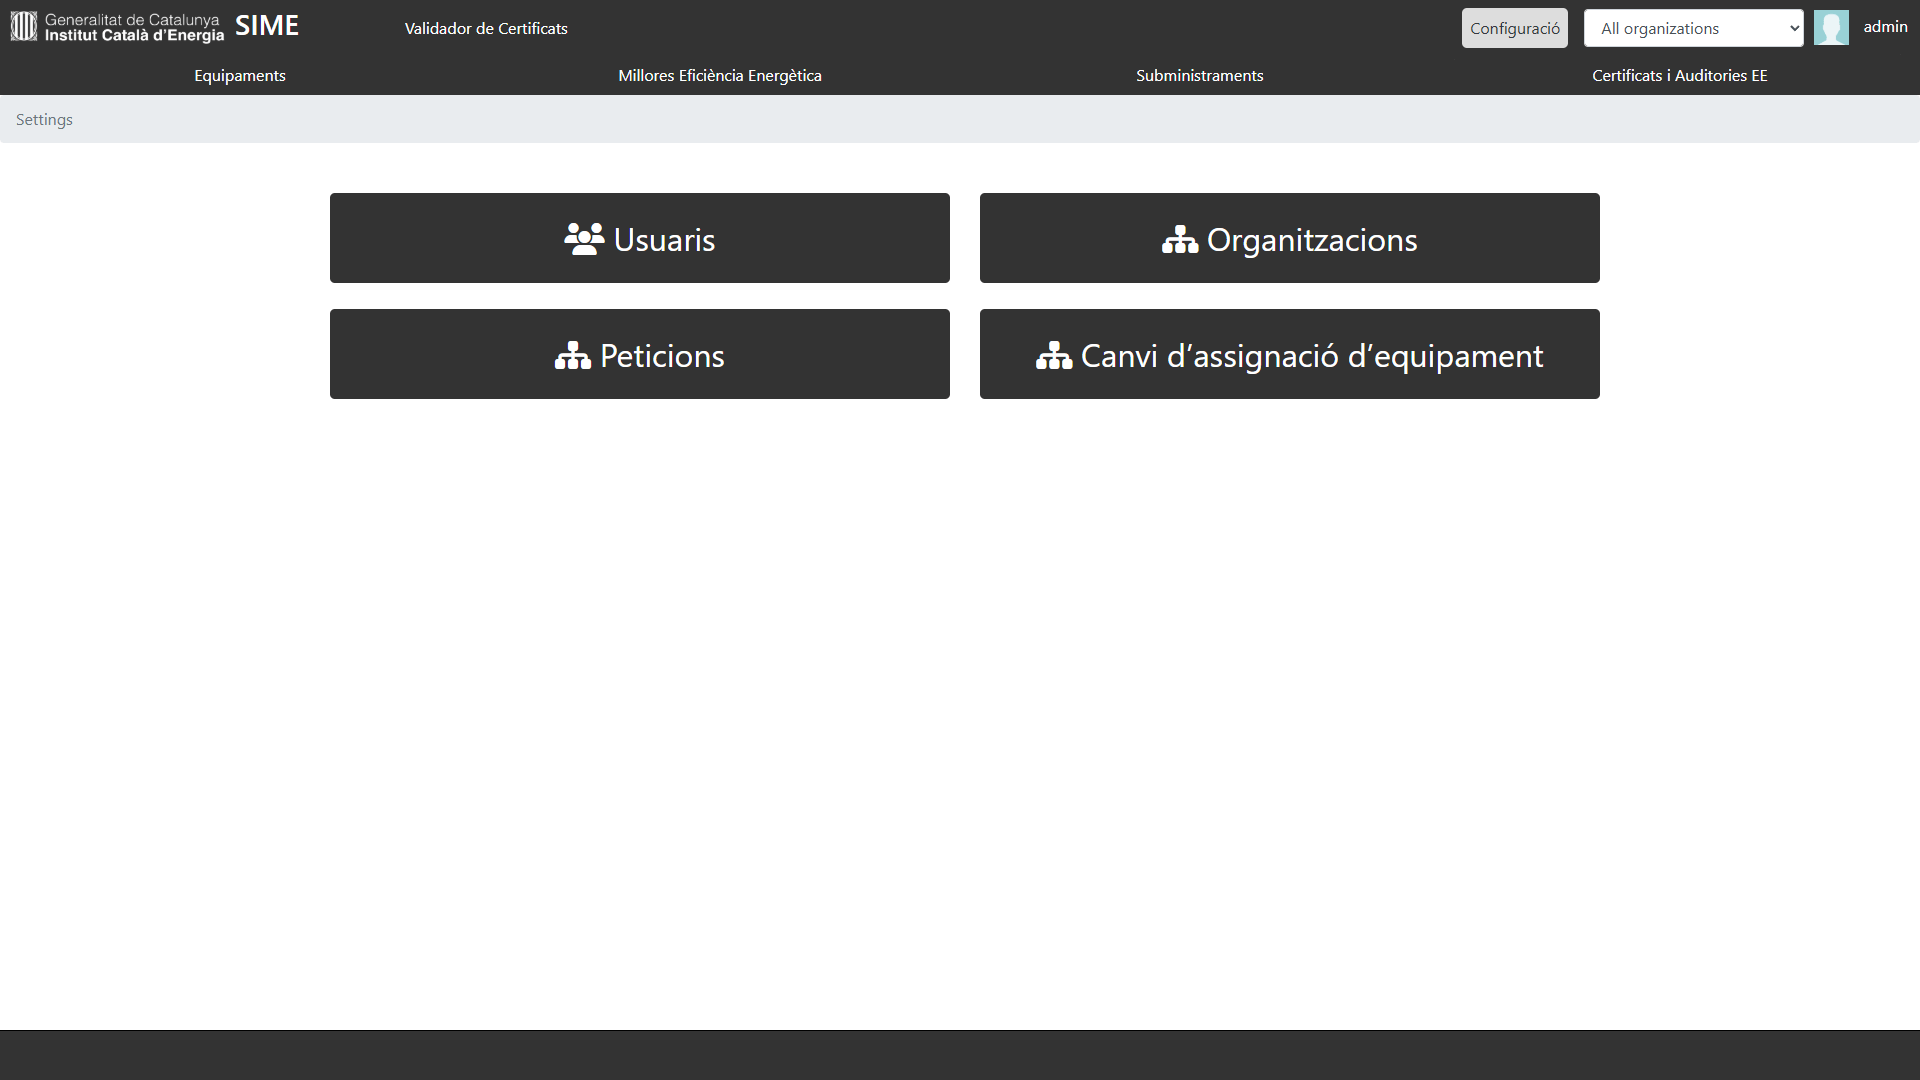
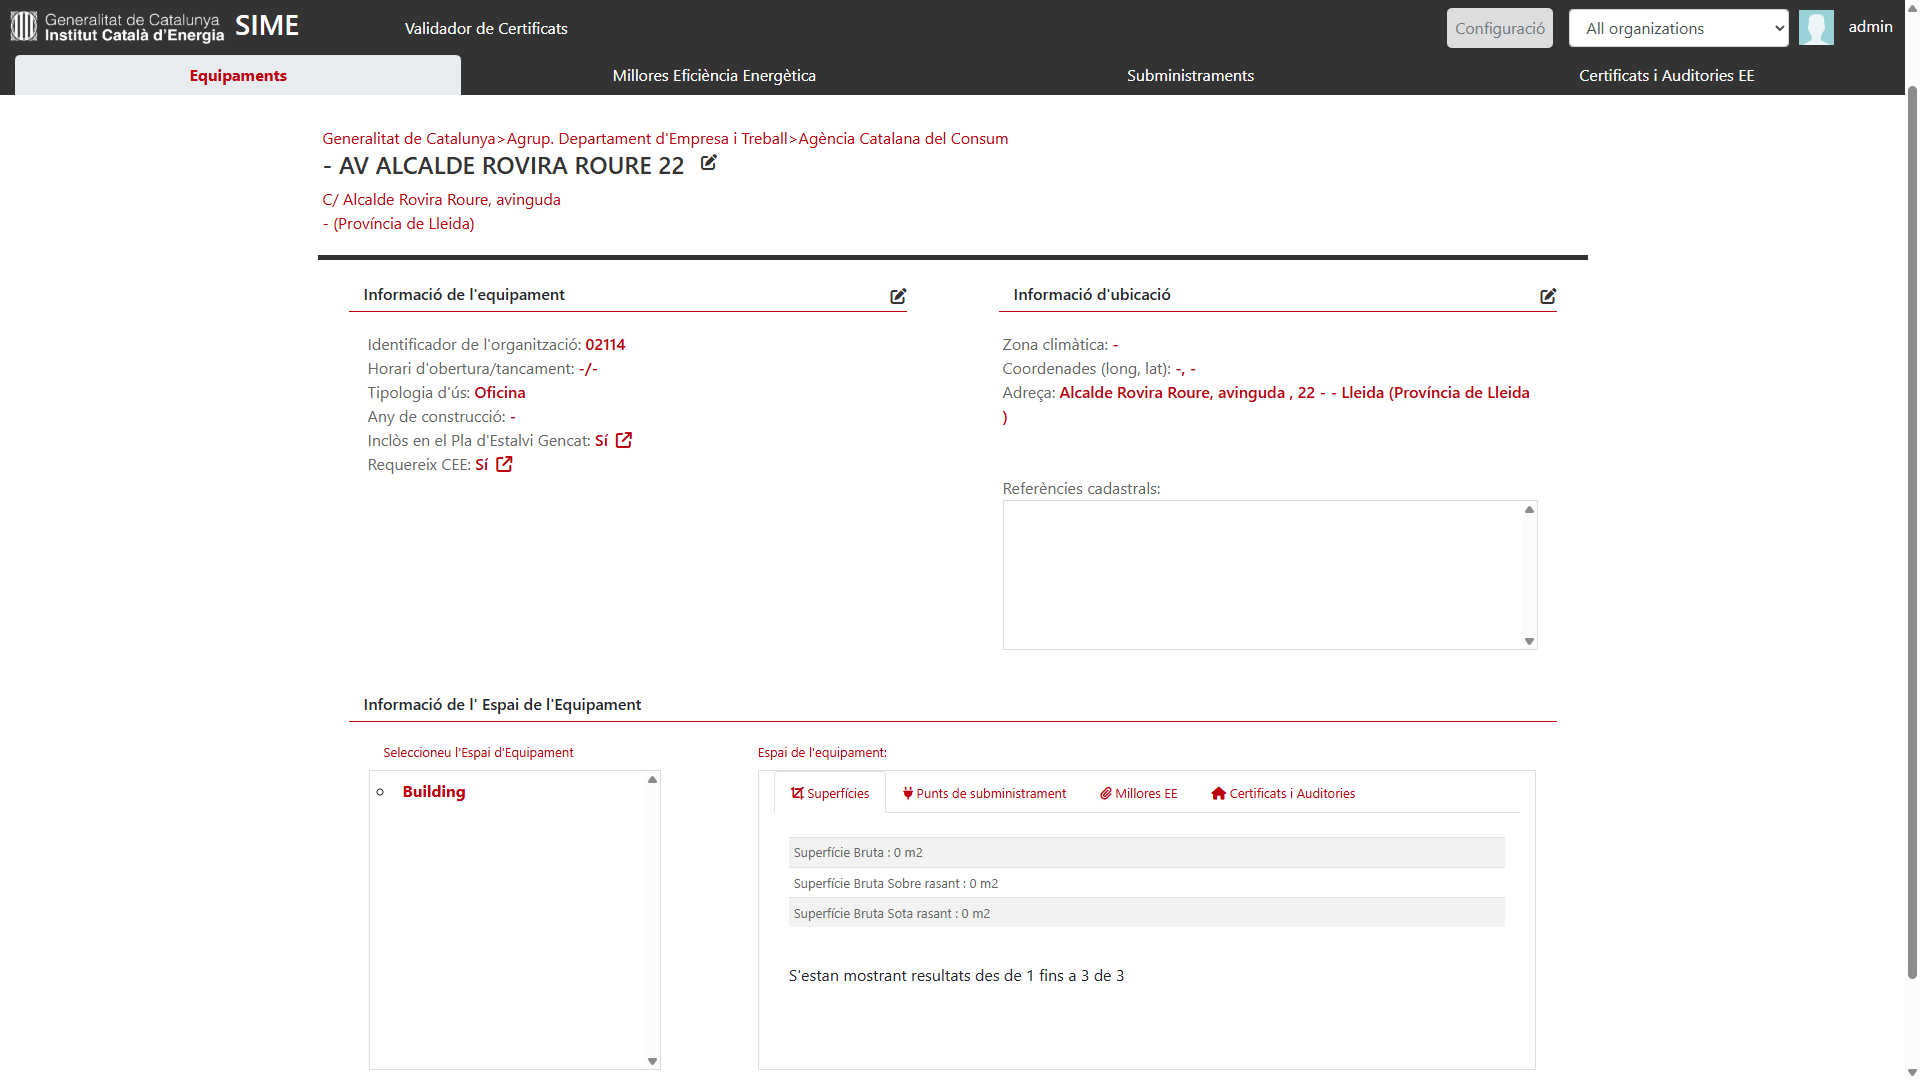
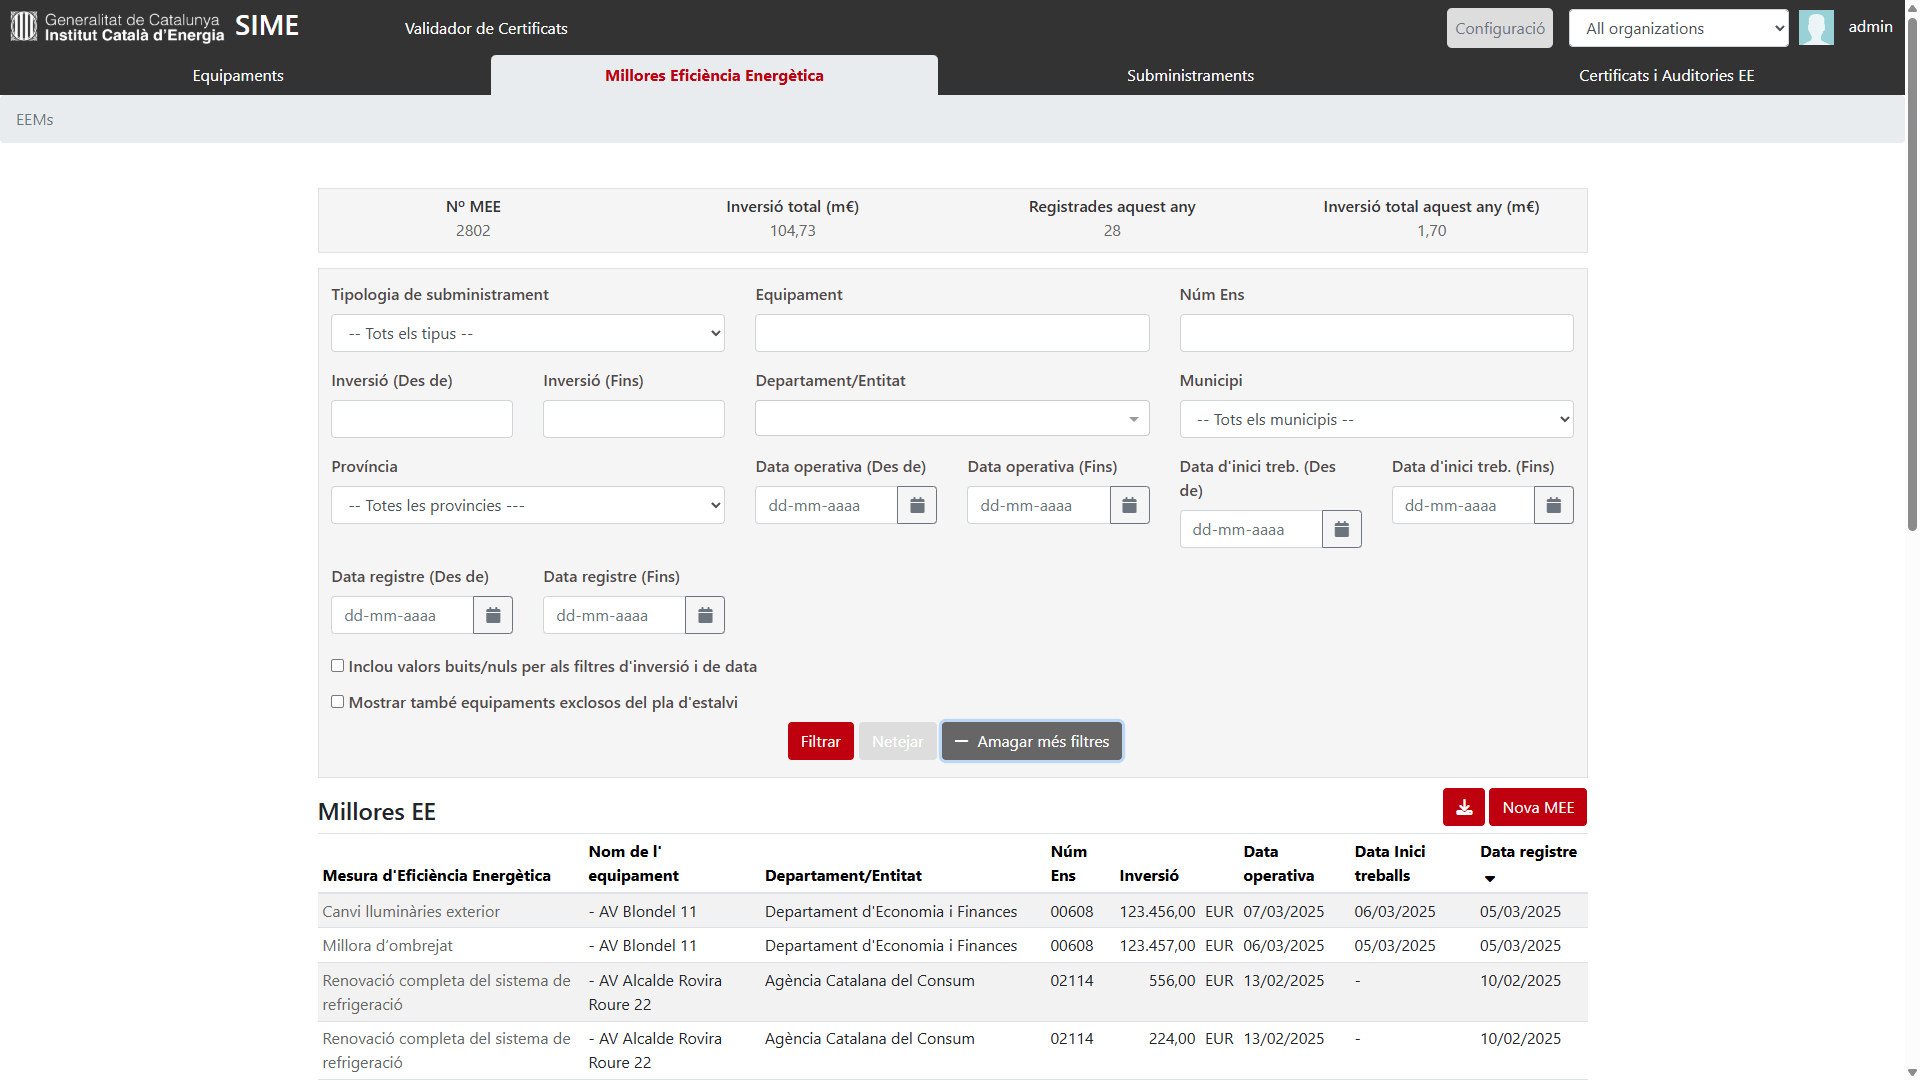
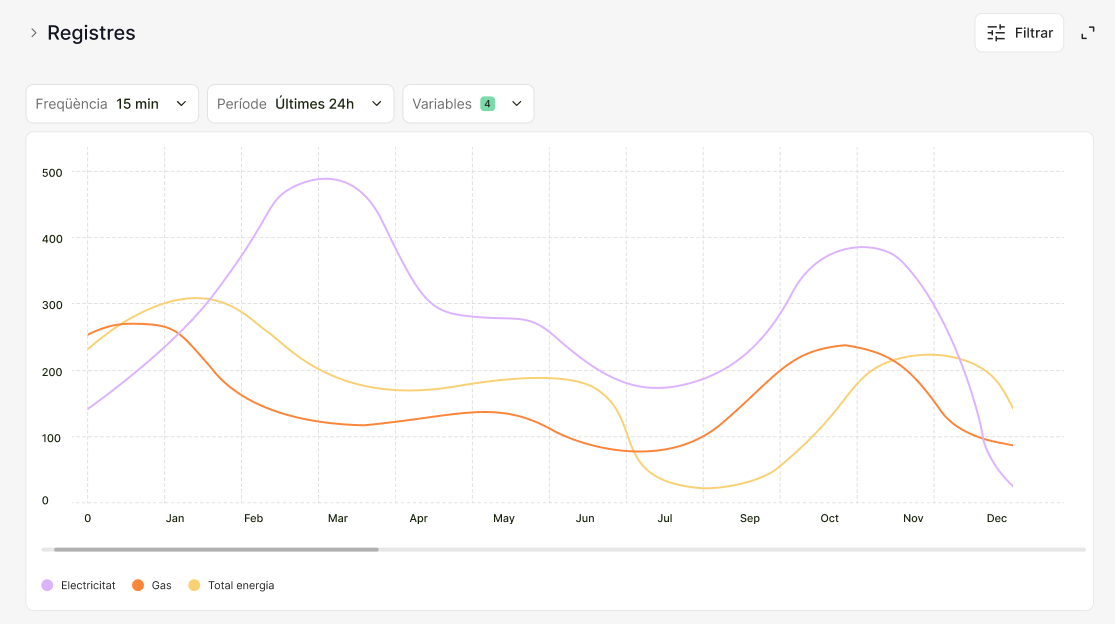
SIME-ICAEN
Integrate and visualize the energy data of all Generalitat facilities (10,000) and support energy savings through data intelligence:
-
Comparison of energy indicators
-
Evaluation of the energy performance of each facility
-
Verification of savings from Energy Efficiency Measures
-
Planning of energy efficiency actions
Institut Català d'Energia
The project
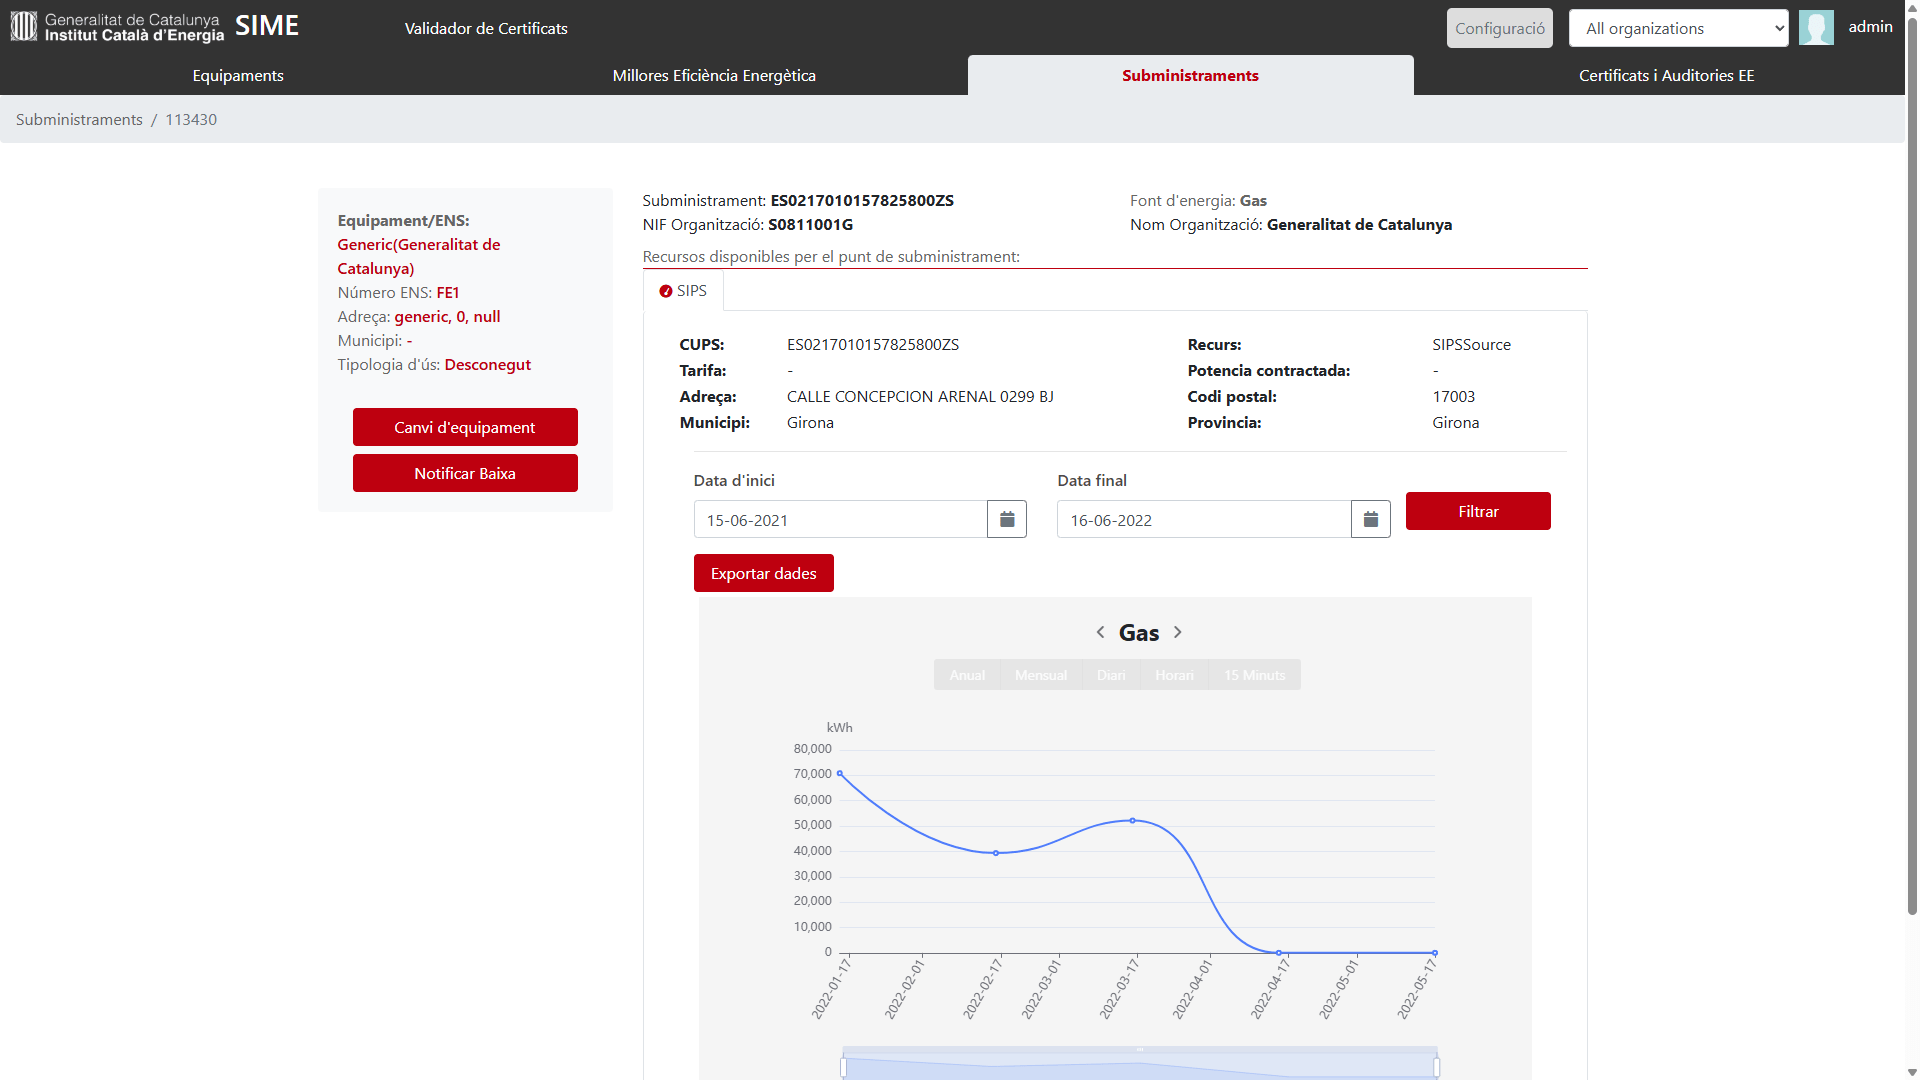
MindOpera: Energy Monitoring System – SIME
Seguiment i avaluació del Pla d’Estalvi Energètic dels edificis de la Generalitat de Catalunya.
Goals
Equipment supervision
Monitoring and control of supplies
Monitoring and
control of certificates and audits
Global energy supervision
Monitoring of energy efficiency measures
Monitoring of projects and actions
Data provision to external services
Data verification from different sources
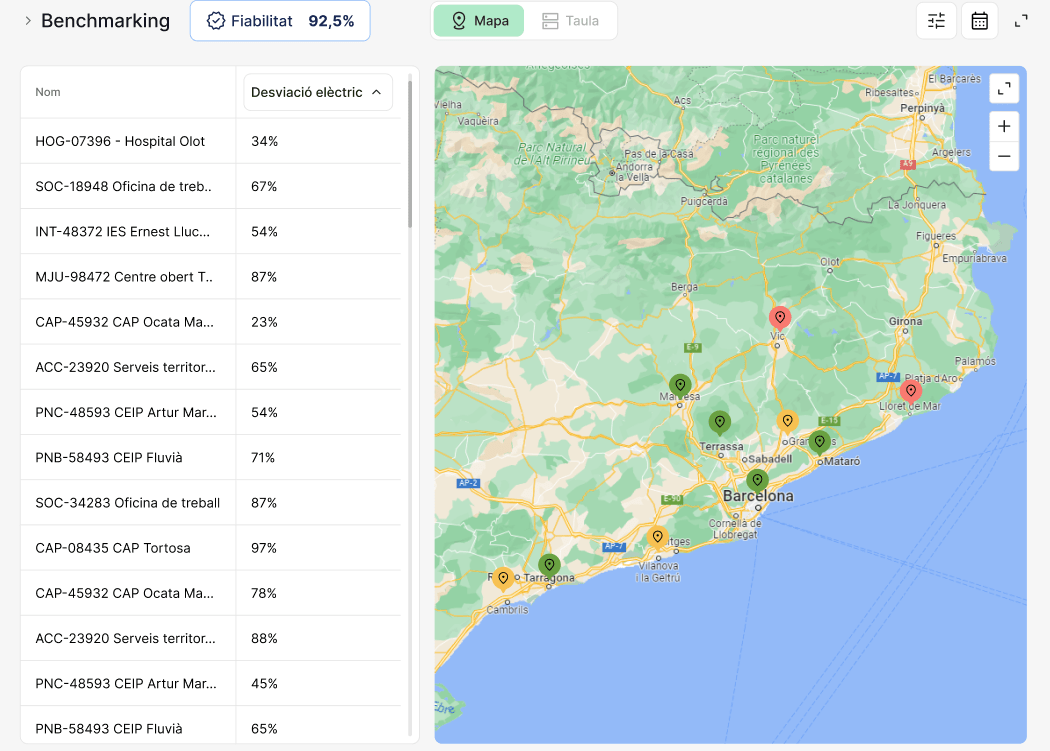
Massive comparison: Energy benchmarking
Institut Català d'Energia
MindOpera: SIME
Centralized management
Energy Analytics
Energy Efficiency Measures
Institut Català d'Energia
MindOpera: SIME
Applied model intelligence (1)
1. Longitudinal benchmarking
What does it do?
Analyzes a building’s energy performance over time to detect trends and assess sustained changes.
Data used:
-
Time series of energy consumption
-
Historical climate data
-
Information on intervention periods (Energy Efficiency Measures – EEMs)
Objectives:
-
Compare energy performance before and after an action
-
Detect changes in energy indicators of individual buildings over time
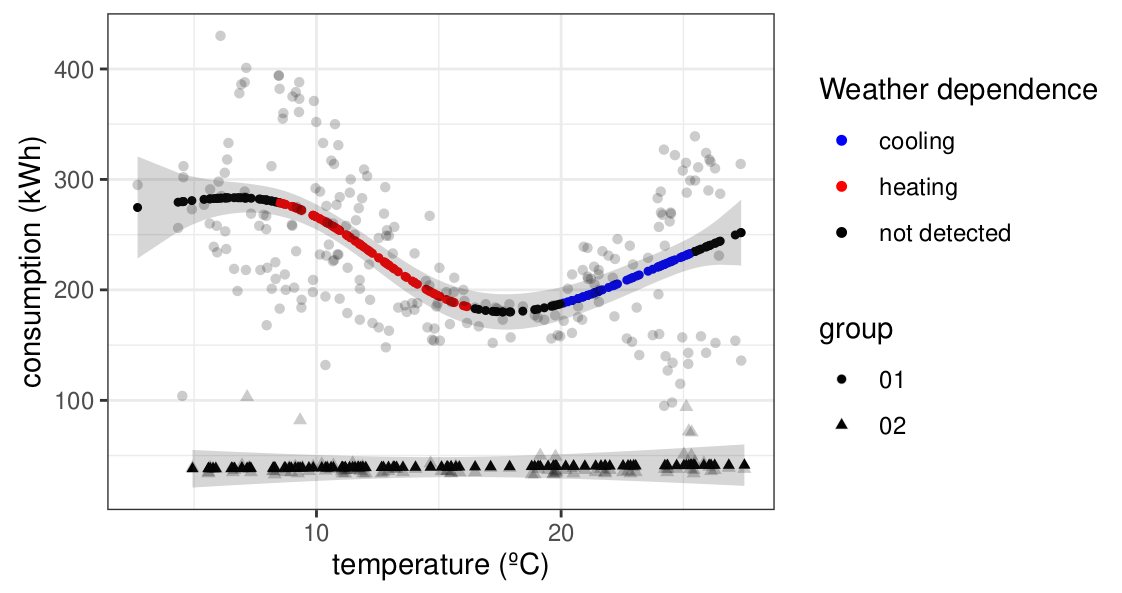
Estimation of the balance point temperature for heating and cooling periods
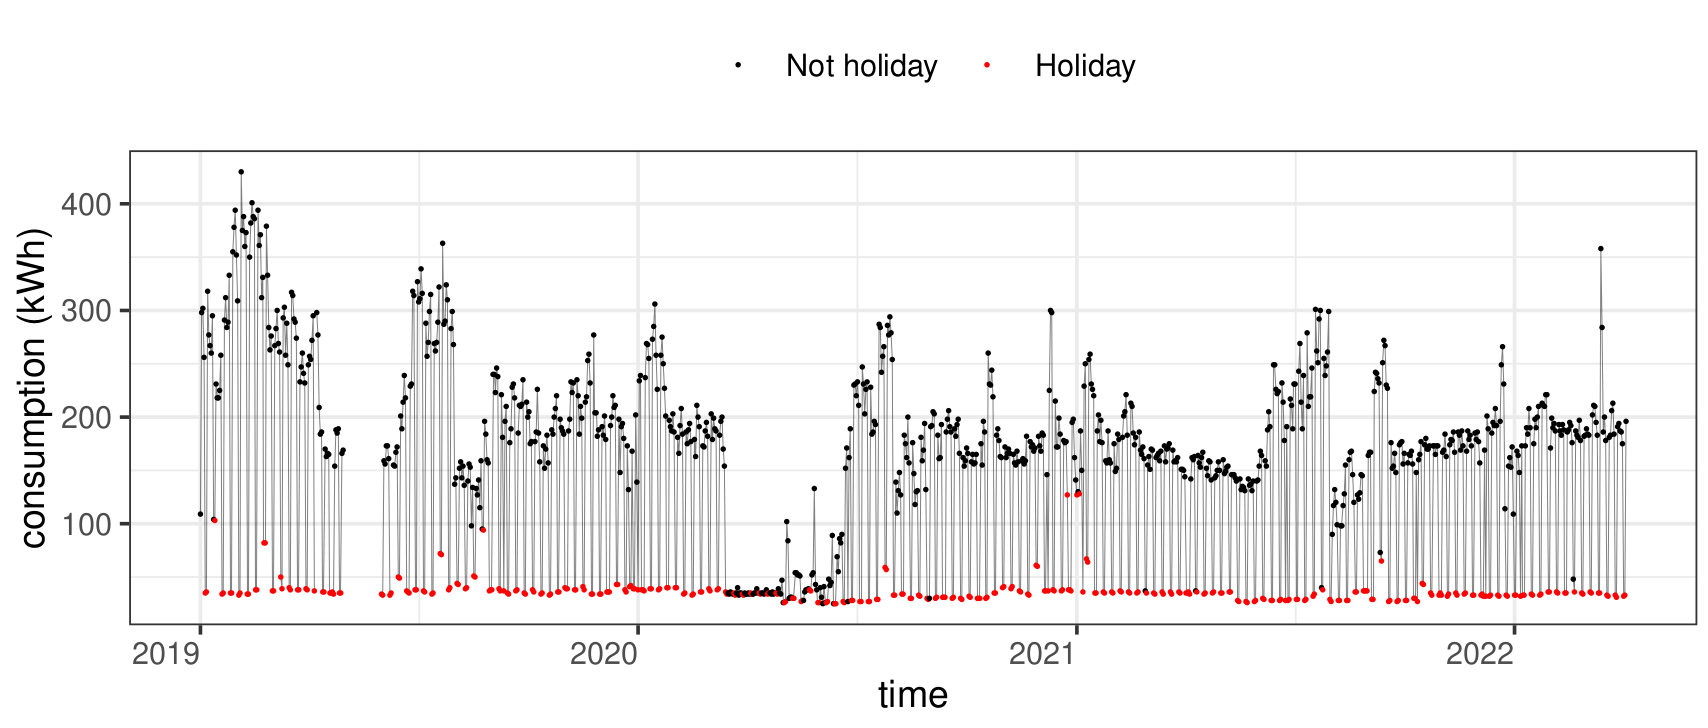
Detection of holiday periods
MindOpera: Data Orchestrator
2.1. What does it do?
Compares the energy performance of multiple buildings at a specific moment to identify inefficient or exemplary performance.
2.2. Data used:
-
Harmonized KPIs per building
-
Static data: use, surface area, climate
-
Typological classification of buildings
2.3. Objectives:
-
Identify best practices and critical buildings
-
Prioritize actions based on comparative performance
-
Generate benchmarks for new projects
-
Cross-sectional benchmarking
Identification and quantification of discrepancies between actual and historical energy consumption

Estimation of the balance temperature for heating and cooling periods
Applied model intelligence (2)
MindOpera: Data Orchestrator
3.1 What does it do?
Evaluates the effectiveness of improvement actions and detects anomalies or deviations in real time.
-
Assess the impact of retrofitting or improvement actions
-
Detect anomalies or deviations in energy performance in real time
-
Action evaluation and operational diagnosis model
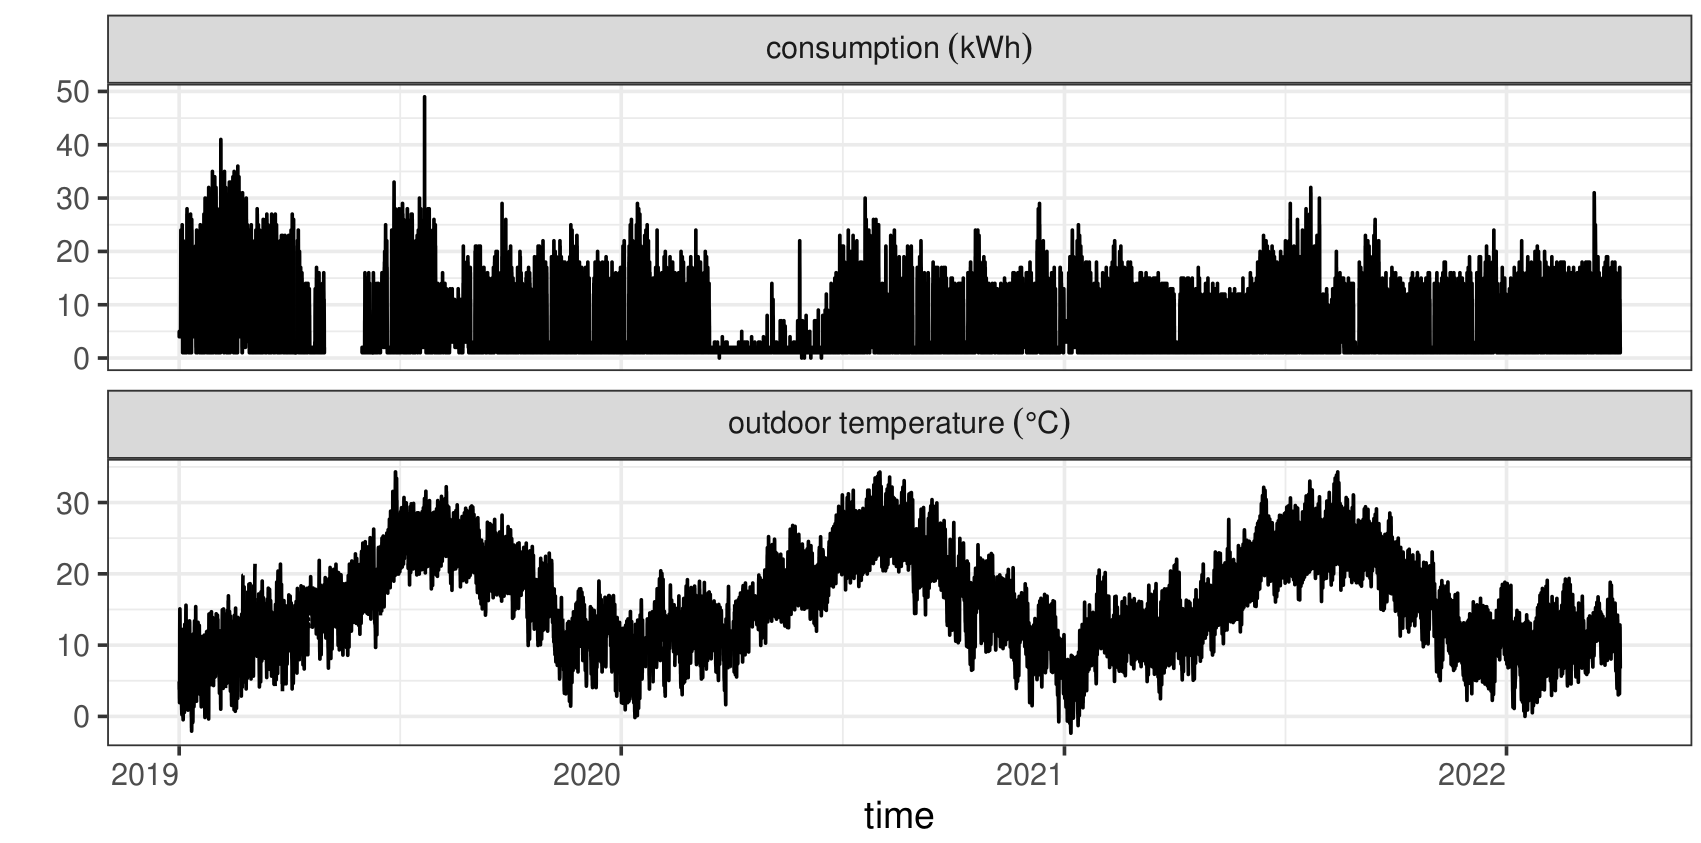
3.2 Data used
-
Harmonized time series of energy consumption
-
Technical information from systems (SCADA, CMMS, IoT sensors)
-
Hourly climate data
-
Gas consumption
3.3 Objectives
-
Validate in real time the effectiveness of implemented improvement actions
-
Reduce downtime and operational costs
-
Generate predictive alerts and enable intelligent maintenance
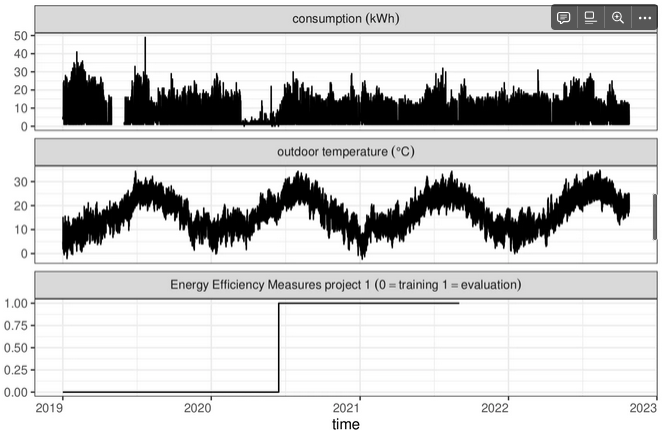
Detailed prediction of efficiency based on the relationship between energy consumption and outdoor temperature
Applied model intelligence (2)
MindOpera: Data Orchestrator
Climate Vulnerability Map of Barcelona
MindCity: Climate-Ready BCN
Aj. Barcelona, ECOSERVEIS
Source: ICLEI Action Fund 2.0
Budget: €1M
Objective: Support citizens and public authorities in adapting to extreme climate events and reducing energy poverty
Implemented: From May 2023 to June 2025


Its goal is to provide precise and up-to-date information for decision-making in urban planning, public policy, climate management, and the protection of the most vulnerable inhabitants.
Aj. Barcelona, ECOSERVEIS
Vulnerability map of Barcelona
-
Vulnerability estimation using AI and energy simulations
-
Export of a large set of socio-economic, energy, cadastral, and climate indicators (KPIs)
MindCity: Climate-Ready BCN
- The Climate Vulnerability Map of Barcelona is a geospatial analysis tool designed to identify the city’s most vulnerable buildings in the event of extreme heat-related events.
- It includes the assessment of all buildings (61,000) against heatwaves.
Main goal
Added value
CVI
How we estimate the Climate Vulnerability Index (CVI)
MindCity: Vulnerability map of Barcelona
Climate vulnerability is typically framed within three key dimensions defined in the IPCC's Third Assessment Report (Intergovernmental Panel on Climate Change) in 2001:
Exposure
Sensitivity
Adaptive capacity
Although most studies classify indicators using these three categories, our index introduces additional levels to provide a more nuanced analysis while remaining aligned with the traditional framework.
Climate variability and extreme events
- Track changes over time through indicators such as temperature, precipitation, and vegetation cover. Local data helps assess risks related to heatwaves, droughts, and floods.
Energy indicators
- Explore energy use patterns (gas and electricity consumption). Indoor temperature data is crucial for identifying households at risk during extreme heat events.
Building characteristics
- Assess features such as age, use, and size to understand their impact on energy use, indoor comfort, and structural vulnerability.
MindCity: Indicators groups (KPIs)
Vulnerability map
Infrastructure indicators
Assess the availability of essential public services (schools, climate shelters, social housing) and the strength of social networks to understand community support capacity.
Health indicators
Analyze the relationship between climate and health outcomes to identify vulnerable populations and prepare healthcare systems.
Demographic indicators
Not all groups are equally vulnerable. Analyzing factors such as gender, age, income, migration status, and unemployment allows for the development of more detailed CVIs.
Socioeconomic indicators
Understand urban resilience through factors such as housing costs, energy poverty, household debt, and gaps in social protection, which worsen during economic crises.
Vulnerability map
MindCity: Indicators groups (KPIs)
MindCity: Building CVI
-
Data preprocessing – Select input data to calculate the indicators.
-
Framework selection – Determine which indicators positively or negatively affect the CVI.
-
Granularity definition – Select the spatial scale.
-
Normalization & weighting – Harmonize indicators and assign weights.
-
Aggregation – Combine indicators into groups to obtain a final value.
⚠️ Challenge: Each study adapts its CVI to its specific context and priorities.
Climate Vulnerability Index (CIV)
Vulnerability map
Our approach includes interactive features:
-
View individual indicator layers.
-
Customize weights for tailored vulnerability analysis.
-
Adapt the CVI based on user goals (e.g., prioritizing climate vs. socioeconomic factors).
🎯 Outcome: Provide a practical tool for both policymakers and citizens to explore climate vulnerability and support decision-making.
MindCity: Building CVI
Vulnerability map
-
Local microclimate model
MindCity: Modelling
Vulnerability map
-
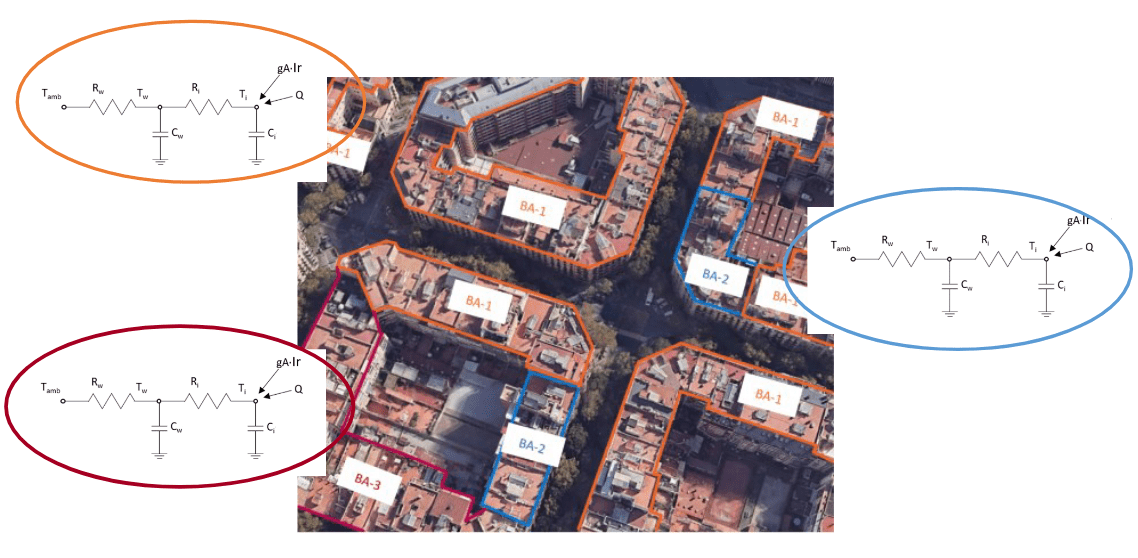
Thermal demand models
Simulation of cooling and heating demand based on a Resistor-Capacitor (RC) Model calibrated according to each building’s archetype. The model uses an electrical circuit to simplistically mimic the building’s thermal dynamics.
Vulnerability map
MindCity: Modelling
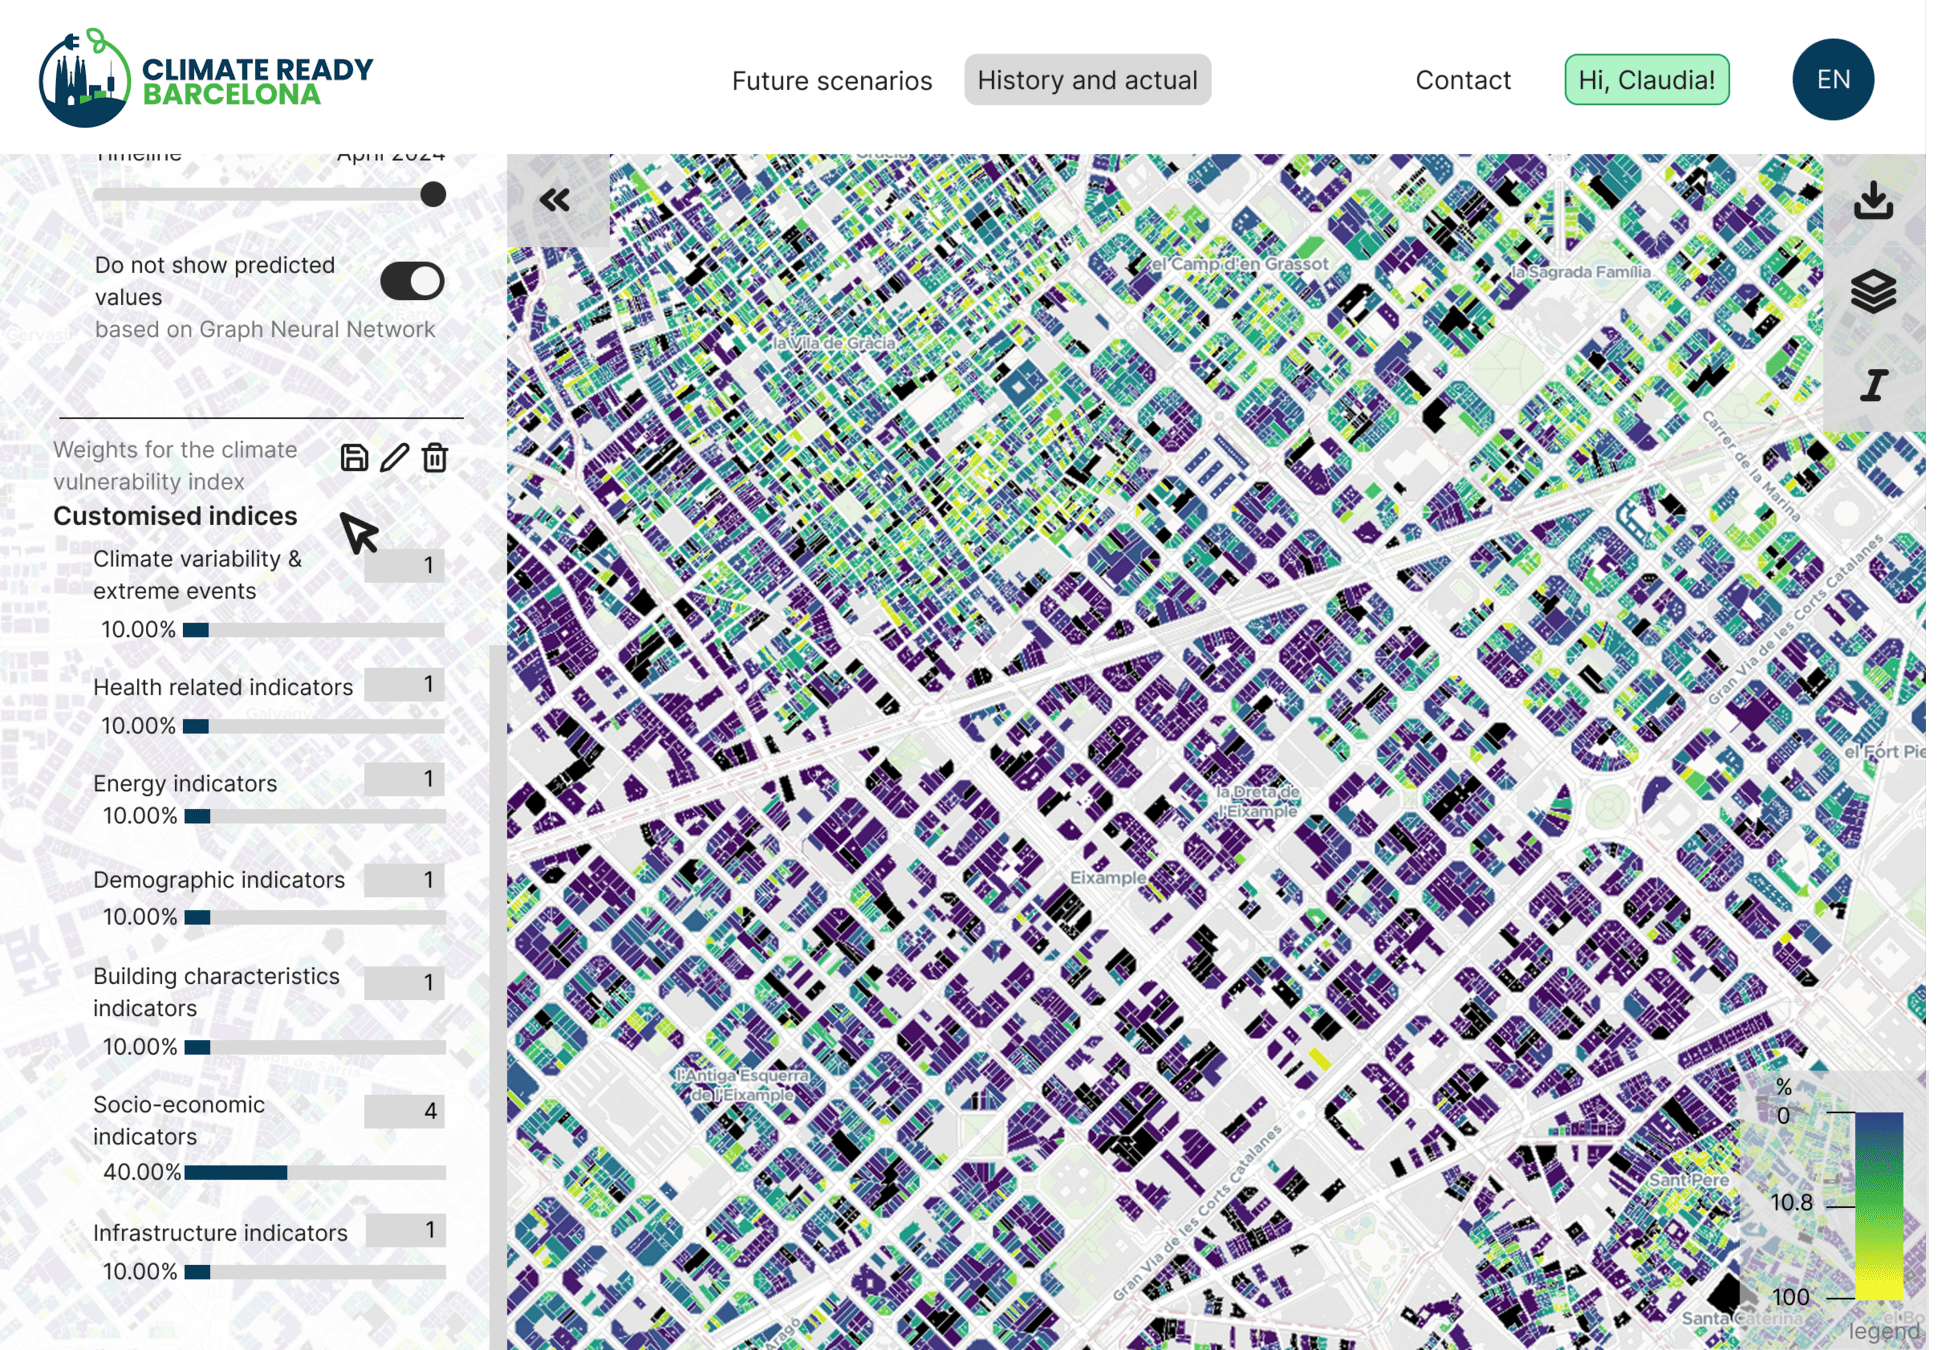
MindCity: Climate Vulnerability Map Visualization
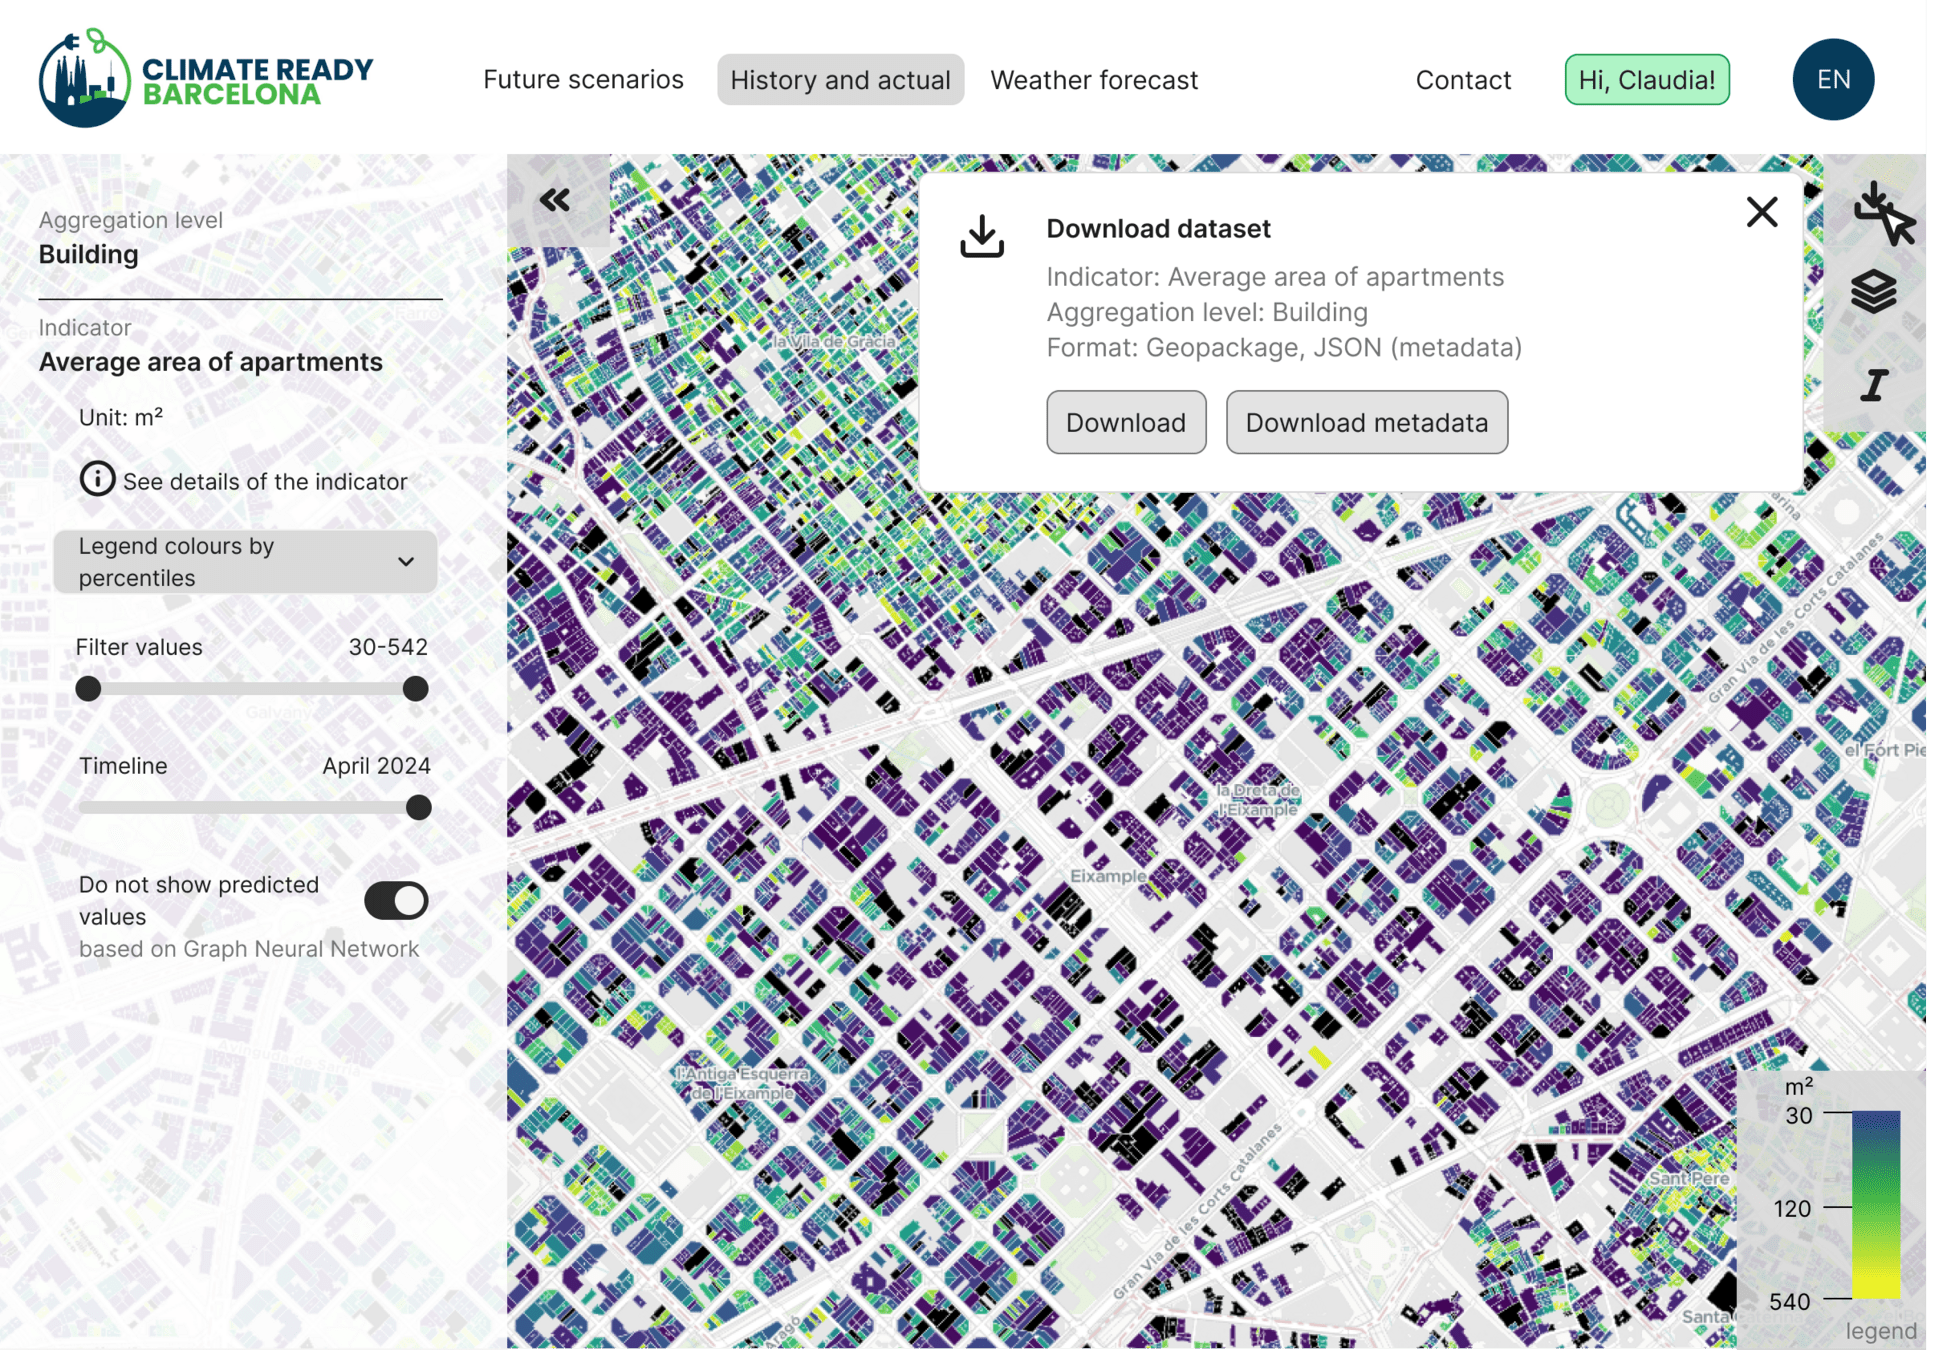
Export and data visualization
Text
Vulnerability map
Vulnerability map

Index evolution by streets and buildings
Queries and forecasts
Vulnerability map
MindCity: Climate Vulnerability Map Visualization
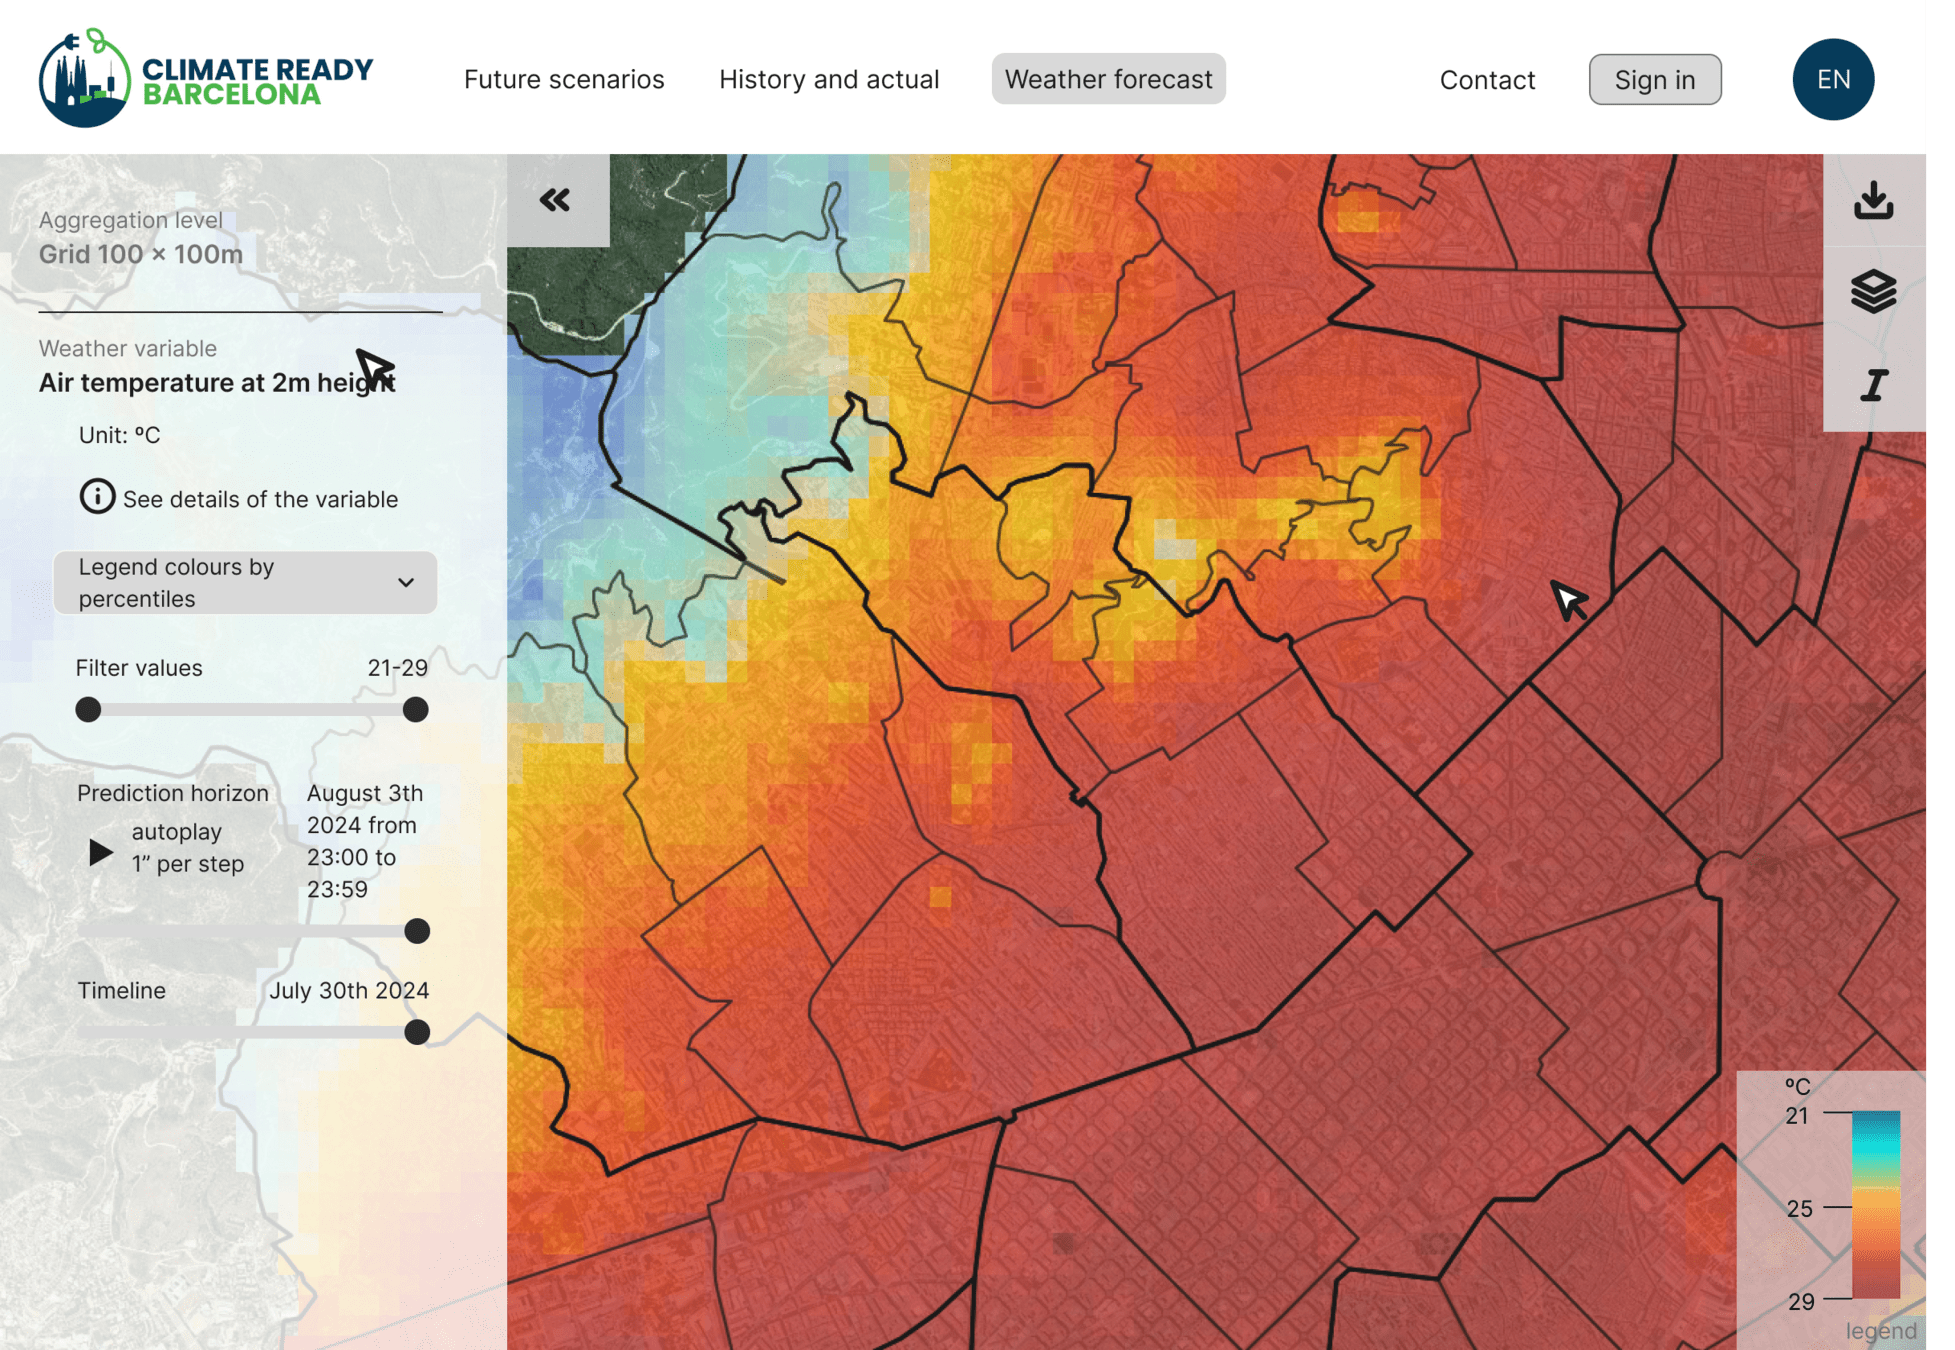
Queries and forecasts
Temperature forecast visualization by neighborhoods
Vulnerability map
MindCity: Climate Vulnerability Map Visualization
Governance and licensing
Governance and licensing
Commitment to innovation
Public investment in innovation
-
Catalan
-
Spanish
-
European
Economy of scale
Return on investment
-
High initial implementation cost
-
Low maintenance cost
-
Medium- and long-term return
-
No monthly license fees
-
Collaborative software improvement
Self-sufficiency
-
Independence from big tech
-
Commitment to the local tech ecosystem
-
Transparency
License EUPL-1.1
An open public administration
Governance and licensing
License EUPL-1.1
Open-source license promoted by the European Commission, specifically designed for software developed by public administrations in Europe
-
Legal compatibility with the European framework
-
Obligation to share improvements (copyleft)
-
Promotes interoperability and reuse
A solid legal framework that promotes collaboration and continuous improvement of software in the public sector
License EUPL-1.1
Thank you
Jordi Cipriano
Director of Innovation Unit BEEGroup
cipriano@cimne.upc.edu
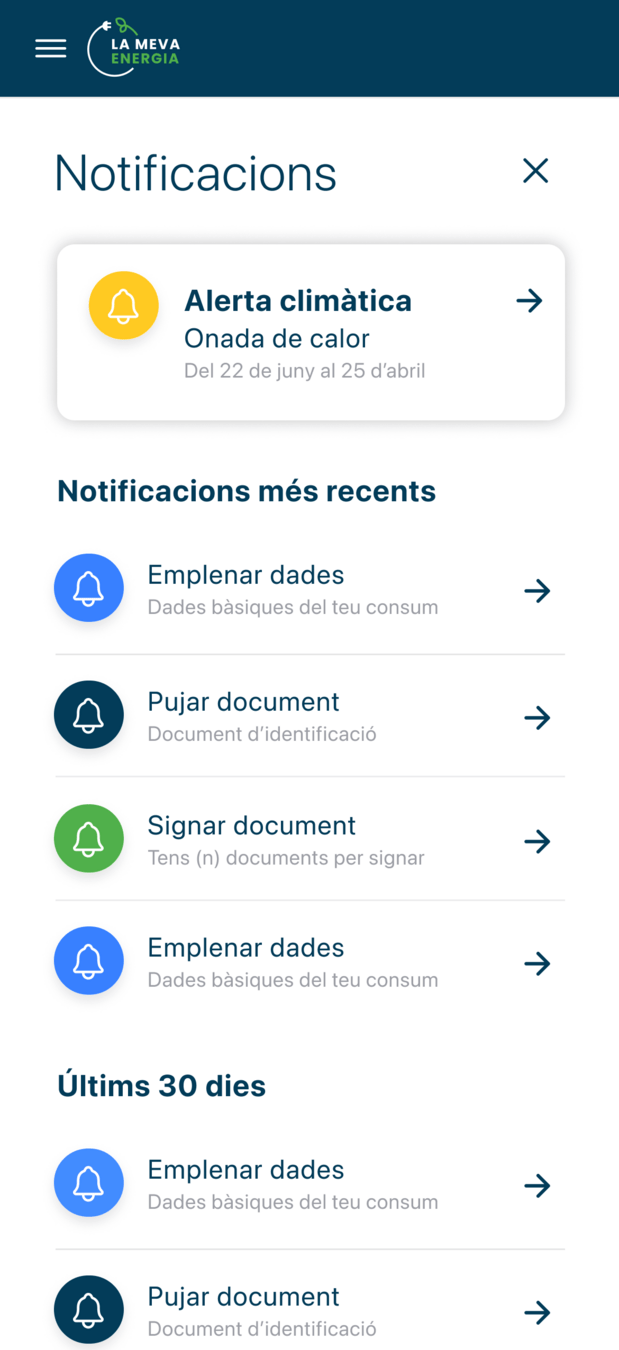
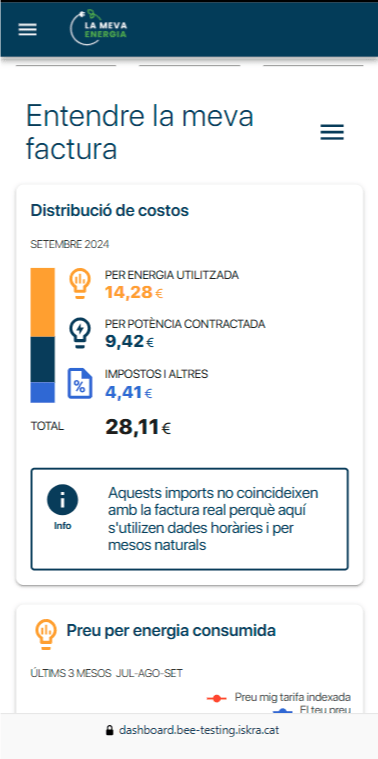
Mapa i app de vulnerabilitat climàtica
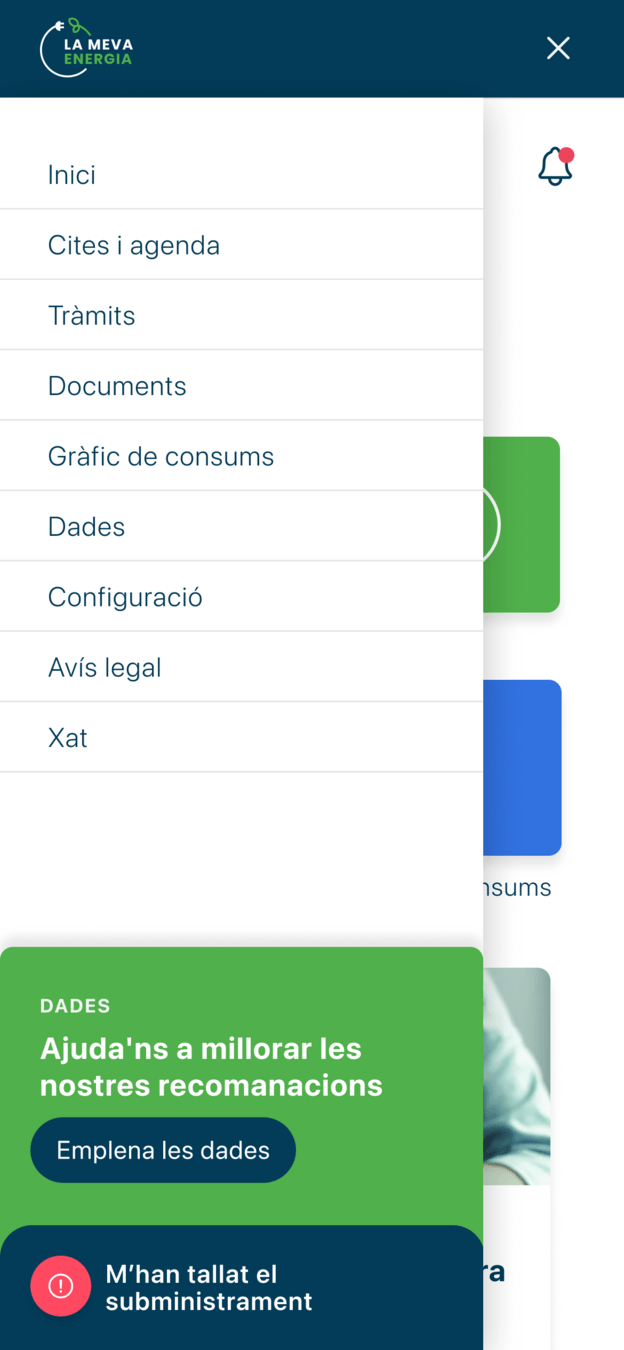
1. APP La Meva Energia
-
Un nou canal d'accés digital als Punts d'Assessorament Energètic (PAEs) de l'Ajuntament de Barcelona:
- Universal i accessible per a tots els ciutadans.
- Complementa els canals d'accés existents.
- Augmenta l'abast de les accions de prevenció de la pobresa energètica
- Sensibilitza i garanteix el dret a l'informació energètica per a tota la ciutadania.
- Proporciona al personal tècnic dels PAES una eina de gestió avançada
MindCity: Climate-Ready BCN

BEEMind_ENG
By CIMNE BEE Group
BEEMind_ENG
Solucions basades en intel·ligència artificial per a l'augment de la resiliència climàtica en edificis i entorns urbans


