network graphs,
geocoding,
& GIS
ryan clement | go/ryan/
what we're doing
- network graphs - what are they?
- making a network graph using Google Fusion Tables
- geocoding with Awesome Table & Google Sheets
- mapping with ArcGIS Online
network graphs
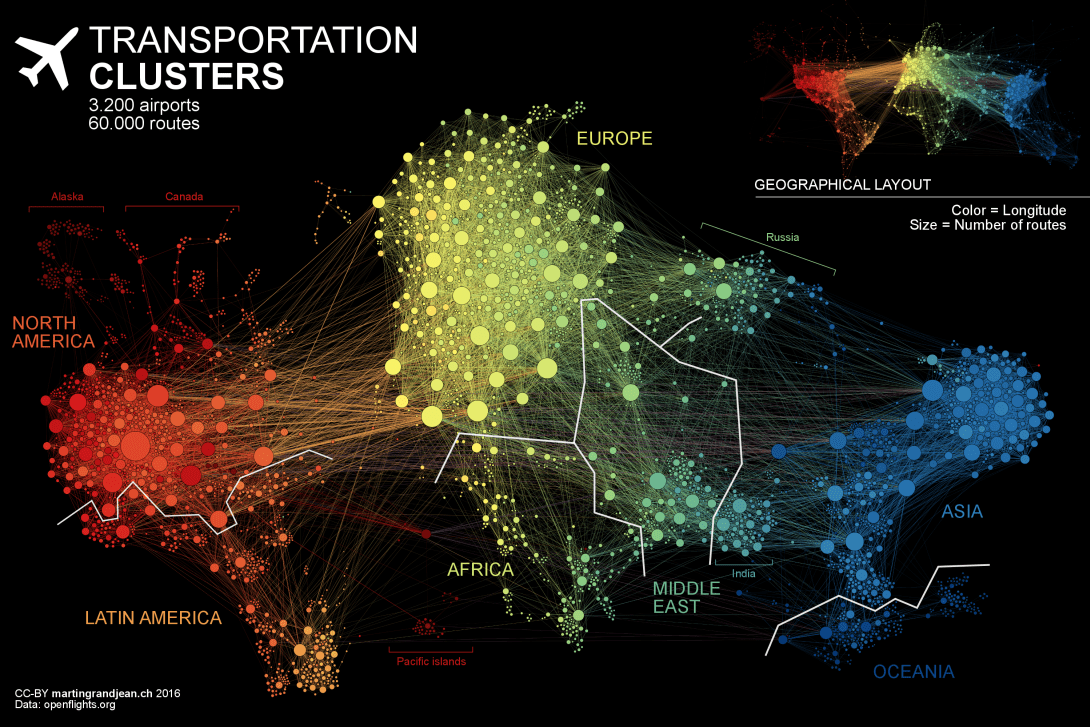
Grandjean, M., “Connected World: Untangling the Air Traffic Network.” 2016. Martin Grandjean (blog). May 26, 2016. http://www.martingrandjean.ch/connected-world-air-traffic-network/.
nodes & edges
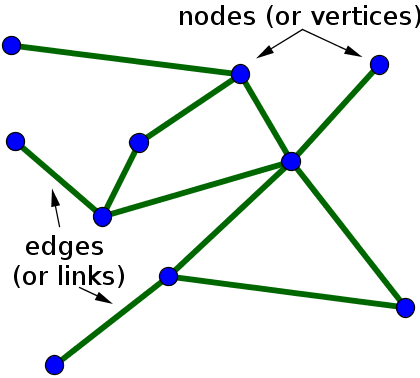
Nykamp DQ, “An introduction to networks.” From Math Insight. http://mathinsight.org/network_introduction
directed networks
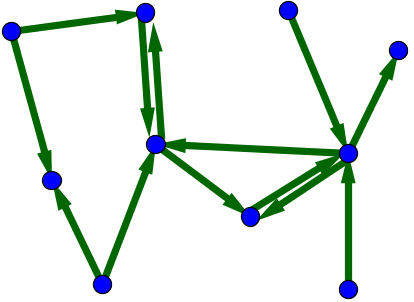
Nykamp DQ, “An introduction to networks.” From Math Insight. http://mathinsight.org/network_introduction
different nodes & edges

Nykamp DQ, “An introduction to networks.” From Math Insight. http://mathinsight.org/network_introduction
weighted nodes & edges
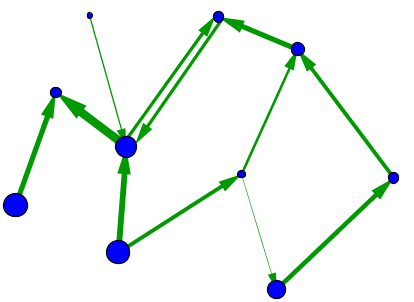
Nykamp DQ, “An introduction to networks.” From Math Insight. http://mathinsight.org/network_introduction
centrality
degree centrality
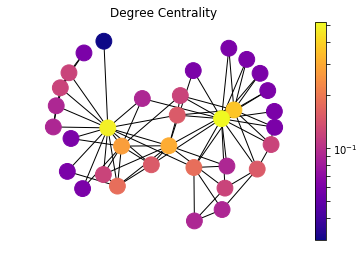
more friends = more important/influential
eigenvector centrality
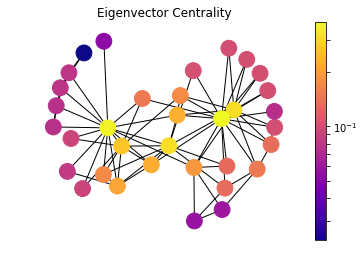
more important friends = more important/influential
closeness centrality
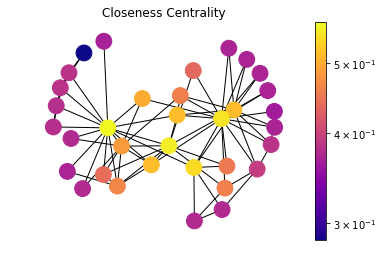
information from the closest can spread to the network quickly - shortest paths to everyone in the network
betweeness centrality
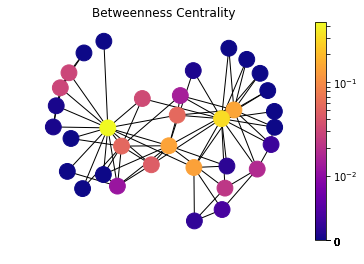
information often flows through them - most short paths flow through them
let's make a network graph!
table: go/harc-network-graph/
google fusion tables: go/fusiontables/
make sure you have added our table to your google drive!
further reading
geocoding
- geocoding with Awesome Table plugin - part 1
- geocoding with Awesome Table plugin - part 2
- exhibition gold google sheet: go/exhibition-gold/
Break!
but first...
- go to go/arcgisonline/
- sign in "using Middlebury"
- click on "groups" at the top of the screen, then "my organization's groups"
- search for "HARC"
- request access to the group!
mapping with ArcGIS online
First...what is GIS?
- GIS stands for Geographic Information System
- GIS is a tool used to capture, store, manipulate, analyze, manage, and present geographic data
- The data used with GIS is spatial data (data that is referenced to points on the Earth)
- GIS is not a map!
maps are made of layers
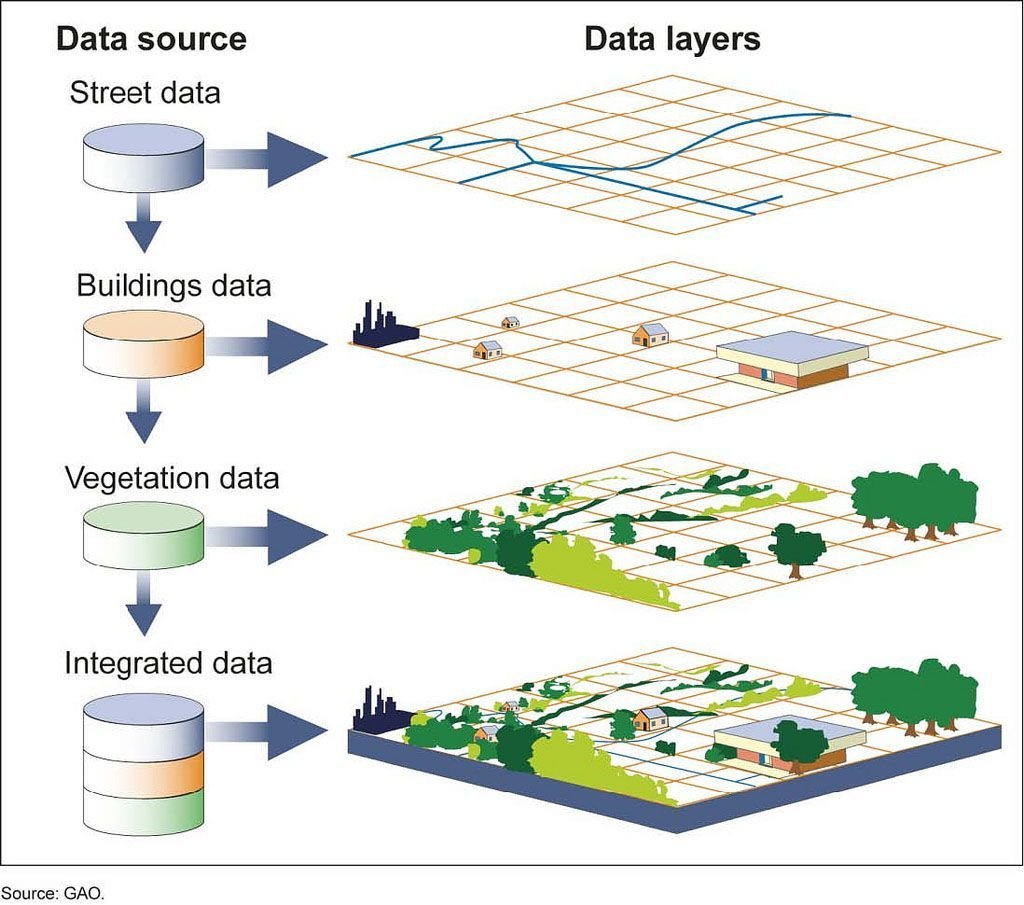
What are our possible layers?
- basemap
- locations of archaeological finds
- locations of dealers/collectors
- locations of museums
- etc...
let's make a map!
ArcGIS Online: go/arcgisonline/
more resources for ArcGIS Online
harc0355 network graphs, geocoding, and gis
By Ryan Clement


