Thinking in Graphs
A Tech Talk, 3/3/23

©2021 Copyright - Confidential and Proprietary

©2021 Copyright - Confidential and Proprietary
What We'll Cover
- What data graphs are / can be
- How to think about your data in a graph
- How data graphs differ from other data modeling approaches
- The value of data graphs
- When to use a data graph
©2021 Copyright - Confidential and Proprietary
What is a data graph?
What is a data graph?
- A data graph is an approach to structuring data that is focused on relationships between entities.
- It's non-linear architecture allows for more flexibility and enables you to create connections between disparate pieces of data to provide new and powerful insights.
- When we talk about data within a data graph we generally refer to entities as "nodes", and connections between entities as "edges".
How do they work?
- Based on graph theory, a mathematical approach to model pairwise relations between objects.
- It connects vertices in a network through edges.

©2021 Copyright - Confidential and Proprietary
How we got here
©2021 Copyright - Confidential and Proprietary
How we got here
- Driven by a more recent change in how we think about data, which impacted how we structure it.
- Thinking shifted from how to most efficiently store data to how to get the most value out of it.
- Realization that data is inherently more valuable when it is connected.

©2021 Copyright - Confidential and Proprietary
The gold rush


GraphQL

Stardog

DGraph

Notable implementations


©2021 Copyright - Confidential and Proprietary
A shift in mindset needs to occur in order to see the value [in data graphs]. This mindset is a shift from thinking about your data in a table to prioritizing the relationships across it.
- Matthias Broecheler
©2021 Copyright - Confidential and Proprietary
Shifting our mindset

Trees vs. Graphs

- All trees are Graphs, but not all graphs are trees...
- Trees are linear, they have a single root node and flow in a single direction.
- Can connect to other leaf nodes or more subtrees, but connections happen in a specific order.
Trees vs. Graphs

- Graphs are omnidirectional
- They have no defined end or beginning, they have multiple "entrypoints"
- Connections to nodes within a graph can be
Multiple Entrypoints


Relational vs. Graph


- Relational model uses foreign keys to relate data together.
- Relational focuses on storing tabular data for people, places, and things.
- Graphs make it easier to create richer data connections with edges.
What does a healthy data graph look like?
- Many connections on each node, and many paths to each node through various entrypoints.
- Common entities referenced throughout the graph, enriched with relationship-specific data via edges.
- Few if-any "dead ends" within the graph where nodes are only accessible via a single entrypoint.
©2021 Copyright - Confidential and Proprietary
Edges

©2021 Copyright - Confidential and Proprietary
Edges
- Edges are the connections between nodes within a graph
- They often contain data that can be attributed to the relationship of the nodes
- You can have directed or bidirectional edges within a graph


©2021 Copyright - Confidential and Proprietary
Bidirectional Edges
- Bidirectional edges represent connections to nodes within a graph regardless of direction.
- In this example, the relationship between me and my dad can always be considered "family".

©2021 Copyright - Confidential and Proprietary
Directional Edges
- Directional edges represent connections to nodes where directionality does matter.
- In this example we are looking at a graph of twitter followers. Me and Elon Musk are followed by Russian bots, and I follow Elon musk, but Elon doesn't follow me and neither of us follow the Russian bots.

©2021 Copyright - Confidential and Proprietary
The value of a data graph

- Allows us to enrich connections from disparate data sources with highly valuable information.
- We can use edge data to personalize experiences for the user.
- Personalized experiences can lead to better customer engagement & ultimately revenue.
©2021 Copyright - Confidential and Proprietary
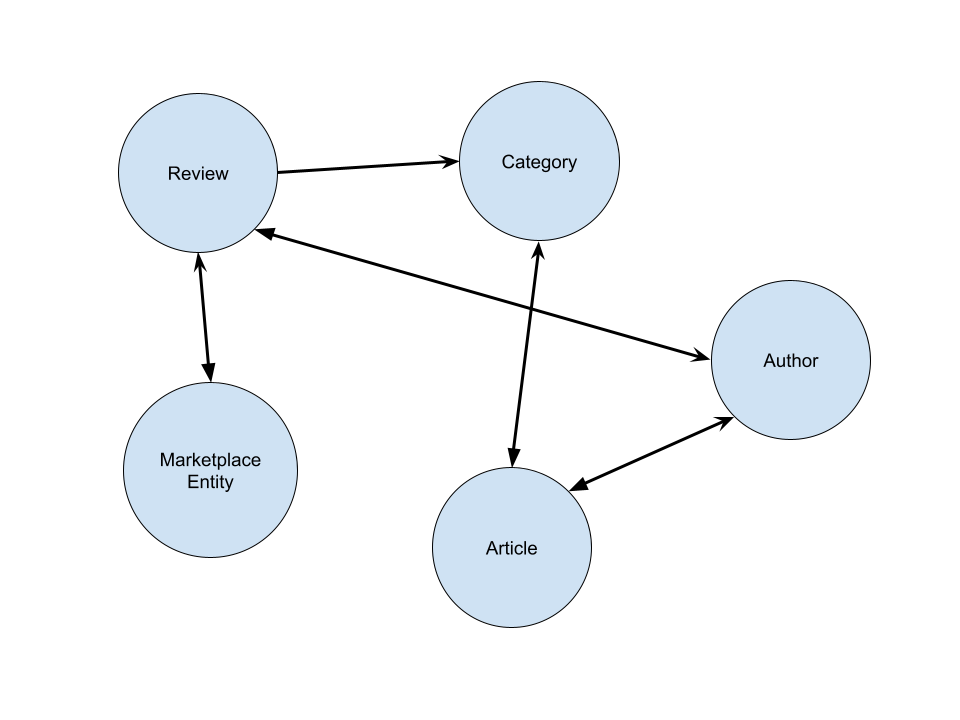
How we leverage data graphs at NerdWallet
{
  review {
    title
    authors {
      name
    }
    categories {
      id
      articles {
        title
        authors {
          name
        }
      }
    }
    marketplaceEntity {
      id
      name
      review {
        id
        title
      }
    }
  }
}
©2021 Copyright - Confidential and Proprietary
When to leverage a data graph
- Relationships within your data help you understand your problem better.
- A lot of the data you need is derived from the relationship between entities.
- Most of the complexity within your implementation will be around creating relationships between entities.
- Your entity models change often, and are highly connected to other models.
©2021 Copyright - Confidential and Proprietary
Takeaways
- Data graphs can be an effective tool for extracting more value from your data.
- Data graphs can help create more meaningful connections by enriching them with edge data.
- When working with data graphs we need to stop thinking about data linearly, and embrace graph thinking when modeling nodes and edges for a data graph.
©2021 Copyright - Confidential and Proprietary
Thanks for coming! Questions?
Thinking in Graphs
By Ryan Kanner


