

Content ITV PRO
This is Itvedant Content department
CartSure Performance Testing & JMeter Project Initiation
Business Scenario
You have recently joined the CartSure project as a Performance Tester.
CartSure is an e-commerce web application used by customers to browse products, search for items, add products to the shopping cart, view product details, and place orders.
Recently, users reported:
Product pages taking too long to load
Slow application response during peak shopping hours
Delays while searching for products
Shopping cart operations becoming slow
Checkout requests failing when many users access the application simultaneously
The manager says :-
“A Performance Tester must understand JMeter, Test Plans, Thread Groups, Samplers, and Listeners before creating performance tests.”
Your task is to explore Apache JMeter, create a new Test Plan, add a Thread Group, explore Samplers and Listeners, and save the project as:
CartSure_Performance_Test.jmx
Pre-Lab Preparation
Topic : Weaving the world of Web
1) Performance Testing Fundamentals
2) Apache JMeter
3) Test plan
Git Pull
4) Thread Group
5) Samplers
6) Listener
7) JMeter Test Execution Flow
Sub-Topics :-
1) Performance Testing Overview
2) JMeter Overview
3) Virtual Users
4) Test Plan Structure
5) Thread Groups
6) HTTP Request Sampler
7) Listeners
8) Request and Response Flow
Task 1: Understand Performance Testing and JMeter
git pull origin branchNameUnderstand Performance Testing
1
What is Performance Testing?
Performance Testing is a type of software testing used to determine how an application behaves under different workloads.
It helps testers measure:
Response time
Application stability
System capacity
Throughput
Error rate
Real Life Example
Suppose 1,000 CartSure customers attempt to browse products, add items to their shopping carts, and access the checkout page at the same time.
Performance testing helps determine whether CartSure can handle these users without significant delays, performance degradation, or request failures.
Understand Apache JMeter
2
What is JMeter?
Apache JMeter is an open-source performance testing tool used to simulate multiple users and measure application performance.
JMeter can be used to test:
Web applications
REST APIs
Databases
FTP services
Other network-based applications
How JMeter Works
Virtual Users
↓
Requests
↓
Cartsure Application
↓
Responses
↓
Performance Results
Task 2: Create a JMeter Test Plan and Thread Group
Open JMeter
1
Open Apache JMeter on your computer.
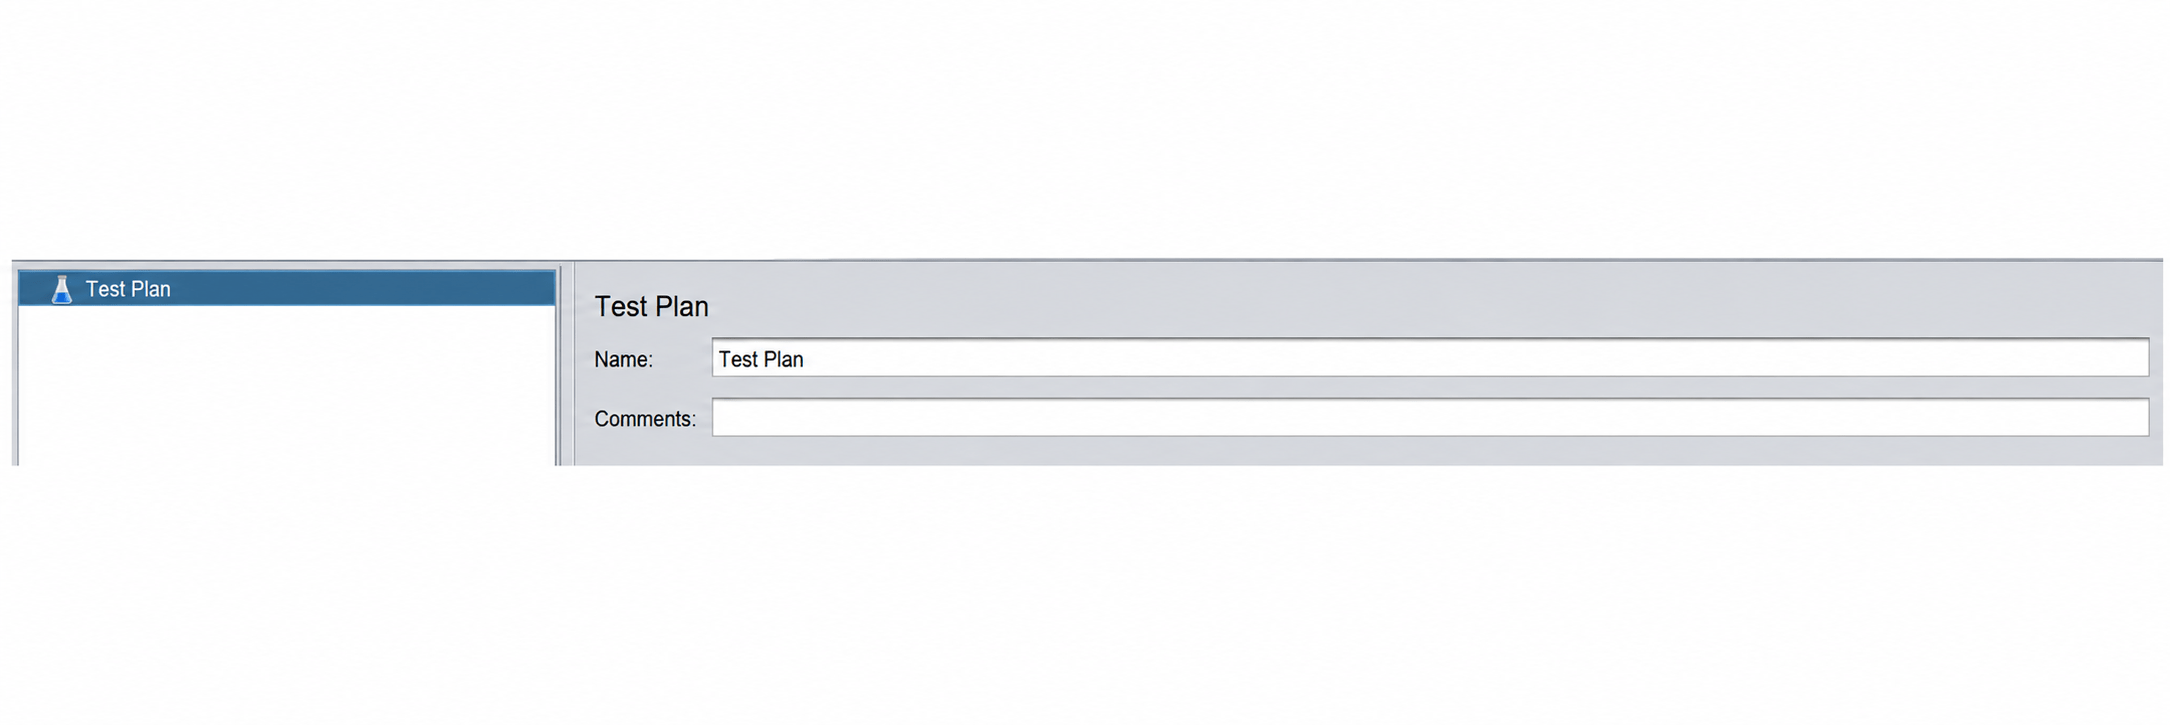
When JMeter opens for the first time, you should see a new, blank Test Plan already created.
Rename the Test Plan
2
You do not need to select File → New unless an existing project or test plan is already open.
In the left-hand Test Plan tree:
1. Click Test Plan.
2. Enter CartSure Performance Test.
3. Click Test Plan.
Add a Thread Group
3
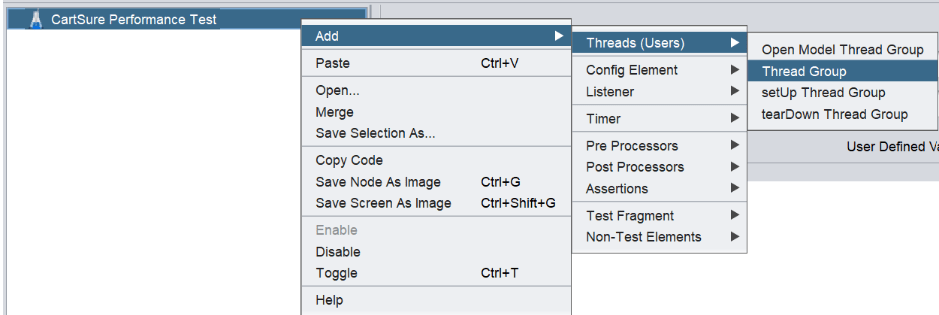
In the left-hand tree:
Right-click CartSure Performance Test
Select and hover on Add.
Select and hover on Threads (Users).
Select and hover on Thread Group.
Click Thread Group.
6. Enter CartSure Users.
7. Press test plan
You should now see cartsure thread group under cartsure Performance Test.
Explore Thread Group
4
Click cartsure Users in the left-hand tree.
On the right side, you’ll see the Thread Group settings. Take a moment to locate these three fields:
Number of Threads (users) — the number of virtual users JMeter will simulate.
Ramp-Up Period (seconds) — how quickly JMeter starts those users.
Loop Count — how many times each user repeats the test.
For now, do not change any values. Just identify where these settings are located.
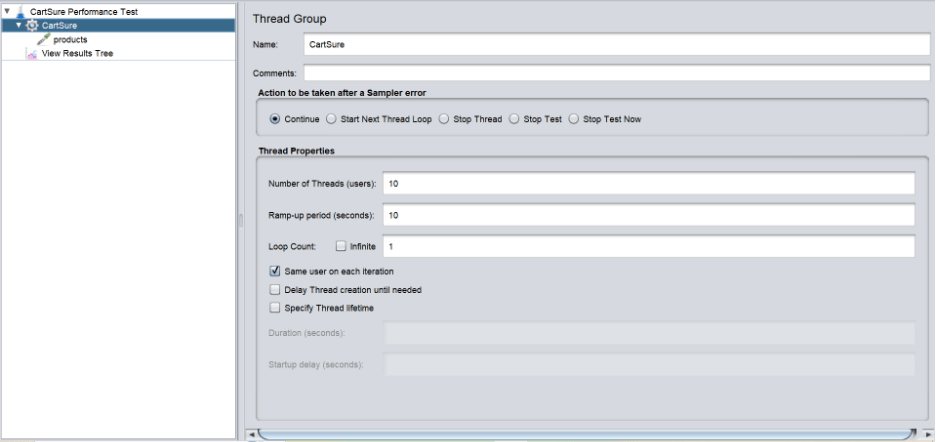
Thread Group Example
Number of Threads = 10
Ramp-Up Period = 10 seconds
Loop Count = 1
This represents 10 virtual users starting over a 10-second period.
Task 3: Explore Samplers
Understand Samplers
1
A Sampler is a JMeter component that sends a request to a server or application.
Common Samplers include:
HTTP Request
JDBC Request
FTP Request
Java Request
Add an HTTP Request Sampler
2
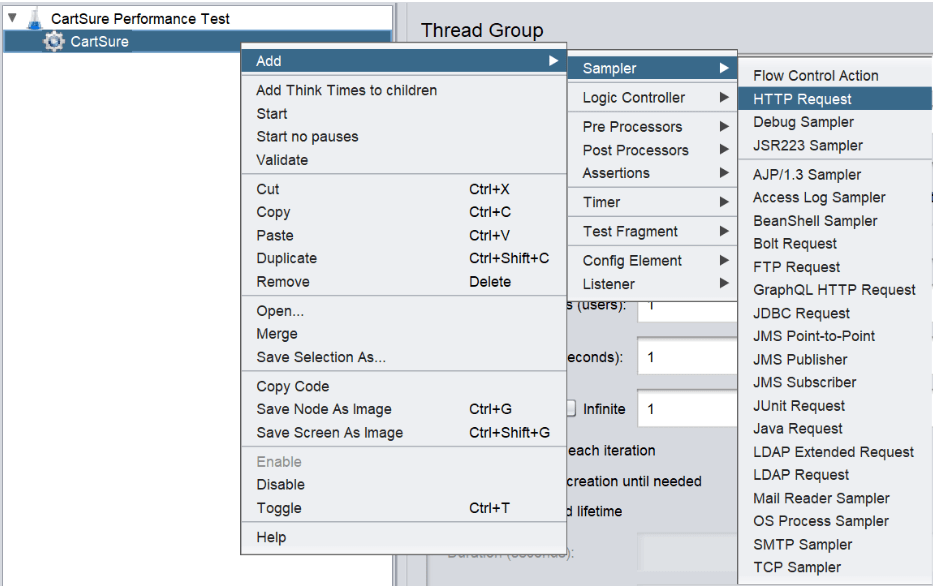
In the left-hand tree:
Right-click cartsure thread group.
Select Add.
Select Sampler.
Select HTTP Request.
A new HTTP Request item will appear under CartSure Users.
Your Test Plan should now look like:
Payflow Performance Test
|
+-- Payflow Users
|
+-- HTTP Request
Explore HTTP Request
3
Click HTTP Request in the left-hand tree.
On the right, you’ll see the HTTP Request configuration screen. Take a moment to locate these fields:
Protocol — the protocol used to connect to the server, such as http or https.
Server Name or IP — the hostname or IP address of the server you want JMeter to send the request to.
Port Number — the server port, such as 80 or 443. This can usually be left blank when using the standard port for the selected protocol.
Method — the type of HTTP request, such as GET or POST.
Path — the URL path of the resource you want to request.
For example, you might configure the request as:
Protocol: https
Server Name or IP: cartsure.example.com
Method: GET
Path: /api/products
Request Flow
Thread Group
↓
HTTP Request
↓
Payflow Application
Payflow Application
↓
Response
Task 4: Explore Listeners and JMeter Test Flow
Understand Listeners
1
A Listener collects, displays, and helps analyze JMeter test results.
Common Listeners include:
View Results Tree
View Results Table
Summary Report
Aggregate Report
Response Time Graph
Listeners can provide information such as:
Response time
Number of requests
Successful requests
Failed requests
Throughout
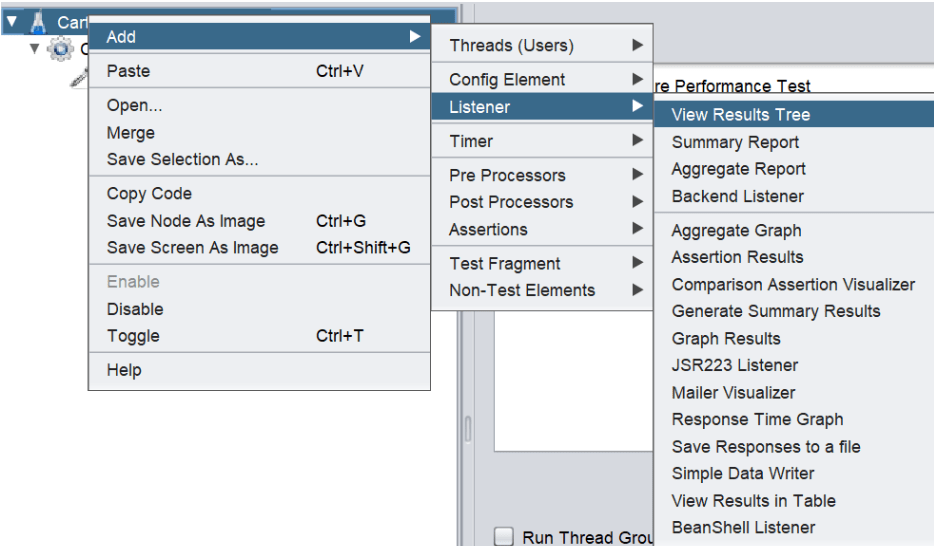
Add View Results Tree
2
To view the results of your test:
In the left-hand tree, right-click cartsure Performance Test.
Select Add.
Select Listener.
Select View Results Tree.
View Results Tree will allow you to see the requests sent by JMeter and the responses received from the application.
Your Test Plan should now look like:
CartSure Performance Test
|
+-- CartSure
| |
| +-- HTTP Request
|
+-- View Results Tree
Understand the Complete Flow
3
Test Plan
↓
Thread Group
↓
Sampler
↓
Application
↓
Response
↓
Listener
↓
Performance Results
Task 5: Execute the JMeter Performance Test
Configure the Test
1
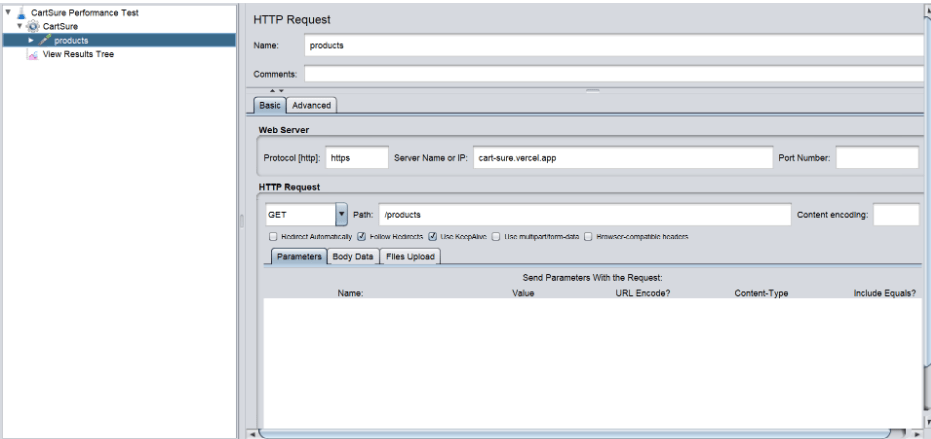
Select CartSure Users → HTTP Request and enter:
Protocol: https
Server Name or IP: cart-sure.vercel.ap
Port Number: Leave blank
Method: GET
Path: /products
Complete URL:
https://cart-sure.vercel.app/products
Select CartSure Users and configure:
Number of Threads (users): 10
Ramp-Up Period (seconds): 10
Loop Count: 1
Save the project as:
CartSure Performance Test.jmx
Execute and View Results
2
Click the green Start (▶) button in JMeter to execute the test.
JMeter will simulate 10 virtual users and send:
GET https://cart-sure.vercel.app/products
The execution flow is:
Thread Group → HTTP Request → CartSure Application → Response → View Results Tree
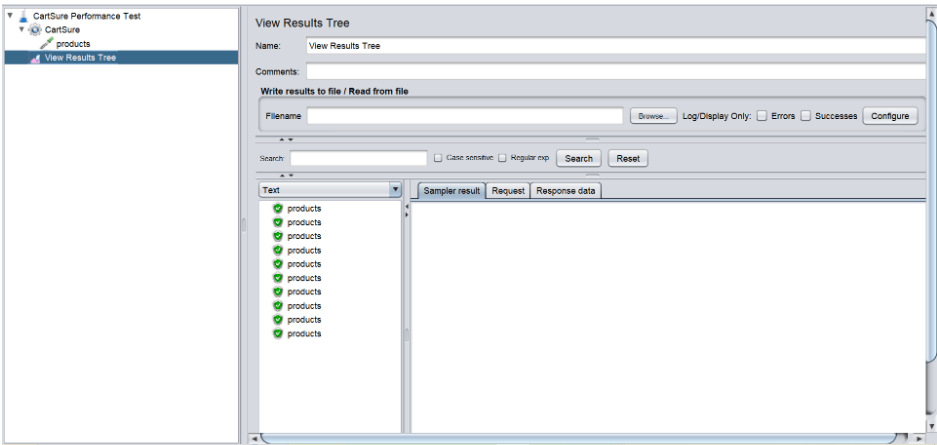
After execution, select View Results Tree to verify the request, response code, response time, and success or failure status.
The test is successfully executed when the /products requests are displayed in the View Results Tree listener.
Good Job!!
In this lab, you learned the fundamentals of Apache JMeter and Performance Testing.
You explored:
Performance Testing concepts
Apache JMeter
Test Plans
Thread Groups
Checkpoint
Samplers
Listeners
JMeter Test Execution Flow
You also learned how:
JMeter simulates virtual users
A Test Plan organizes a performance test
A Thread Group defines virtual users
Samplers send requests to an application
Listeners display and analyze test results
JMeter executes HTTP requests against the CartSure application
JMeter can test the CartSure /products resource
Git Push
git push origin branchNameNext-Lab Preparation
Topic : Working with a Text and Listin HTML
1) Power of HTML text tags
2) Customizing your style with CSS
3) Listing it right using HTML
4) HTML Link up , attributes of tag, block vs inline elements
Text box Width : 887
Business Scenario, Pre-lab Preparation, Next-lab Preparation, Task, Activity, Checkpoint : 90%.
Steps : 1,2,3 [Sub Steps - a,b,c]
Normal Text, Topic Name : 80%
Subtopic : 70%
Code Box font Size : 16px
By Content ITV