


Content ITV PRO
This is Itvedant Content department
Create and Transform Features for Insights
Business Scenario
Welcome!
Today is your seventh day as a Junior Data Analyst at a retail analytics company.
Retail organizations often need additional insights that are not directly available in raw datasets. Data analysts create new features (columns) and transform existing data to uncover meaningful business patterns, improve reporting, and support decision-making.
Pre-Lab Preparation
git pull origin branchNameGit Pull
Click to download Dataset : Retail_Dataset_Cleaned
Topic: Data Manipulation with Pandas
1) Data Preparation Essentials
Task 1: Create New Columns
Retail organizations collect large amounts of sales, inventory, customer, and product data every day. However, raw data alone does not always provide the insights needed for business decision-making.
Data analysts often create new columns (features) from existing data to derive meaningful business metrics. These newly created features help understand profitability, inventory levels, sales performance, and customer behavior more effectively.
By creating new features, analysts can transform raw data into actionable business insights.
What is Feature Creation?
Feature Creation is the process of generating new columns using existing columns in a dataset.
Open Google Colab
1
2
Import Required Libraries
import pandas as pd
import numpy as np
3
Upload the Retail Dataset
4
Load Dataset Using Pandas
df = pd.read_csv("/content/Retail_Dataset_Modified.csv")

print("Dataset Loaded Successfully")
Display First Five Records
5
df.head()6
Check Dataset Information
df.info()7
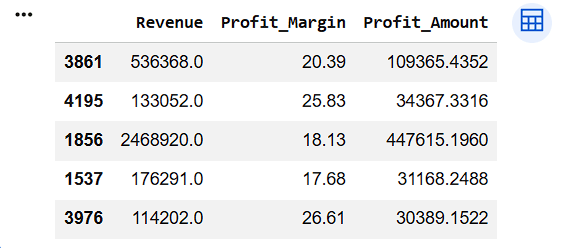
Create Profit Amount Column
Profit Amount indicates the actual profit earned from sales.
Profit Amount = Revenue × Profit Margin / 100
Formula
df["Profit_Amount"] = (
df["Revenue"] *
df["Profit_Margin"] / 100
)
df[["Revenue",
"Profit_Margin",
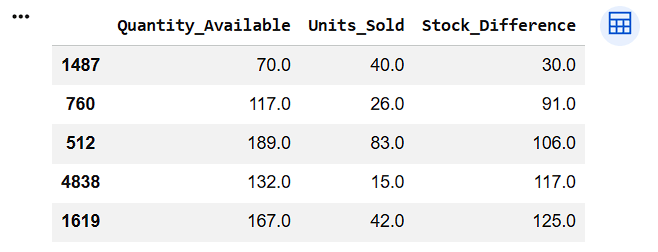
"Profit_Amount"]].sample(5)Create Stock Difference Column
This feature shows the difference between available stock and units sold.
8
df["Stock_Difference"] = (
    df["Quantity_Available"] -
    df["Units_Sold"]
)

df[["Quantity_Available",
    "Units_Sold",
    "Stock_Difference"]].sample(5)
9
8
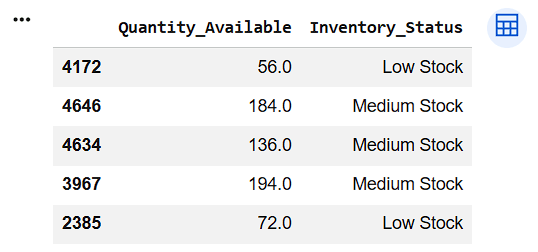
Create Inventory Status Column
Categorize inventory levels based on available quantity.
Condition:
df["Inventory_Status"] = np.where(
df["Quantity_Available"] < 100,
"Low Stock",
np.where(
df["Quantity_Available"] <= 200,
"Medium Stock",
"High Stock"
)
)
df[["Quantity_Available",
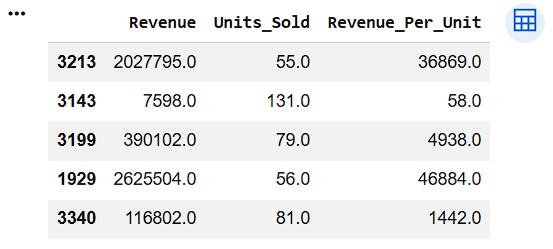
"Inventory_Status"]].sample(5)Create Revenue Per Unit Column
Revenue generated for each unit sold.
10
df["Revenue_Per_Unit"] = (
df["Revenue"] /
df["Units_Sold"]
)
df[["Revenue",
"Units_Sold",
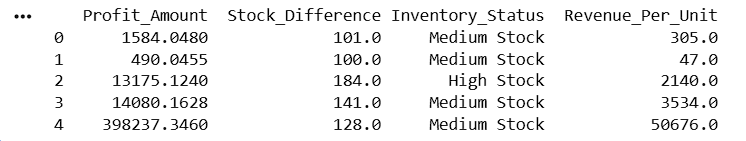
"Revenue_Per_Unit"]].sample(5)Verify Newly Created Columns
11
print(df[[
    "Profit_Amount",
    "Stock_Difference",
    "Inventory_Status",
    "Revenue_Per_Unit"
]].head())
Task 2: Transform Data
Retail datasets often contain raw numerical and textual data that may not be easy to interpret directly.
For example:
To make data easier to understand and analyze, analysts perform data transformation.
What is Data Transformation?
Data Transformation is the process of converting data from one format or structure into another format that is more useful for analysis.
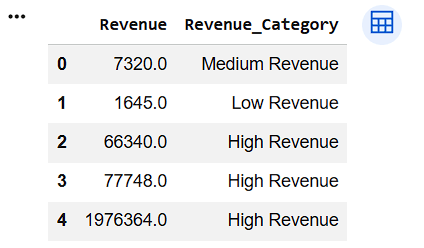
Transform Revenue into Revenue Category
1
df["Revenue_Category"] = np.where(
    df["Revenue"] < 5000,
    "Low Revenue",
    np.where(
        df["Revenue"] < 10000,
        "Medium Revenue",
        "High Revenue"
    )
)

df[["Revenue", "Revenue_Category"]].head()
np.where() when we want to create a new column based on a condition.
2
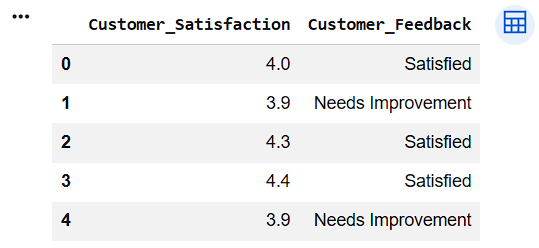
Transform Customer Satisfaction Ratings
df["Customer_Feedback"] = np.where(
    df["Customer_Satisfaction"] >= 4,
    "Satisfied",
    "Needs Improvement"
)

df[[
    "Customer_Satisfaction",
    "Customer_Feedback"
]].head()
3
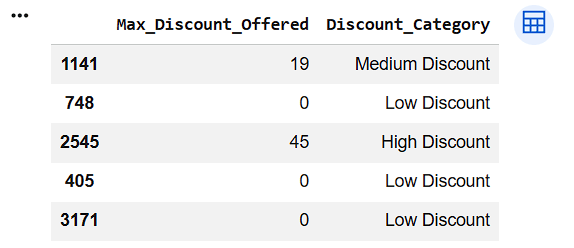
Create Discount Category
df["Discount_Category"] = np.where(
    df["Max_Discount_Offered"] < 10,
    "Low Discount",
    np.where(
        df["Max_Discount_Offered"] < 20,
        "Medium Discount",
        "High Discount"
    )
)

df[["Max_Discount_Offered", "Discount_Category"]].sample(5)
4
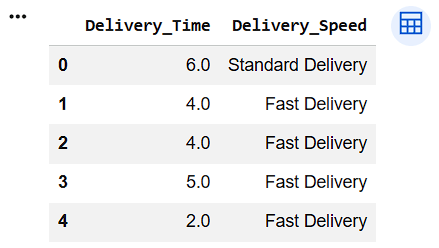
Create Delivery Speed Category
df["Delivery_Speed"] = np.where(
df["Delivery_Time"] <= 5,
"Fast Delivery",
"Standard Delivery"
)
df[[
"Delivery_Time",
"Delivery_Speed"
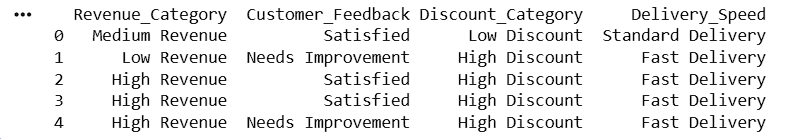
]].head()Display Transformed Columns
5
print(df[[
    "Revenue_Category",
    "Customer_Feedback",
    "Discount_Category",
    "Delivery_Speed"
]].head())
6
Check Dataset Information
df.info()
Great job!
You have successfully completed your lab on Create and Transform Features for Insights. In this lab, you have: Created new columns using existing data, Transformed numerical data into meaningful categories, Created business-friendly labels for reporting, Prepared the dataset for advanced analysis and visualization
You are now ready to move to the next stage of Junior Data Analyst.
Checkpoint
Git Push
git push origin branchNameNext-Lab Preparation
Topic: Decoding Your Data
1) Unraveling the World of Data and Its Insights
2) The Basics of Statistics: Descriptive Insights
3) Measuring Data Spread: Dispersion Insights
By Content ITV


