


Content ITV PRO
This is Itvedant Content department
Learning Outcome
6
Apply multiple rules and manage rule priority
5
Apply color scales and data bars for visual analysis
4
Use icon sets to represent performance levels
3
Apply formula-based Conditional Formatting
2
Differentiate between basic and advanced Conditional Formatting
1
Explain what Advanced Conditional Formatting is
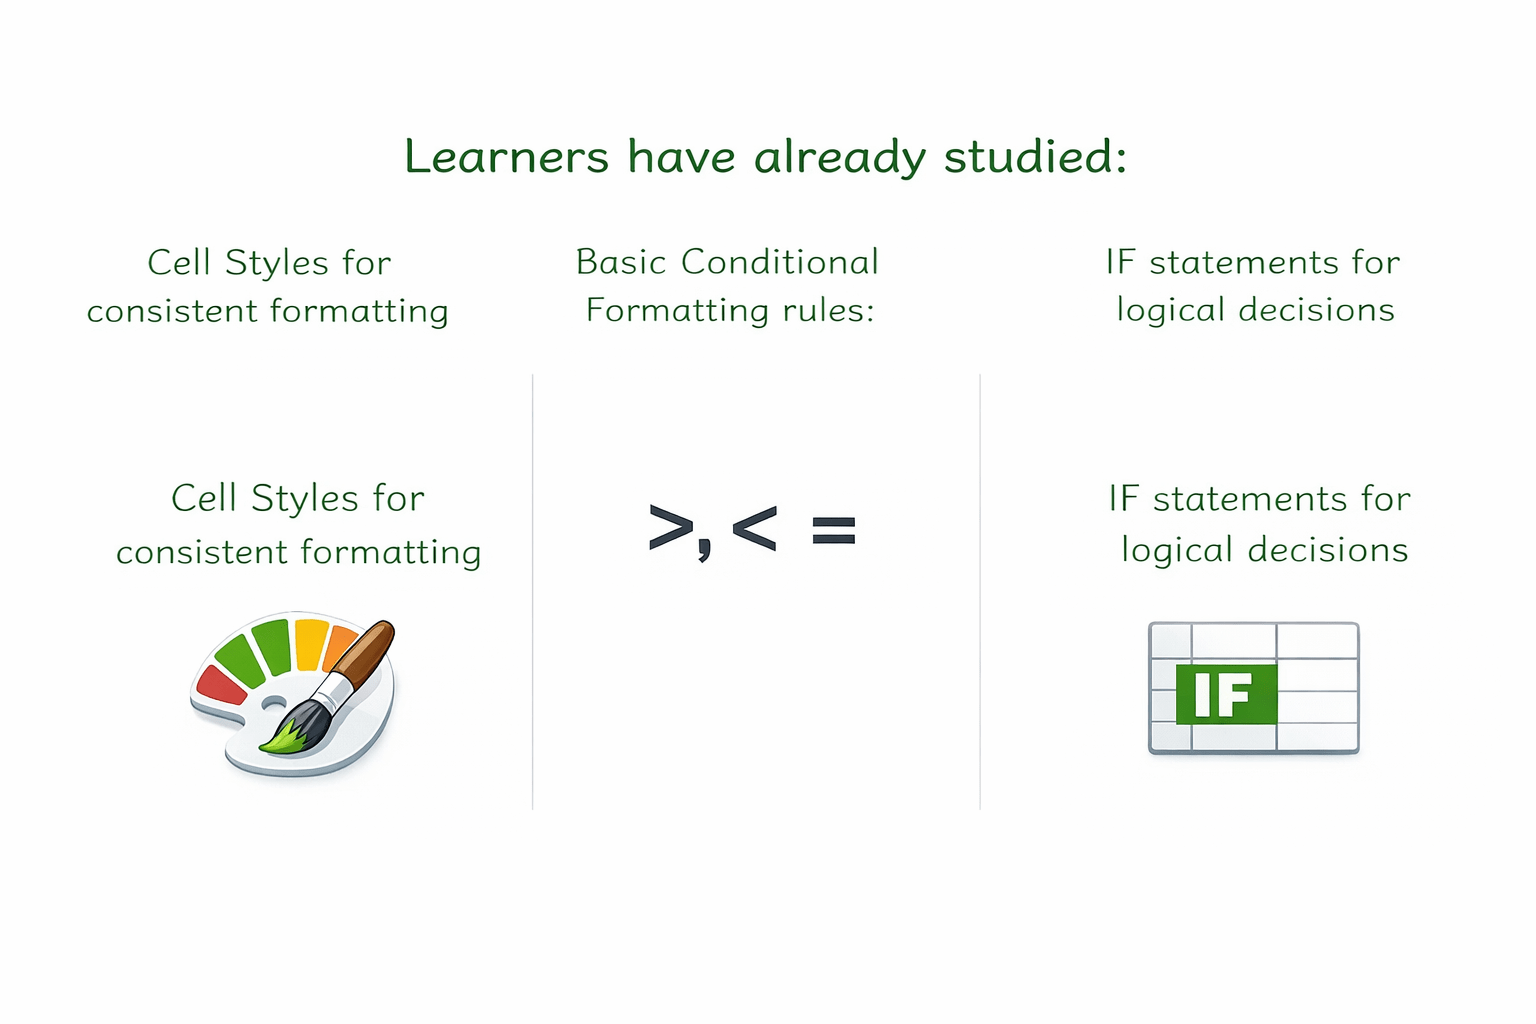
Learners have already studied:
Cell Styles for consistent formatting
Basic Conditional Formatting rules:
IF statements for logical decisionS
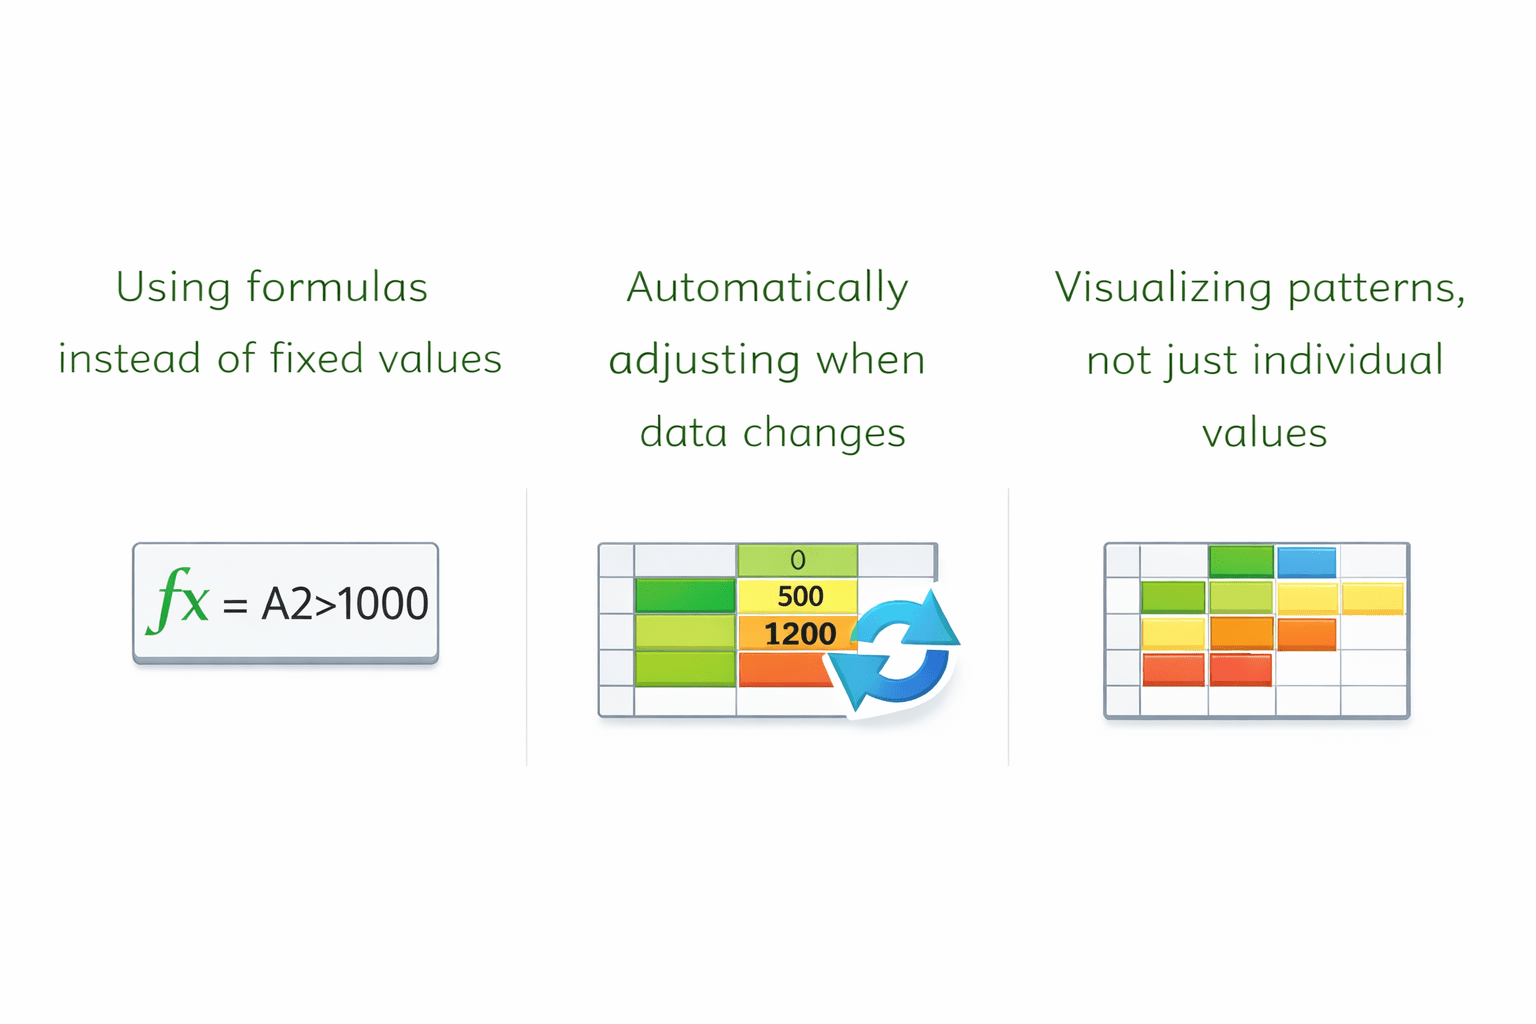
Advanced Conditional Formatting builds on this by:
Using formulas instead of fixed values
Automatically adjusting when data changes
Visualizing patterns, not just individual values
Think about how you use highlighters in your notebook.
You don’t recheck everything every time.
Your eyes immediately know where to look.
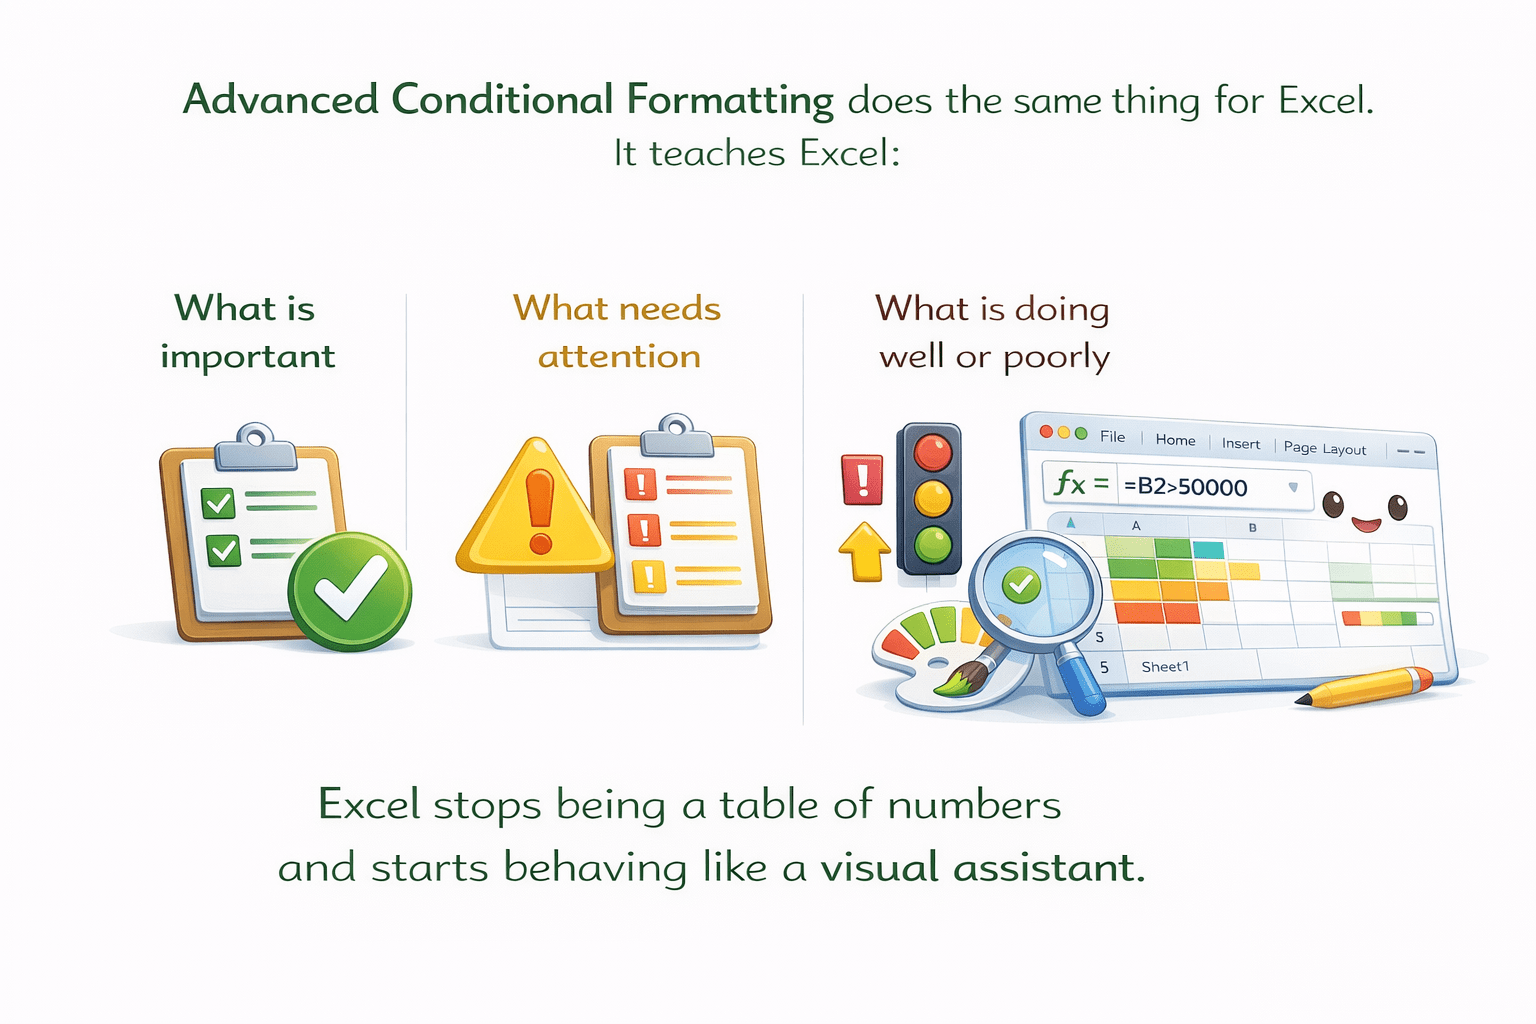
Advanced Conditional Formatting does the same thing for Excel.
It teaches Excel:
What is important?
What needs attention
What is doing well or poorly
Excel stops being a table of numbers
and starts behaving like a visual assistant.
Basic Conditional Formatting
answers simple questions:
Is it less than Y?
Is the value greater than X?
But real data needs answers like:
Is this due today?
Is this value above average?
Is this product performing better than others?
To answer these questions, Excel uses:
That’s where Advanced Conditional Formatting comes in.
Formulas
Visual indicators
Dynamic rules
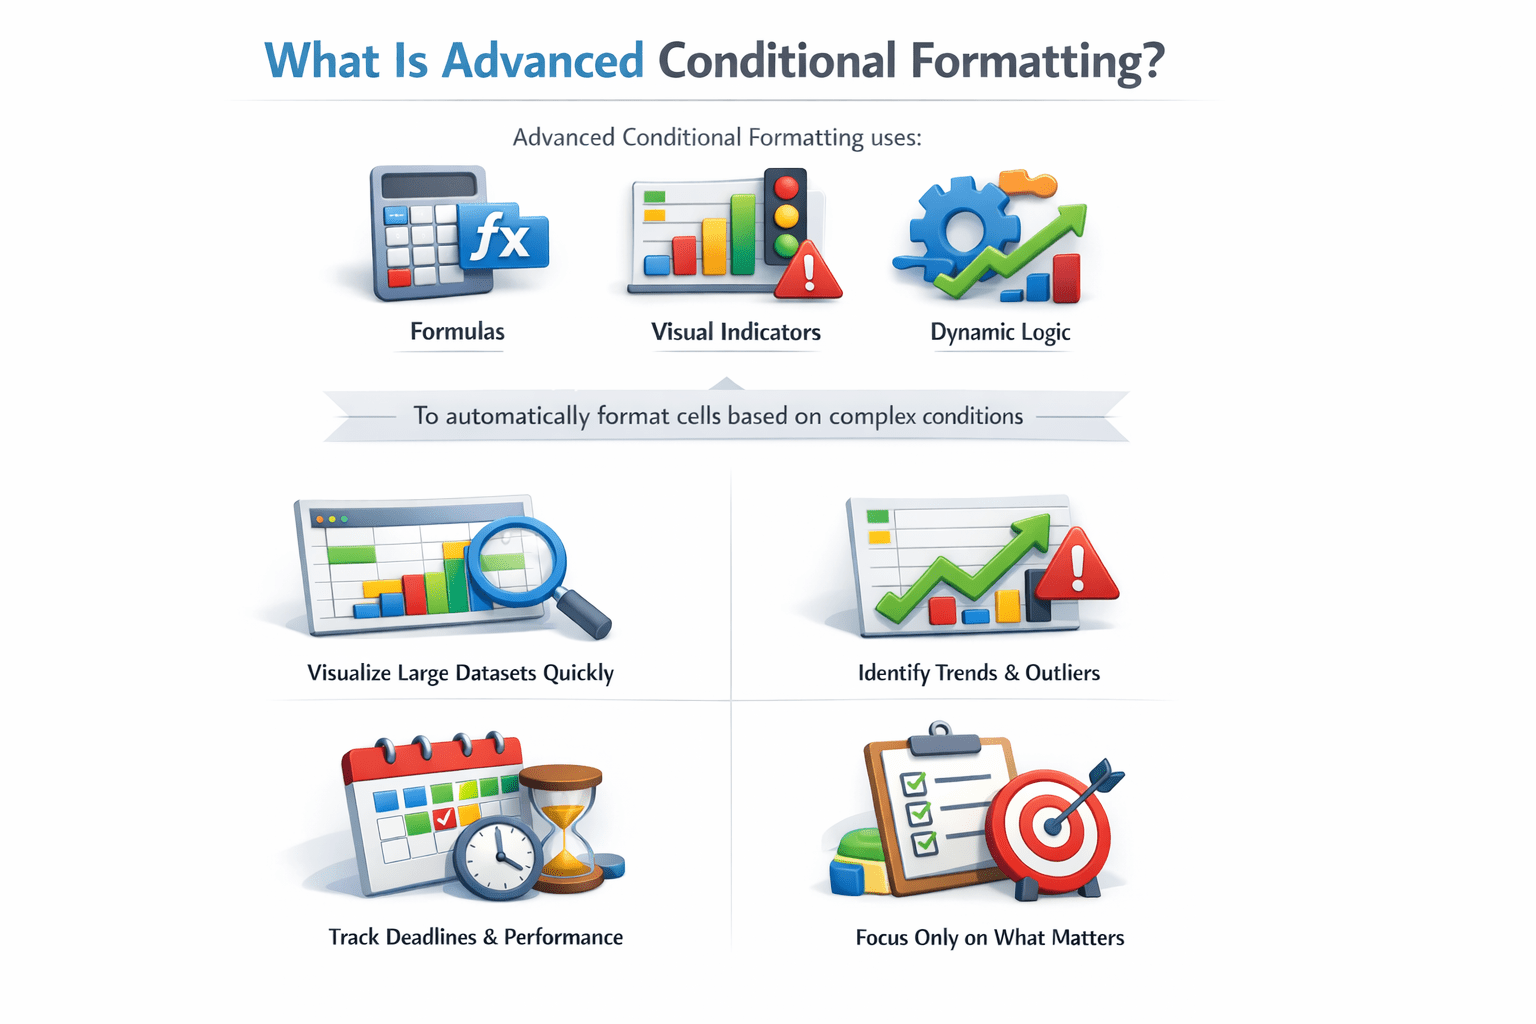
What Is Advanced Conditional Formatting?
to automatically format cells based on complex conditions.
Formulas
Visual indicators
Dynamic logic
It helps users:
Visualize large datasets quickly
Identify trends and outliers
Track deadlines and performance
Focus only on what matters
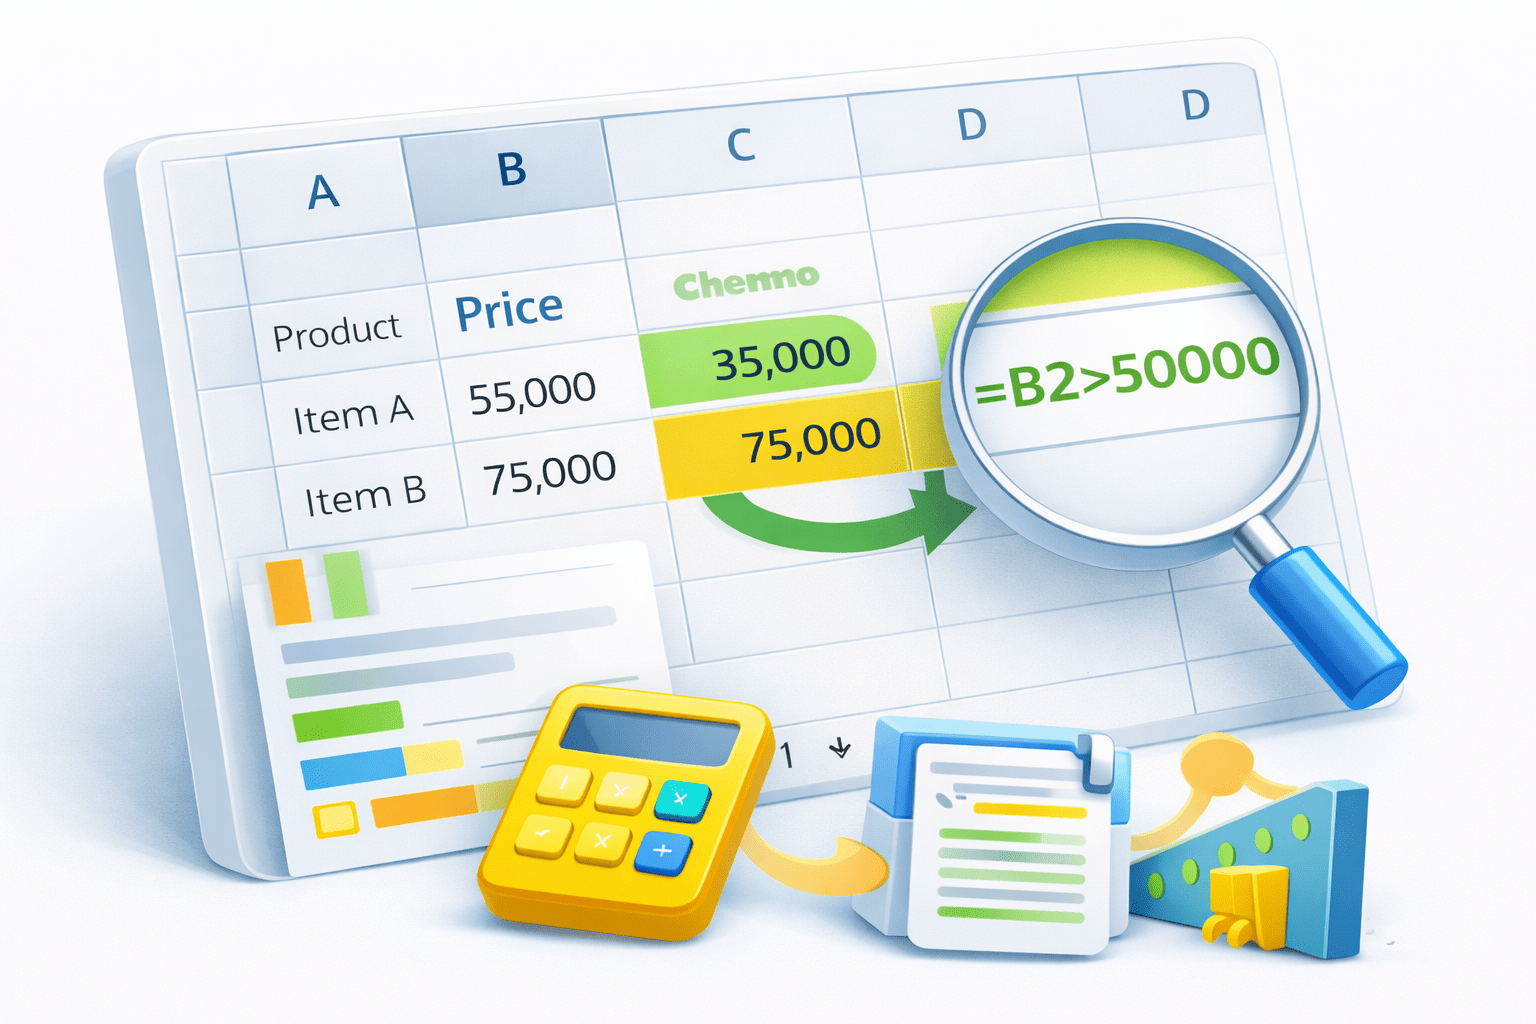
Formula-Based Conditional Formatting
Think of Custom Rules in a Game
Instead of fixed rules, you decide:
What It Does
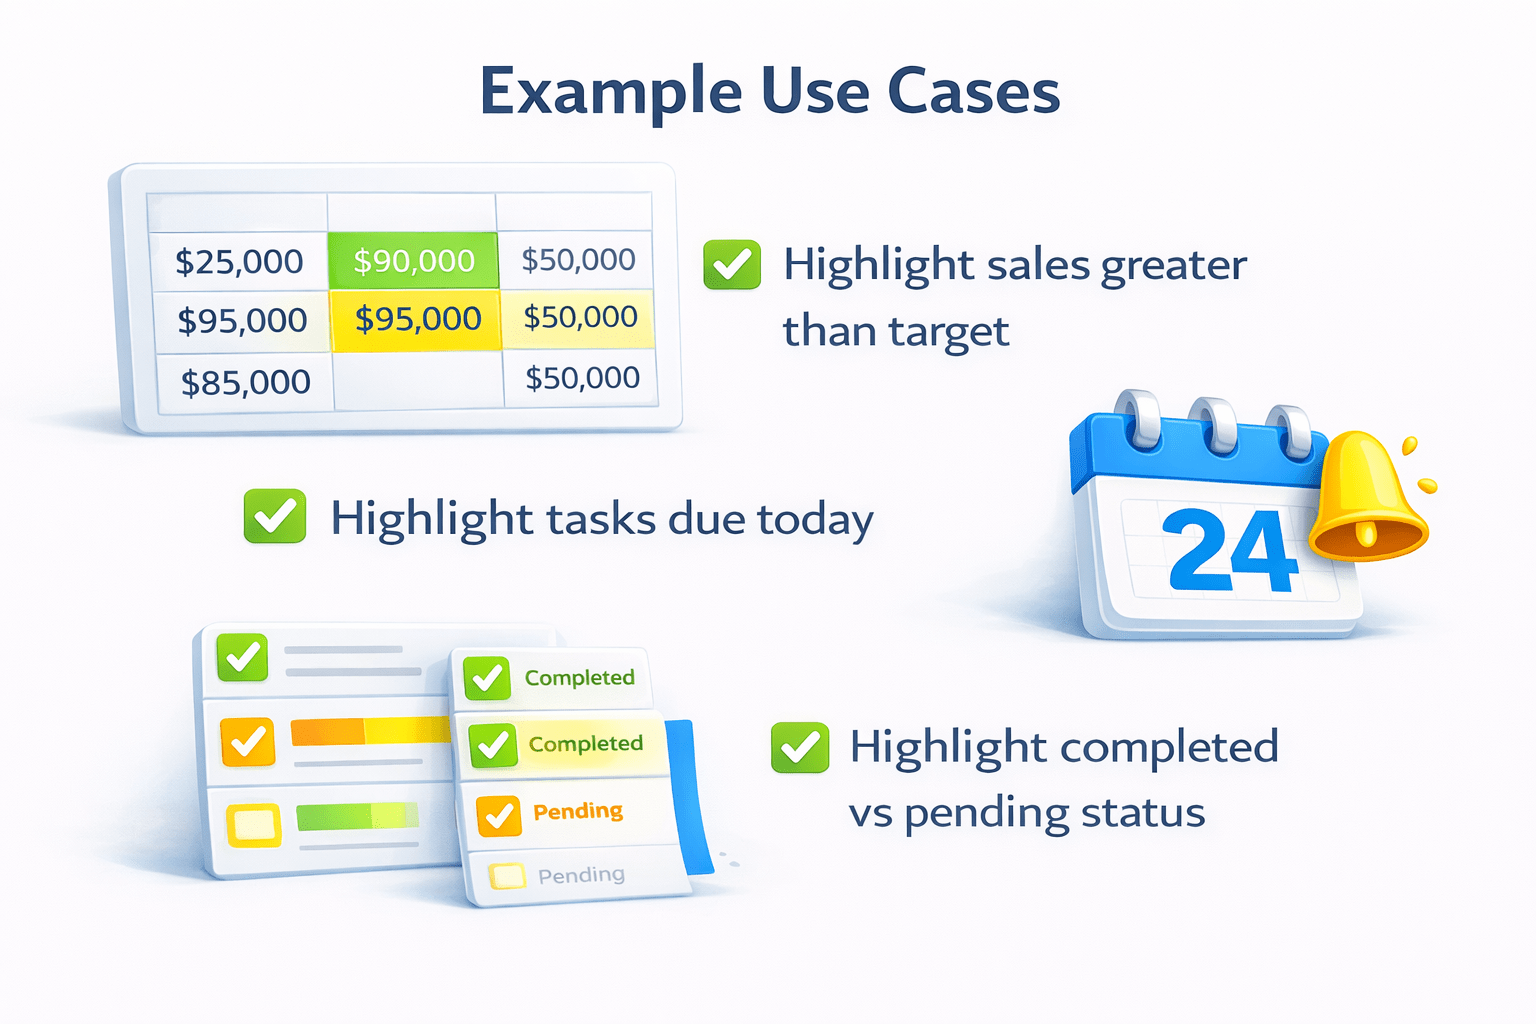
Example Use Case:
Highlight sales greater than target
Highlight tasks due today
Highlight completed vs pending status
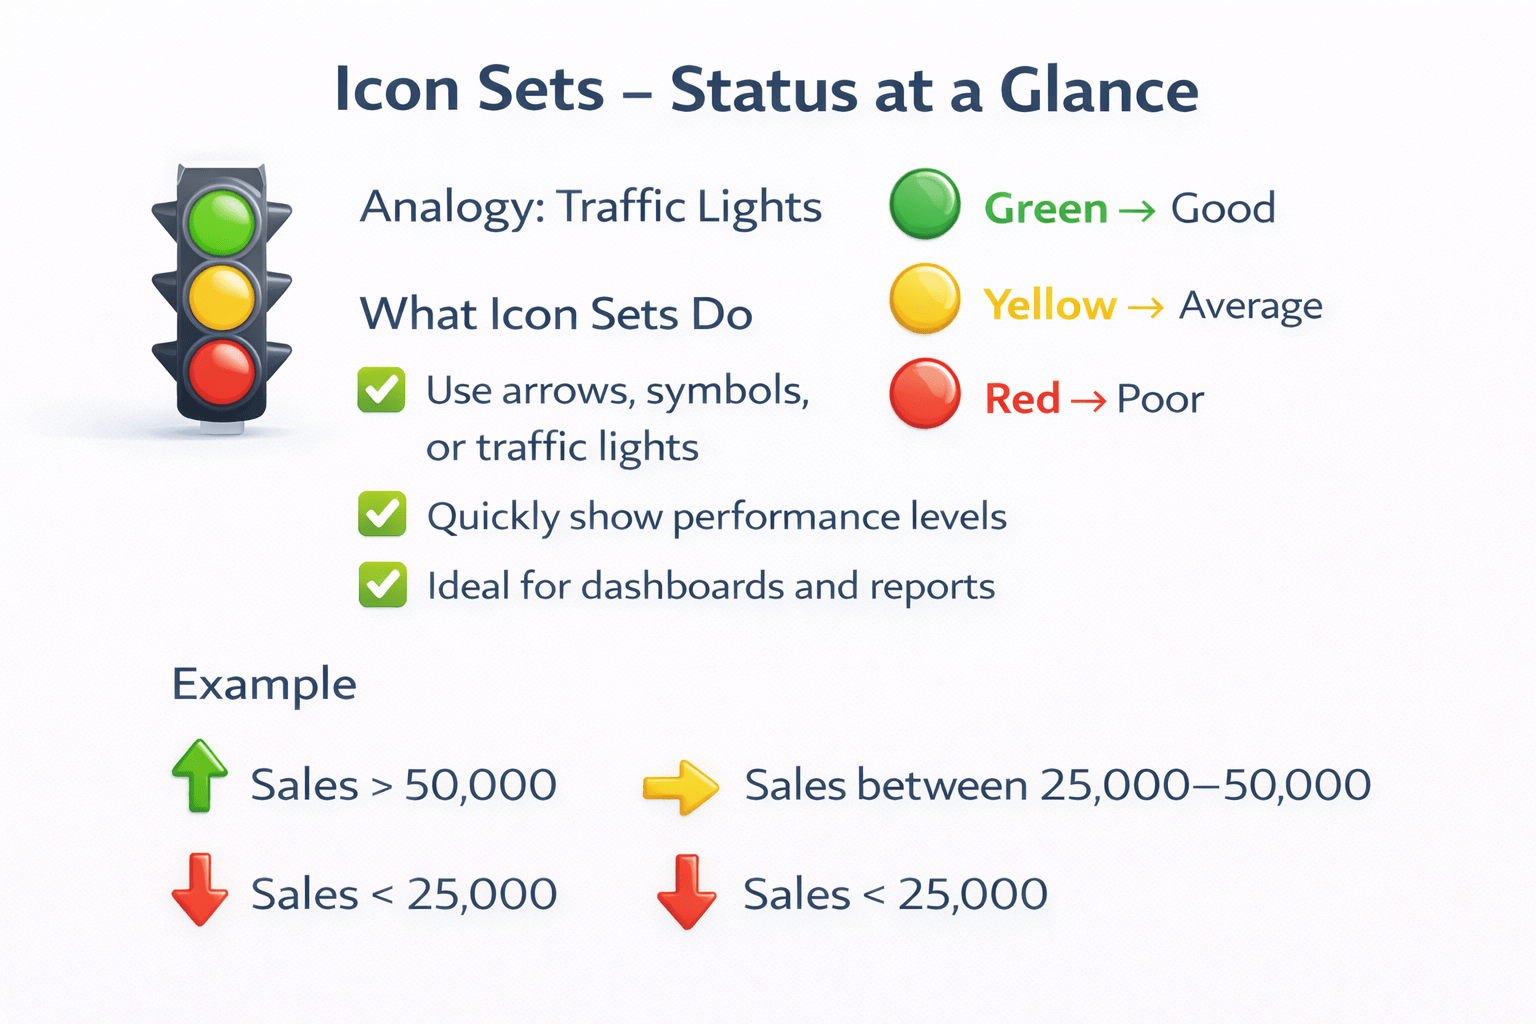
Icon Sets – Status at a Glance
Imagine: Traffic Lights
What Icon Sets Do:
Use arrows, symbols, or traffic lights
Quickly show performance levels
Ideal for dashboards and reports
Example:
Sales > 50,000
Sales between 25,000–50,000
Sales < 25,000
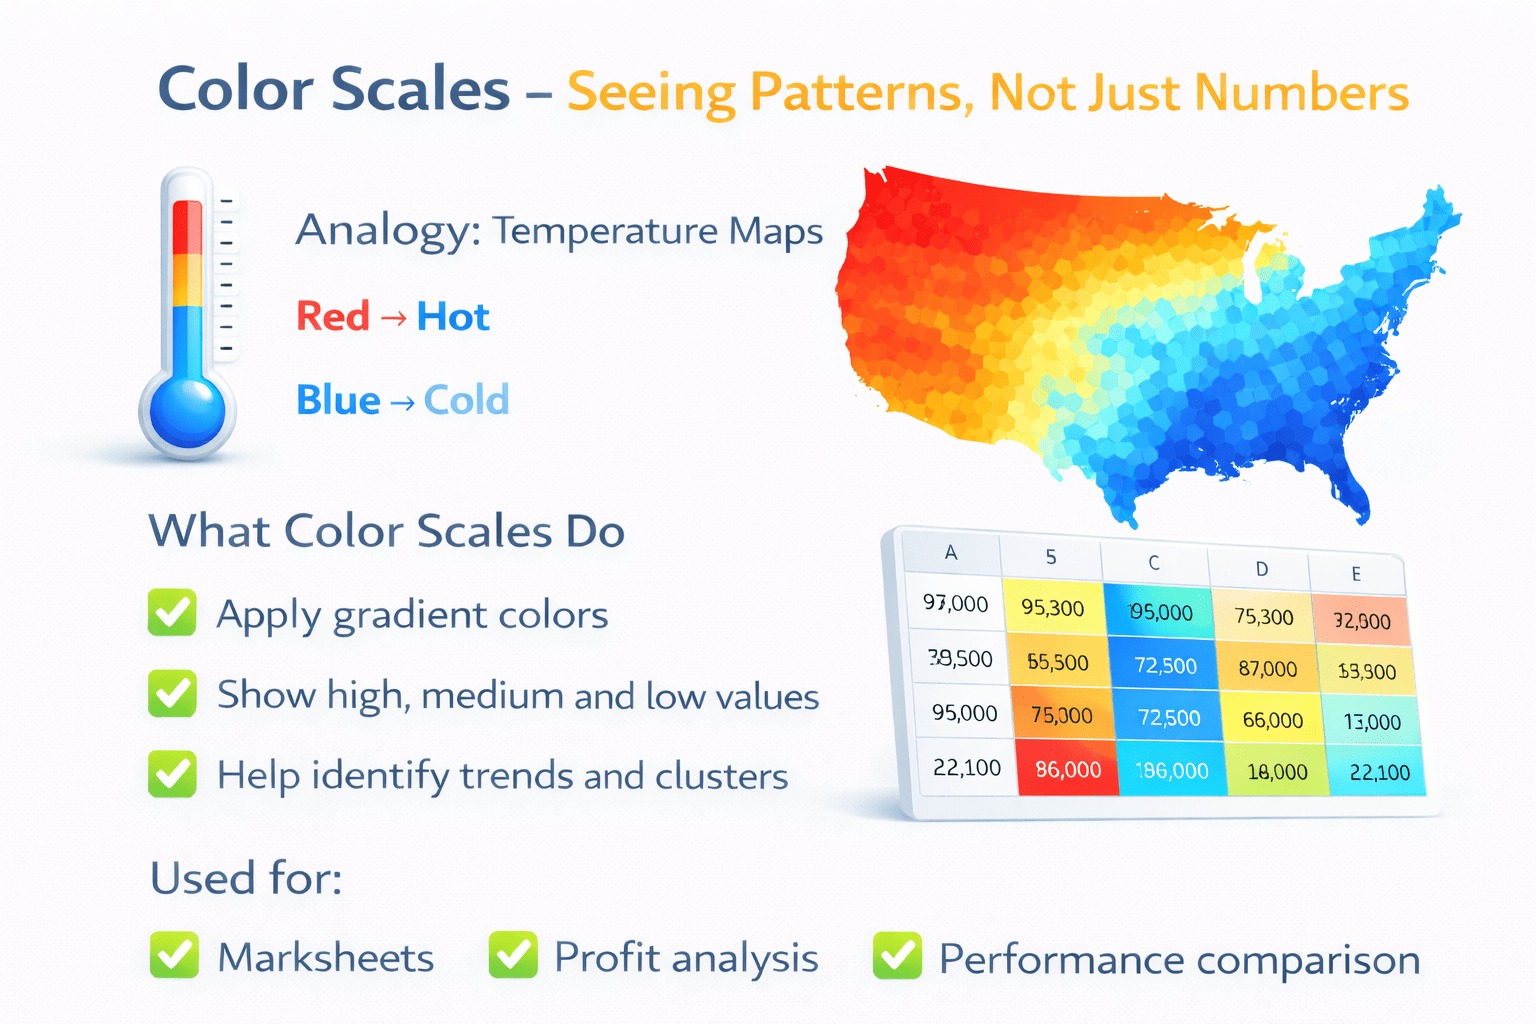
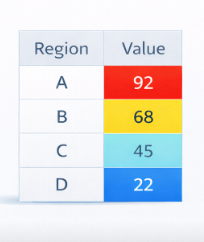
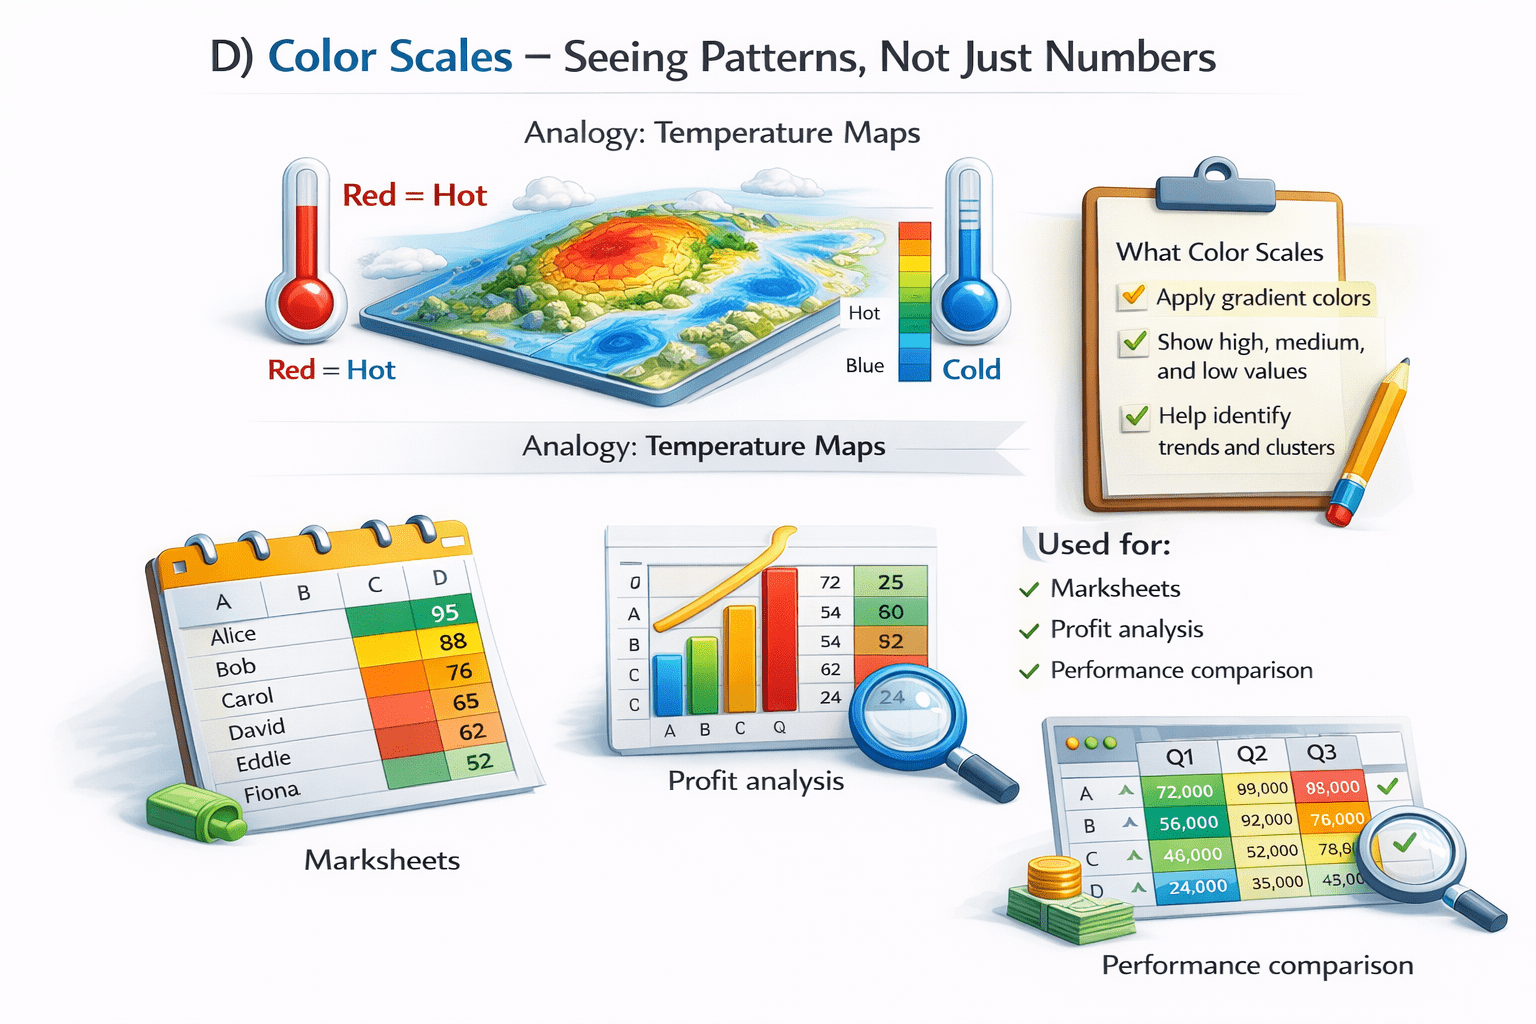
Color Scales – Seeing Patterns, Not Just Numbers
Think of Temperature Maps
Red
Blue
Hot
Cold
What Color Scales Do:
Heat map
Help identify trends and clusters
Used for:
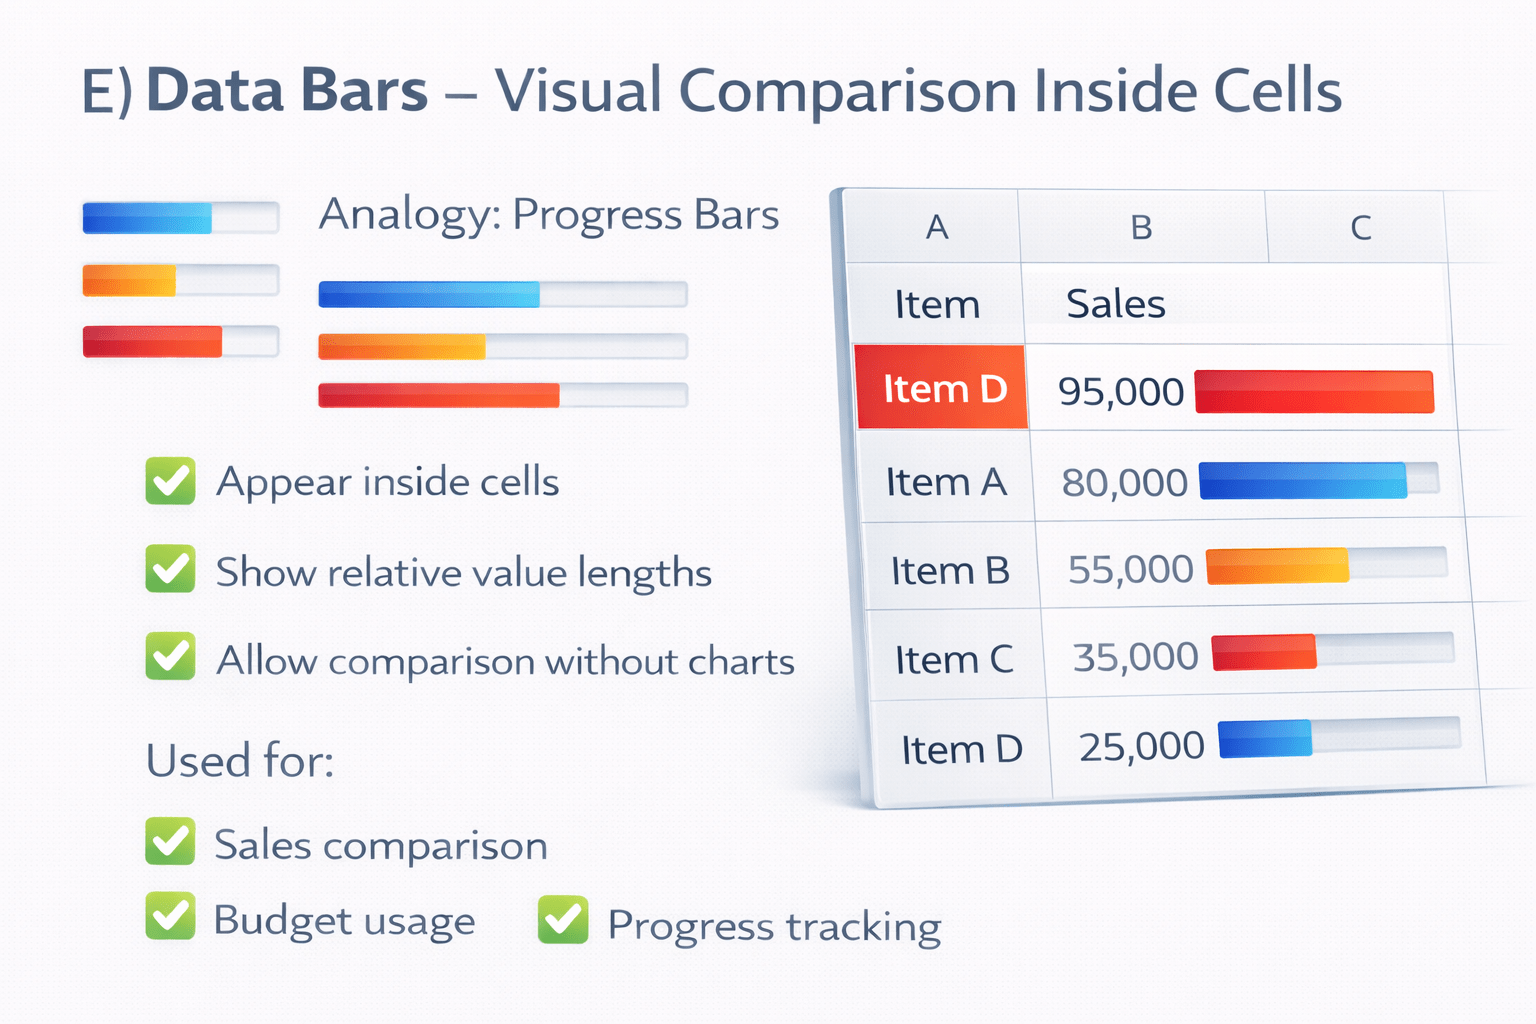
Data Bars – Visual Comparison Inside Cells
Data bars:
Appear inside cells
Show relative value lengths
Allow comparison without charts
Used for :
Sales comparison
Budget usage
Progress tracking
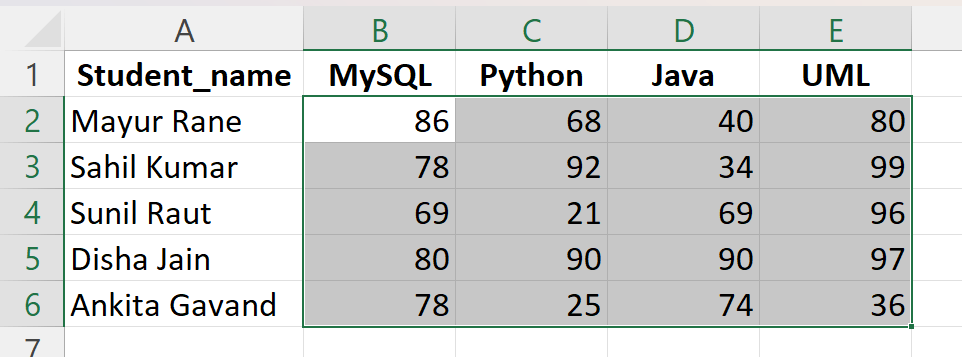
Applying Advanced Conditional Formatting
Steps:-
1
Select the data range
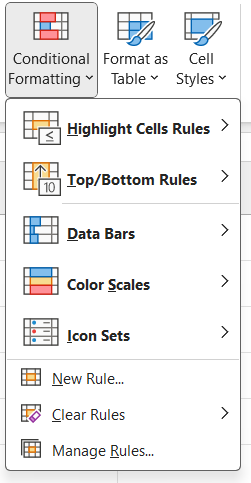
2
Go to Home → Conditional Formatting
3
Choose:
Data Bars
4
Define conditions and formatting
5
Apply and review results
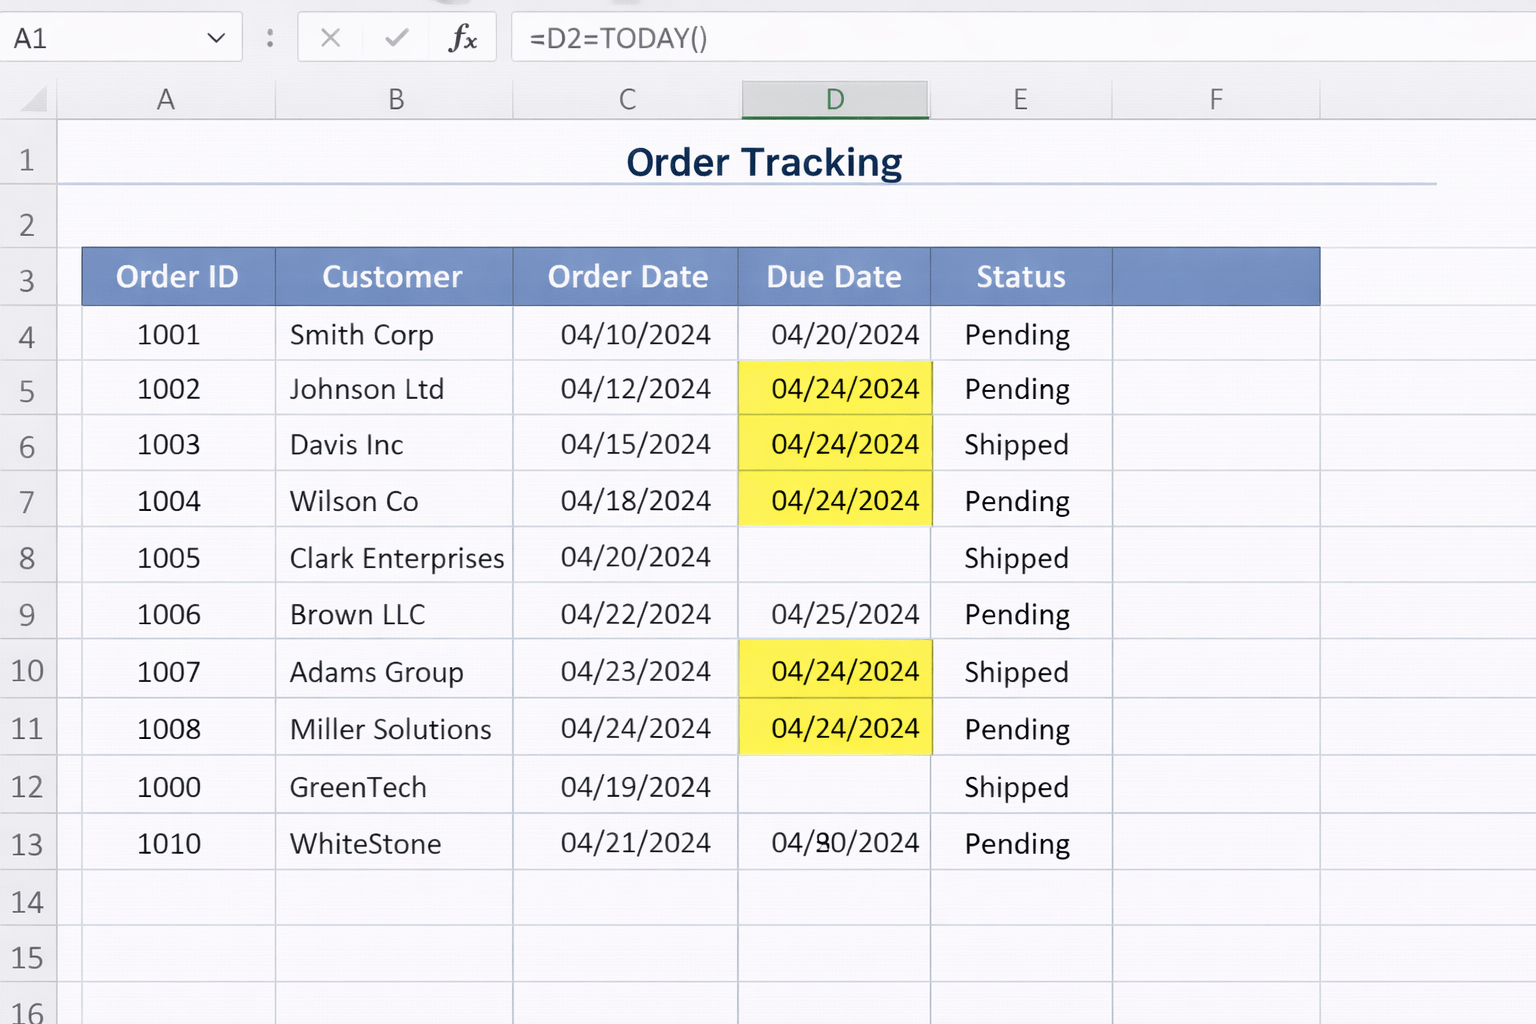
Practical Scenario 1: Highlight Today’s Due Orders
Goal: Highlight all orders due today
Formula Used
=D4=TODAY()
Result:
All matching dates highlighted automatically
Changes daily without manual updates
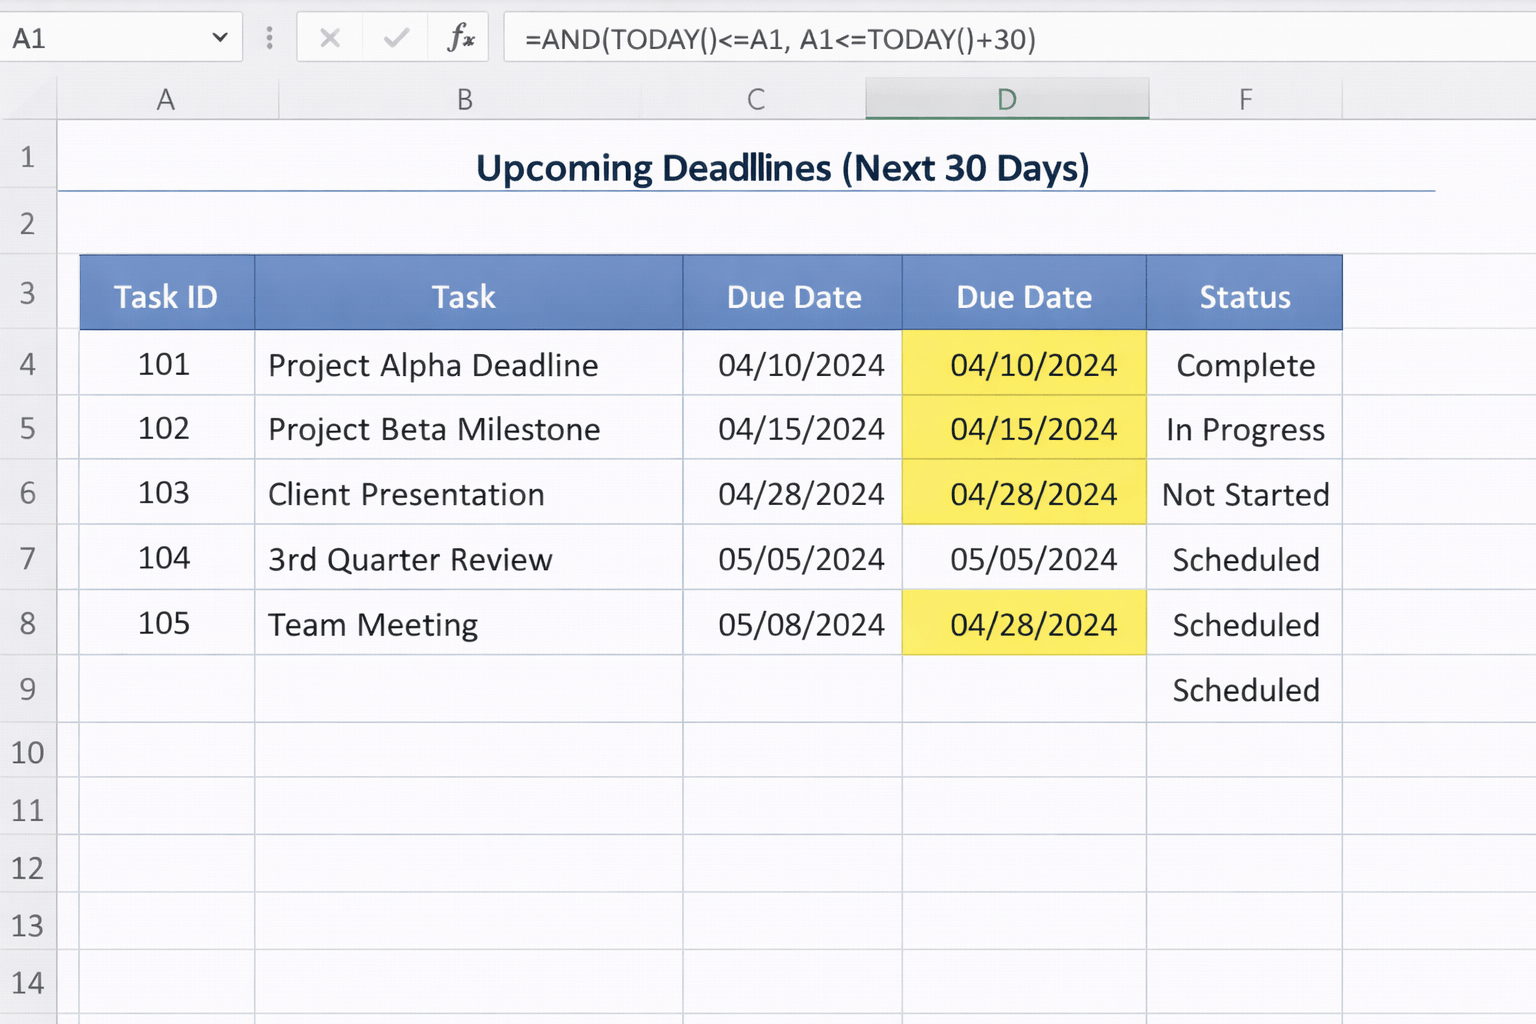
Practical Scenario 2: Highlight Upcoming Deadlines (Next 30 Days)
Formula
=AND(TODAY()<=D1, D1<=TODAY()+30)
Use case:
Project deadlines
Task tracking
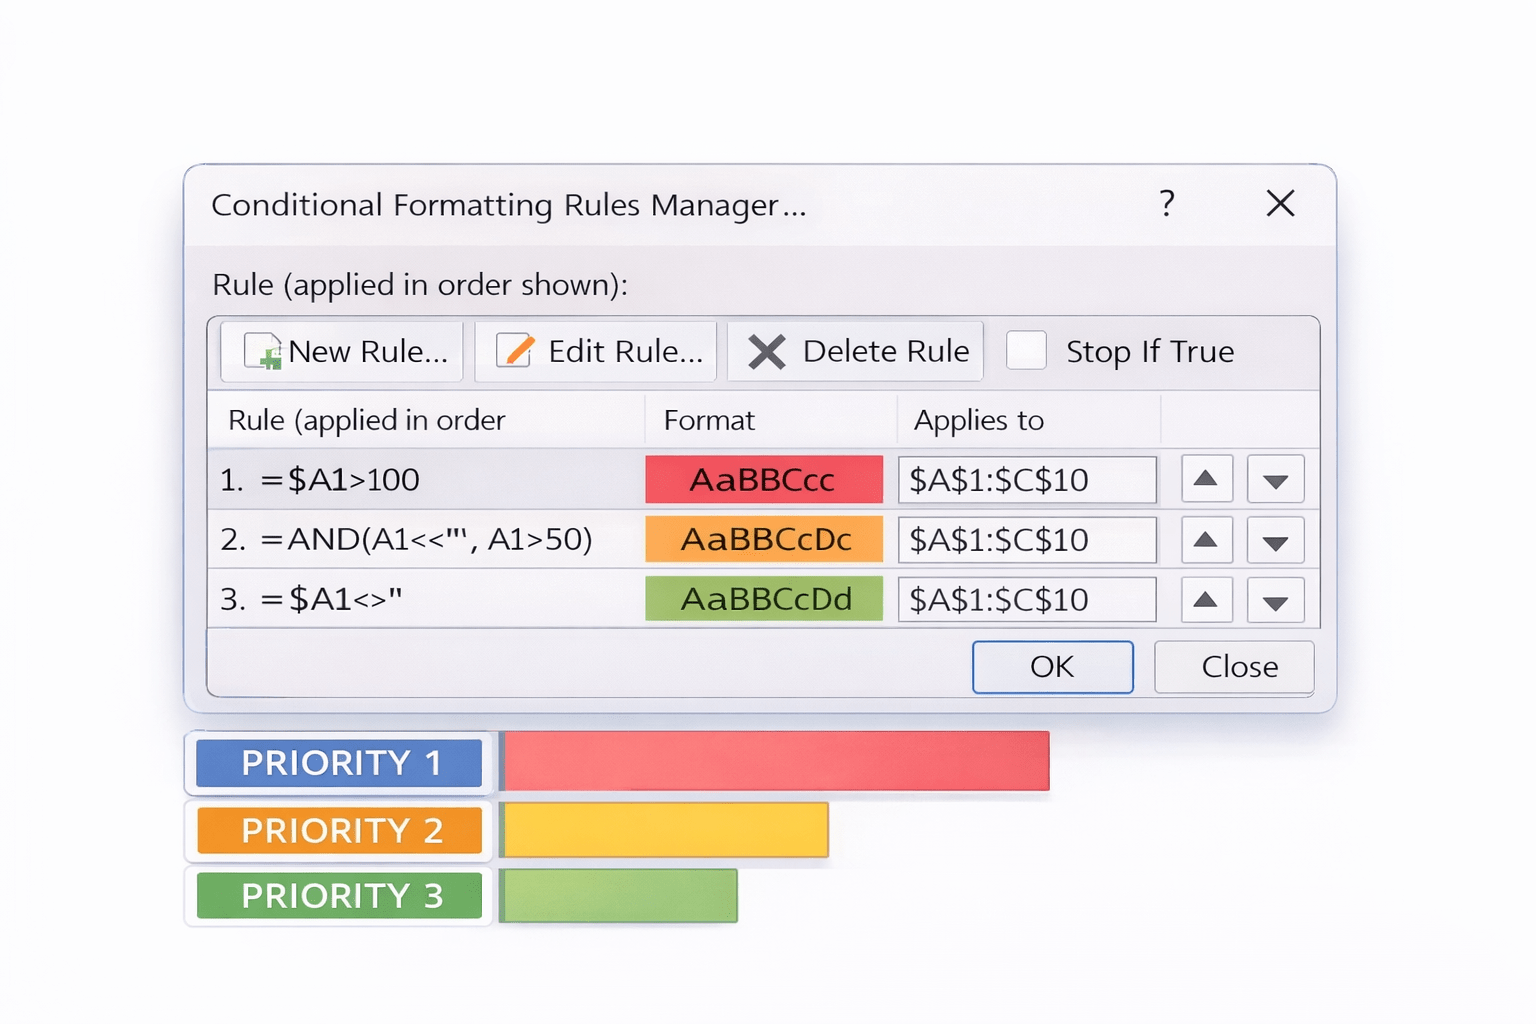
Multiple Rules and Rule Priority
Excel allows multiple rules on the same data
Rules are processed top to bottom
Priority can be adjusted
Important to avoid:
Conflicting formats
Over-formatting large ranges
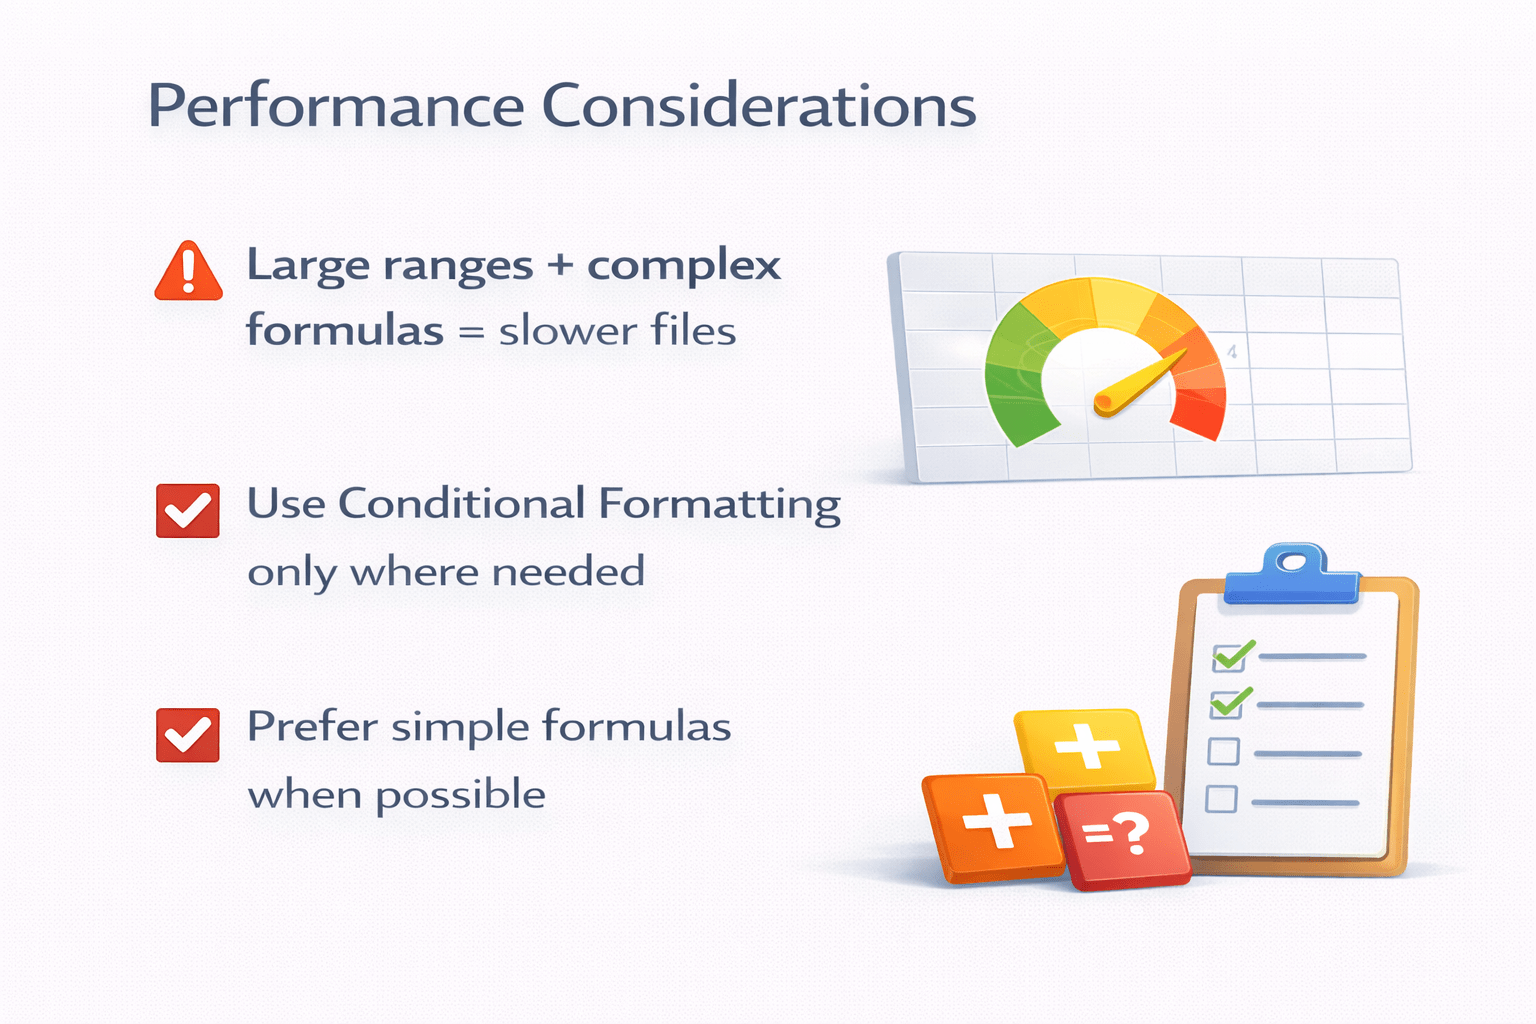
Performance Considerations
Large ranges + complex formulas = slower files
Use Conditional Formatting only where needed
Prefer simple formulas when possible
Summary
5
Data bars allow quick comparison
4
Color scales reveal patterns
3
Icon sets show status instantly
2
Formula-based rules provide flexibility
1
Advanced Conditional Formatting uses formulas and visuals
Quiz
Which feature uses arrows or symbols to show performance?
A. Color Scales
B. Data Bars
C. Icon Sets
D. Cell Styles
Quiz-Answer
C. Icon Sets
Which feature uses arrows or symbols to show performance?
A. Color Scales
B. Data Bars
D. Cell Styles
By Content ITV


