


Content ITV PRO
This is Itvedant Content department
Use this slide if there is no Heading
Note - Create Content inside Red Layout
[Delete Red Outline After creating slide]
Learning Outcome(Slide2)
6
Basics of branding and messaging
5
Target audience and segmentation
4
Different marketing channels
3
Creating value for customers
2
Understanding customer needs
1
What marketing means ?
Choose cool, soft colors instead of vibrant colors
Max 6 Points for Summary & Min 4
Topic Name-Recall(Slide3)
Hook/Story/Analogy(Slide 4)
Transition from Analogy to Technical Concept(Slide 5)
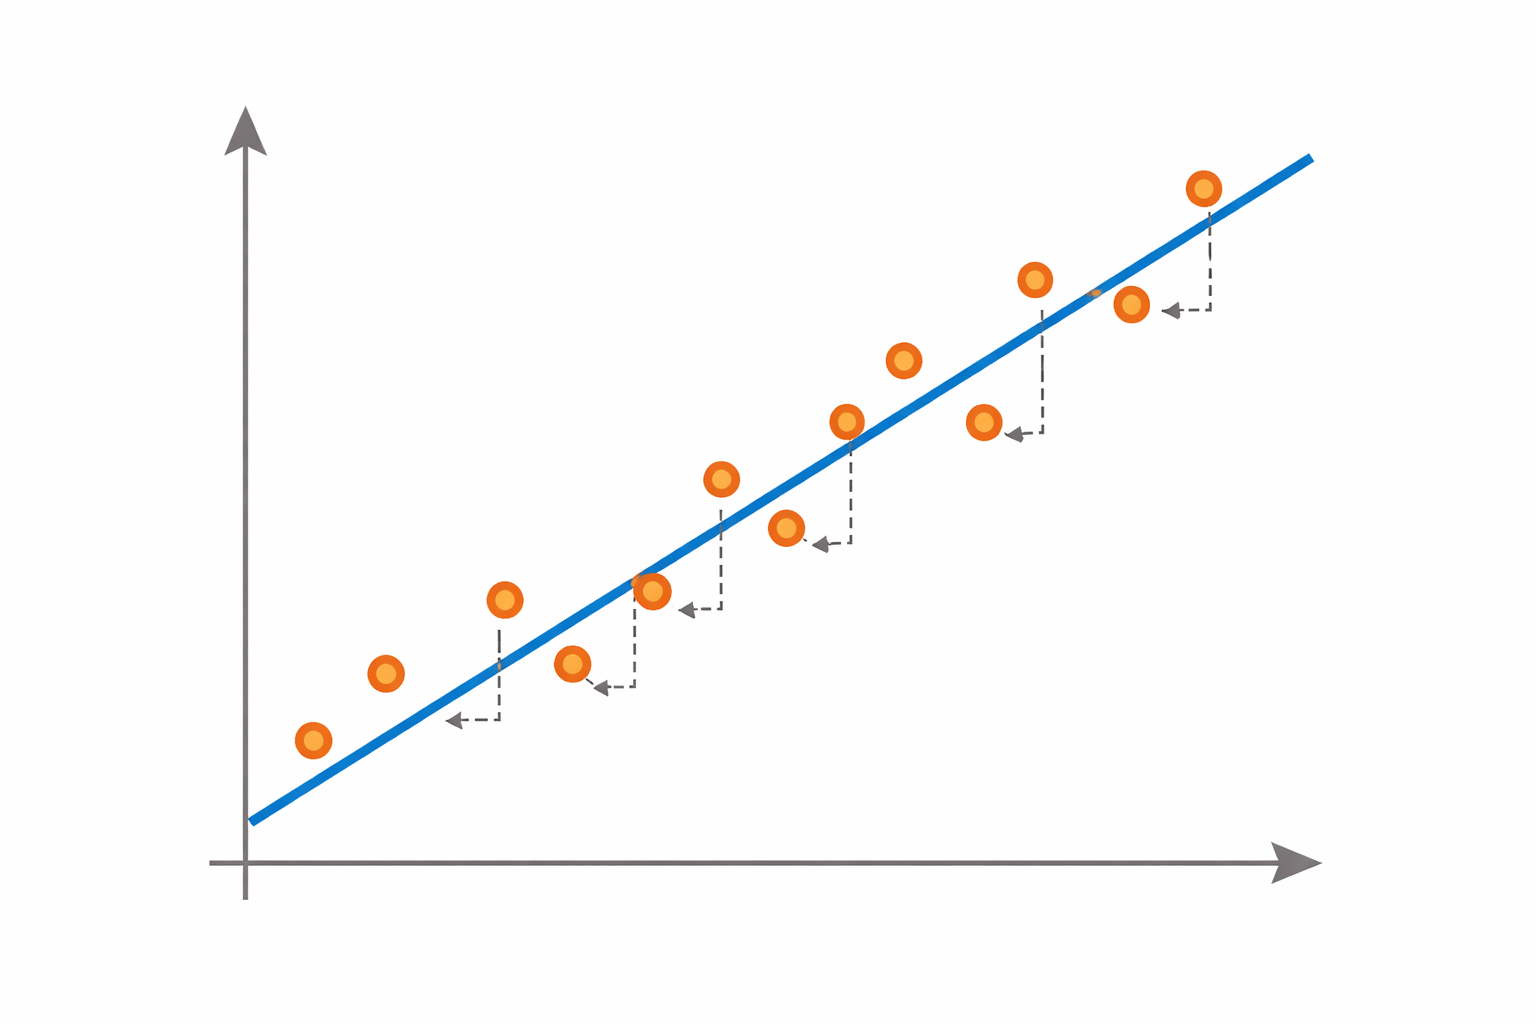
Understanding Bias
Definition
Characteristics of high bias:
Model makes strong simplifying assumptions
High training error
High testing error
This situation results in underfitting.
Applying a straight-line model to nonlinear data.
Methods to Reduce Bias
Use more complex models
Increase model capacity
Add more relevant features
Include relevant predictors
Increase model flexibility
Reduce constraints
Example:
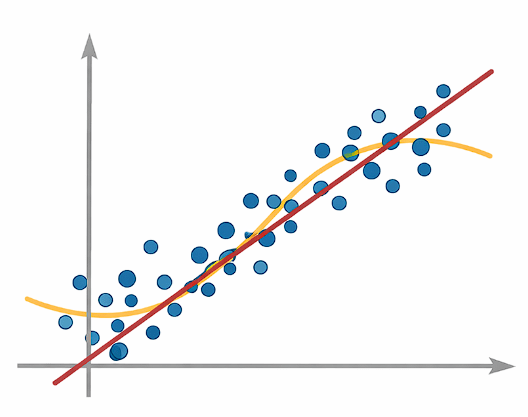
Understanding Variance
Definition
Variance measures how much the model's predictions change when the training dataset changes.
High variance occurs when a model is too complex.
Characteristics of high bias:
Very low training error
High test error
Model learns noise in the data
Example:
A high-degree polynomial regression model that closely follows every training data point.
Methods to Reduce Variance
Reduce model complexity
Use regularization techniques
Increase training data
Add penalty terms
More samples reduce sensitivity
Use ensemble methods such as bagging
Use bagging techniques
Simplify model structure
Total Prediction Error
The total prediction error of a model can be expressed as:
Total Error = Bias² + Variance + Irreducible Error
Where:
Bias²
error due to model assumptions
Variance
sensitivity to training data
Irreducible Error
The goal of machine learning is to minimize Bias² + Variance.
Bias–Variance Tradeoff
As model complexity changes:
Increasing complexity
Bias
Variance
Decrease Complexity
Bias
Variance
Conversely:
Simpler models have higher bias but lower variance
The optimal model lies at the balance point where total error is minimized.
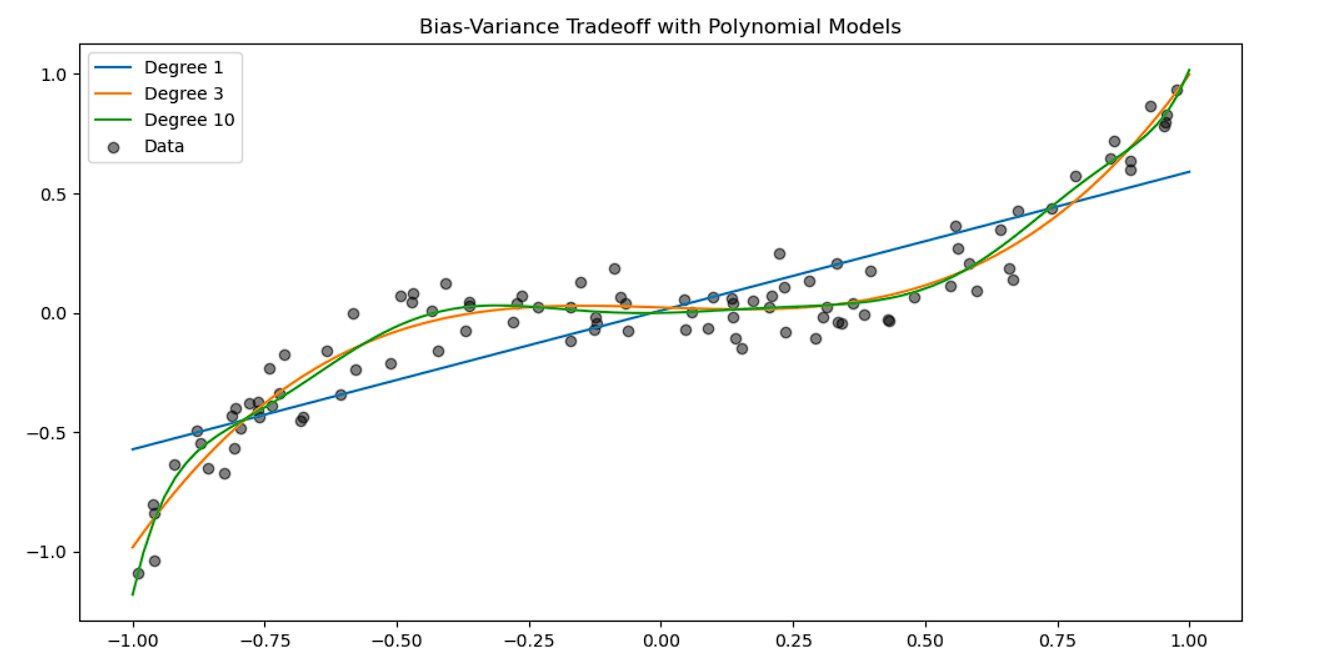
Implementation in Python
The bias–variance tradeoff can be visualized by fitting models with different complexities.
Step 1 — Import required libraries
import numpy as np
import matplotlib.pyplot as plt
from sklearn.linear_model import LinearRegression
from sklearn.preprocessing import PolynomialFeatures
Step 2 — Generate synthetic data
np.random.seed(0)

X = np.sort(np.random.rand(100, 1) * 2 - 1, axis=0)
y = X**3 + np.random.randn(100, 1) * 0.1
Explanation:
Step 3 — Generate test points for visualization
X_test = np.linspace(-1, 1, 100).reshape(-1, 1)These points help visualize how models behave across the input range.
Step 4 — Train models with different complexities
plt.figure(figsize=(12,6))
for degree in [1, 3, 10]:
    poly = PolynomialFeatures(degree)
    X_poly = poly.fit_transform(X)
    X_test_poly = poly.transform(X_test)
    model = LinearRegression()
    model.fit(X_poly, y)
    y_pred = model.predict(X_test_poly)
    plt.plot(X_test, y_pred,
    label=f"Degree {degree}")
plt.scatter(X, y, color='black',
alpha=0.5, label="Data")
plt.legend()
plt.title("Bias-Variance Tradeoff with Polynomial Models")
plt.show()
Interpretation:
Degree 1 model → High bias (underfitting)
Degree 3 model → Balanced bias and variance
Degree 10 model → High variance (overfitting)
This visualization demonstrates how increasing model complexity affects bias and variance.
Summary
5
High variance leads to overfitting
4
High bias leads to underfitting
3
Variance is error caused by overly complex models
2
Bias is error caused by overly simple models
1
Bias–Variance Tradeoff explains two main sources of model error
Quiz
High bias usually results in:
A. Overfitting
B. Underfitting
C. Data leakage
D. Feature scaling
Quiz-Answer
High bias usually results in:
A. Overfitting
B. Underfitting
C. Data leakage
D. Feature scaling
By Content ITV


