


Content ITV PRO
This is Itvedant Content department
Learning Outcome
5
Know how both tools fit into the monitoring workflow
4
Understand the basic purpose of Grafana
3
Understand the basic purpose of Prometheus
2
Identify Prometheus and Grafana as monitoring tools
1
Understand why monitoring tools are required
Earlier, we learned
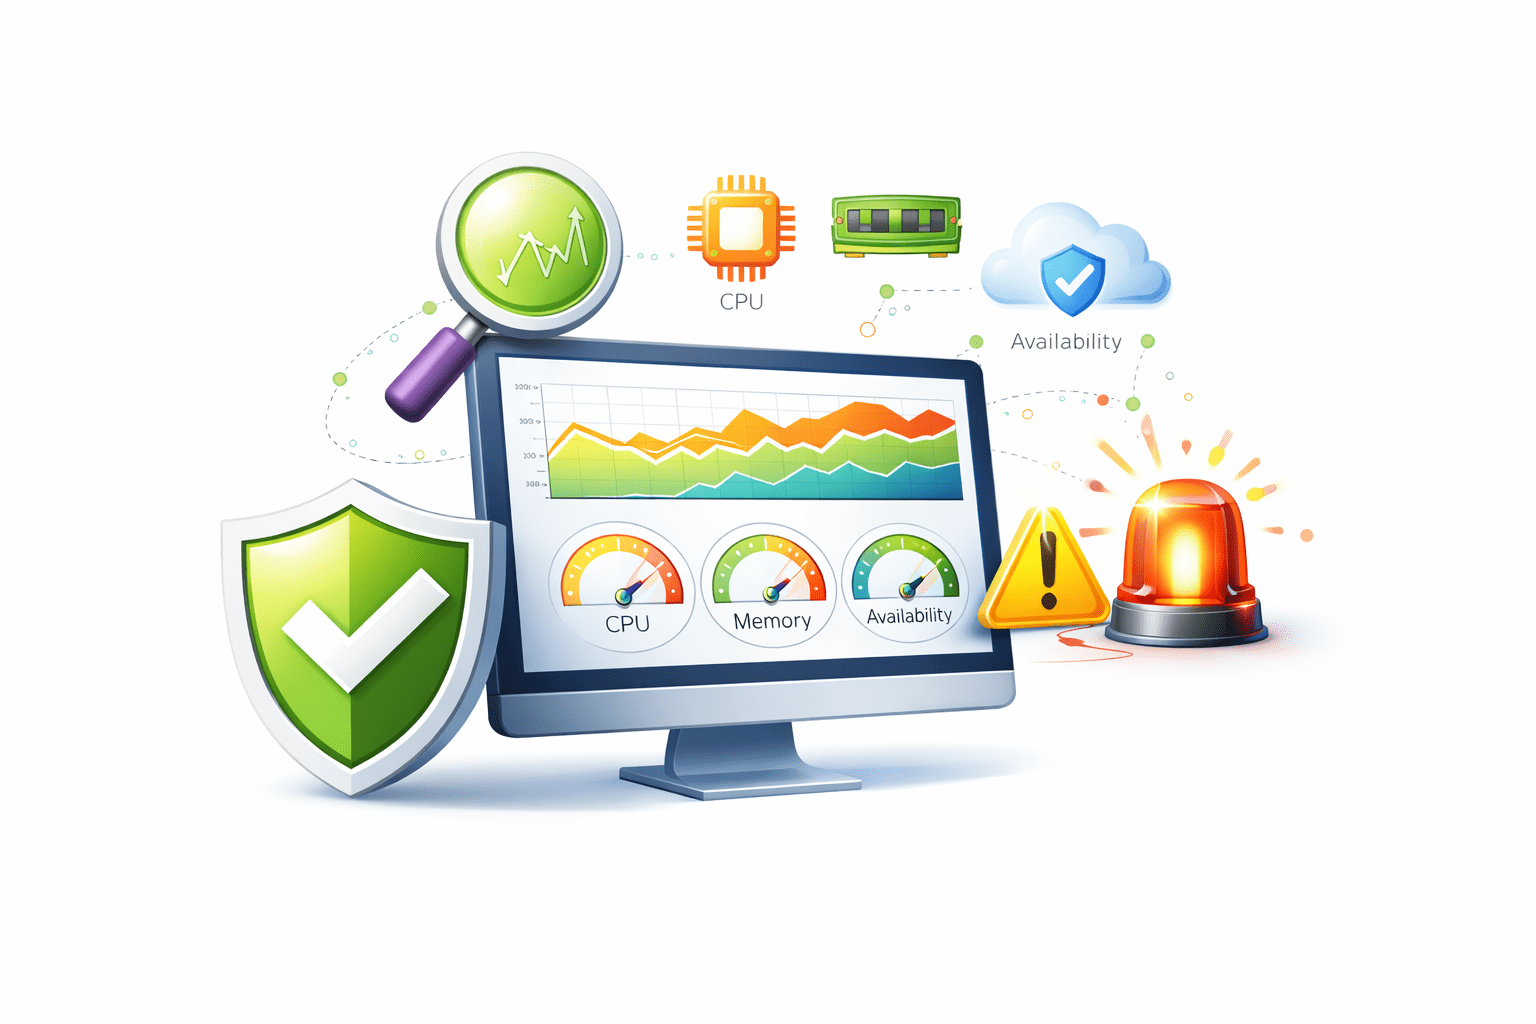
Monitoring is continuous observation of system health
Metrics like CPU, memory, and availability are monitored
Monitoring helps detect issues early and reduce downtime
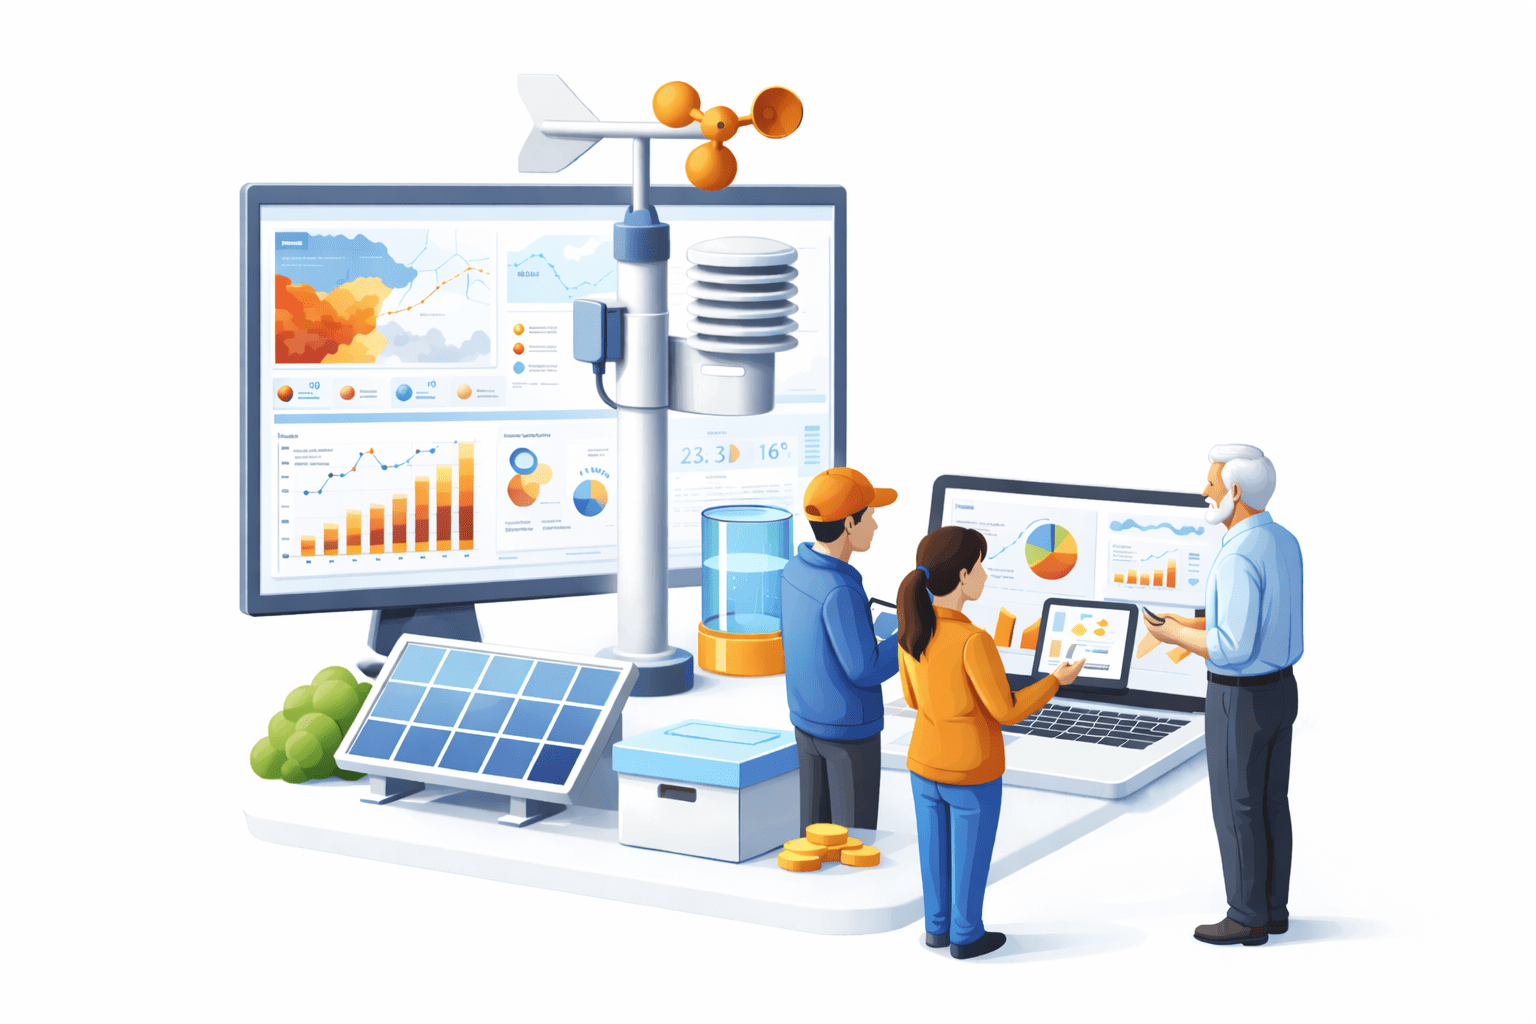
Understanding the concept
Imagine a weather station
Sensors collect weather data
Screen shows graphs and reports
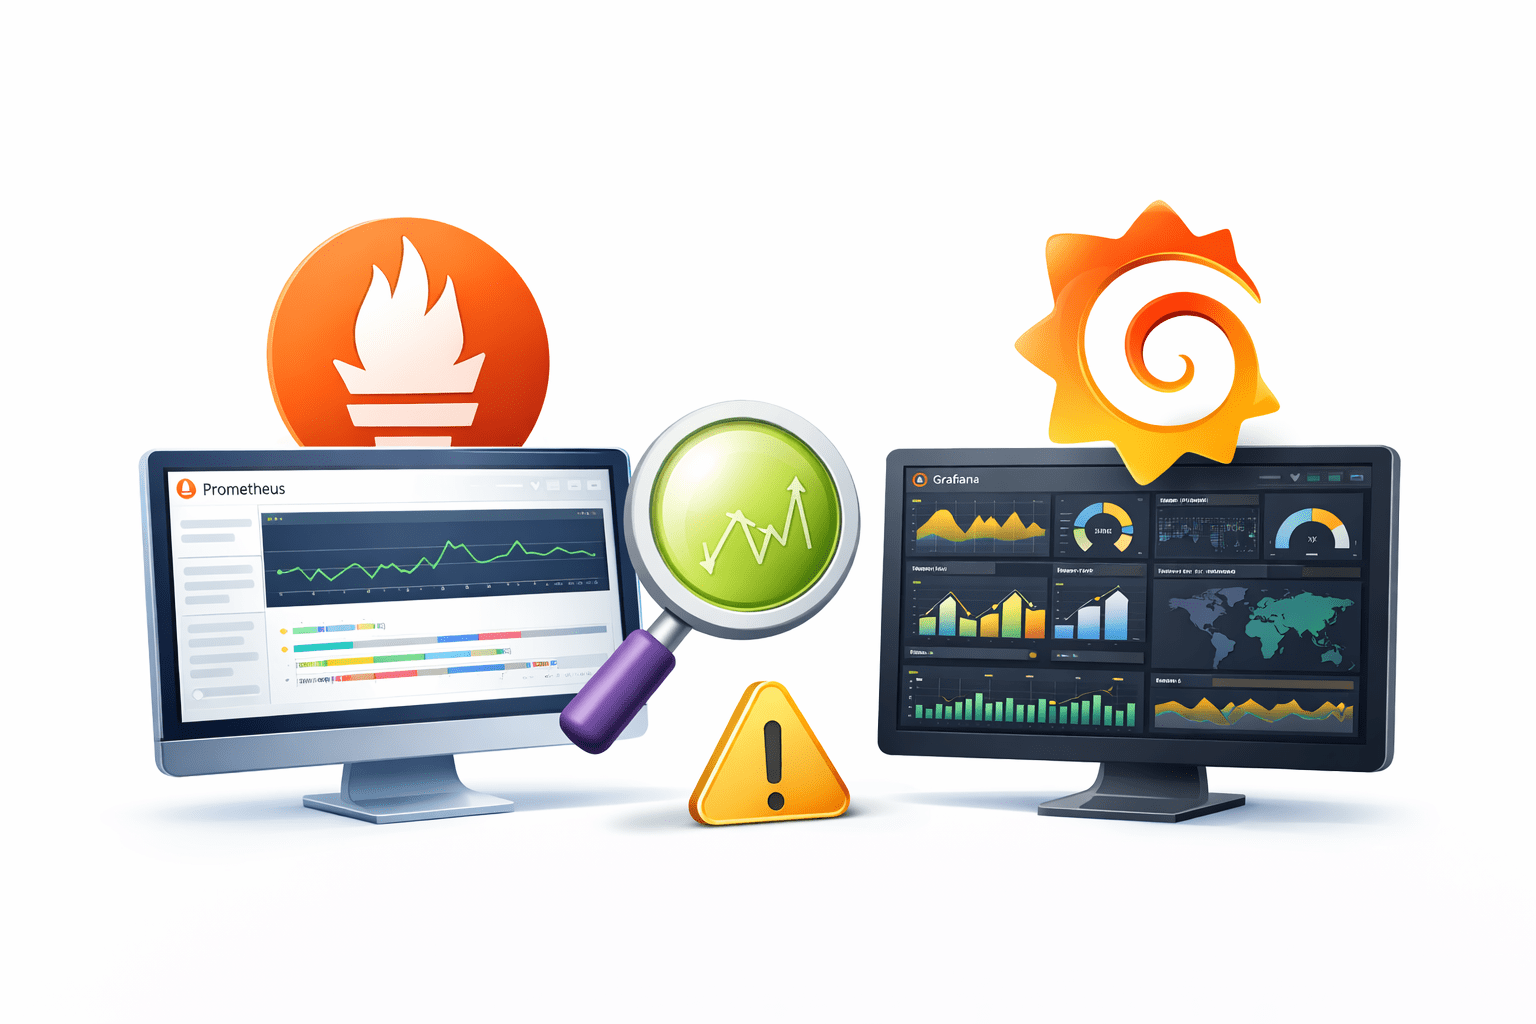
In monitoring, Prometheus acts like the sensor, and
Grafana acts like the display screen
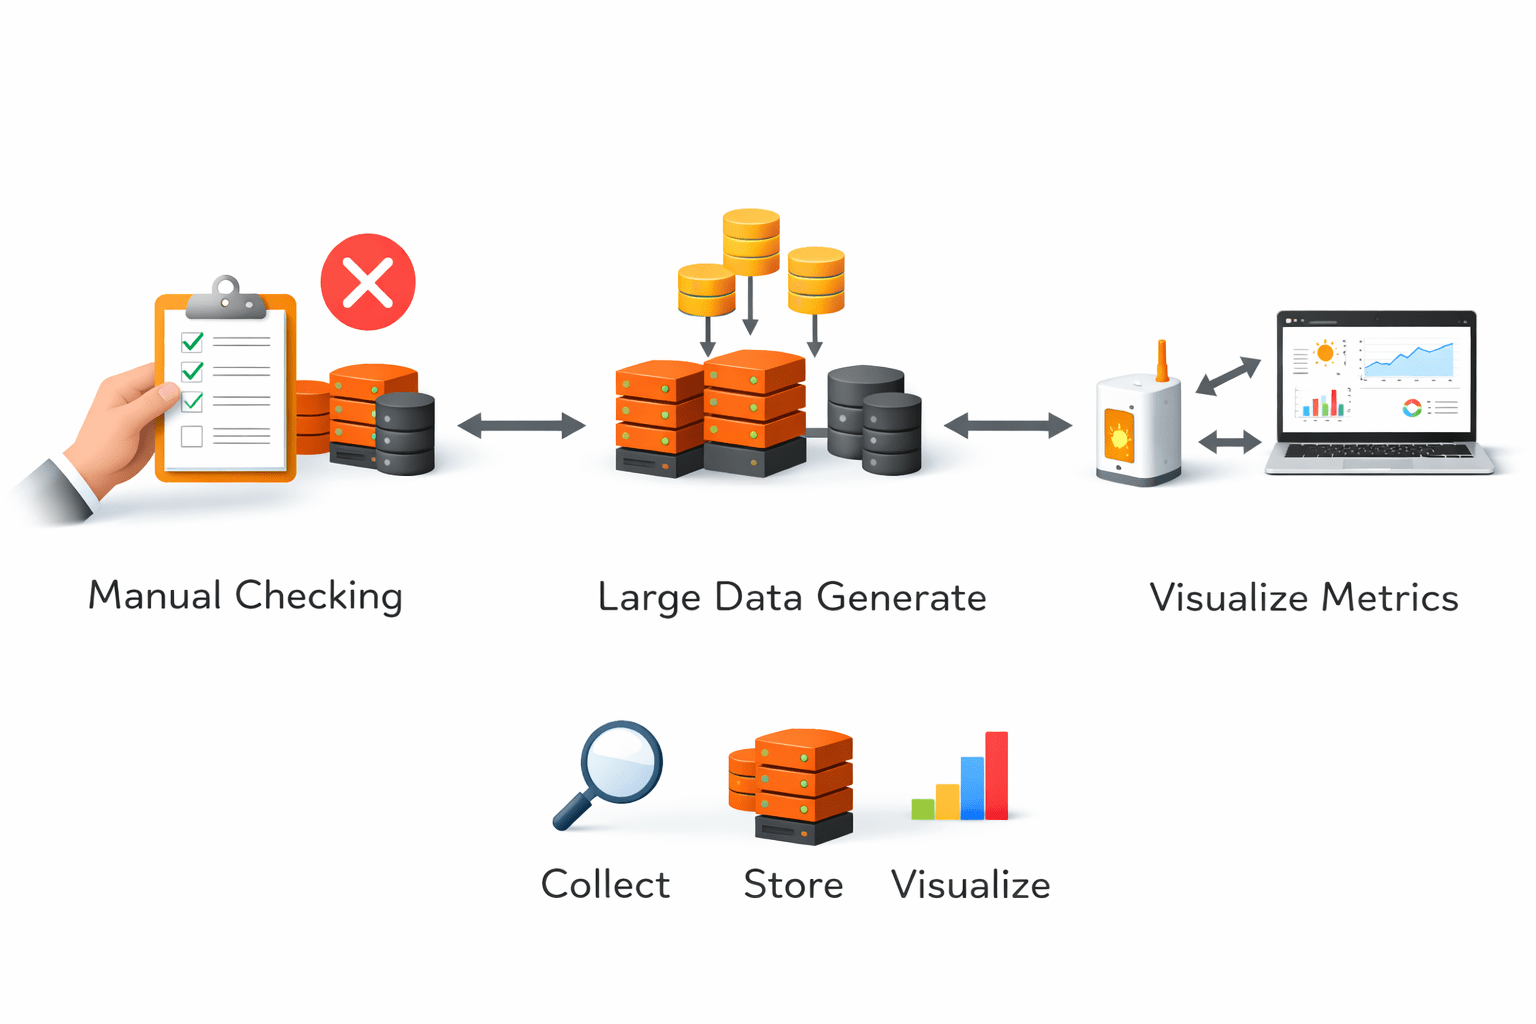
Why Monitoring Tools Are Needed
Manual checking is not practical
Systems generate large amounts of data
Tools automatically collect and present this data
Monitoring tools help
Collect metrics
Store metrics
Visualize metrics
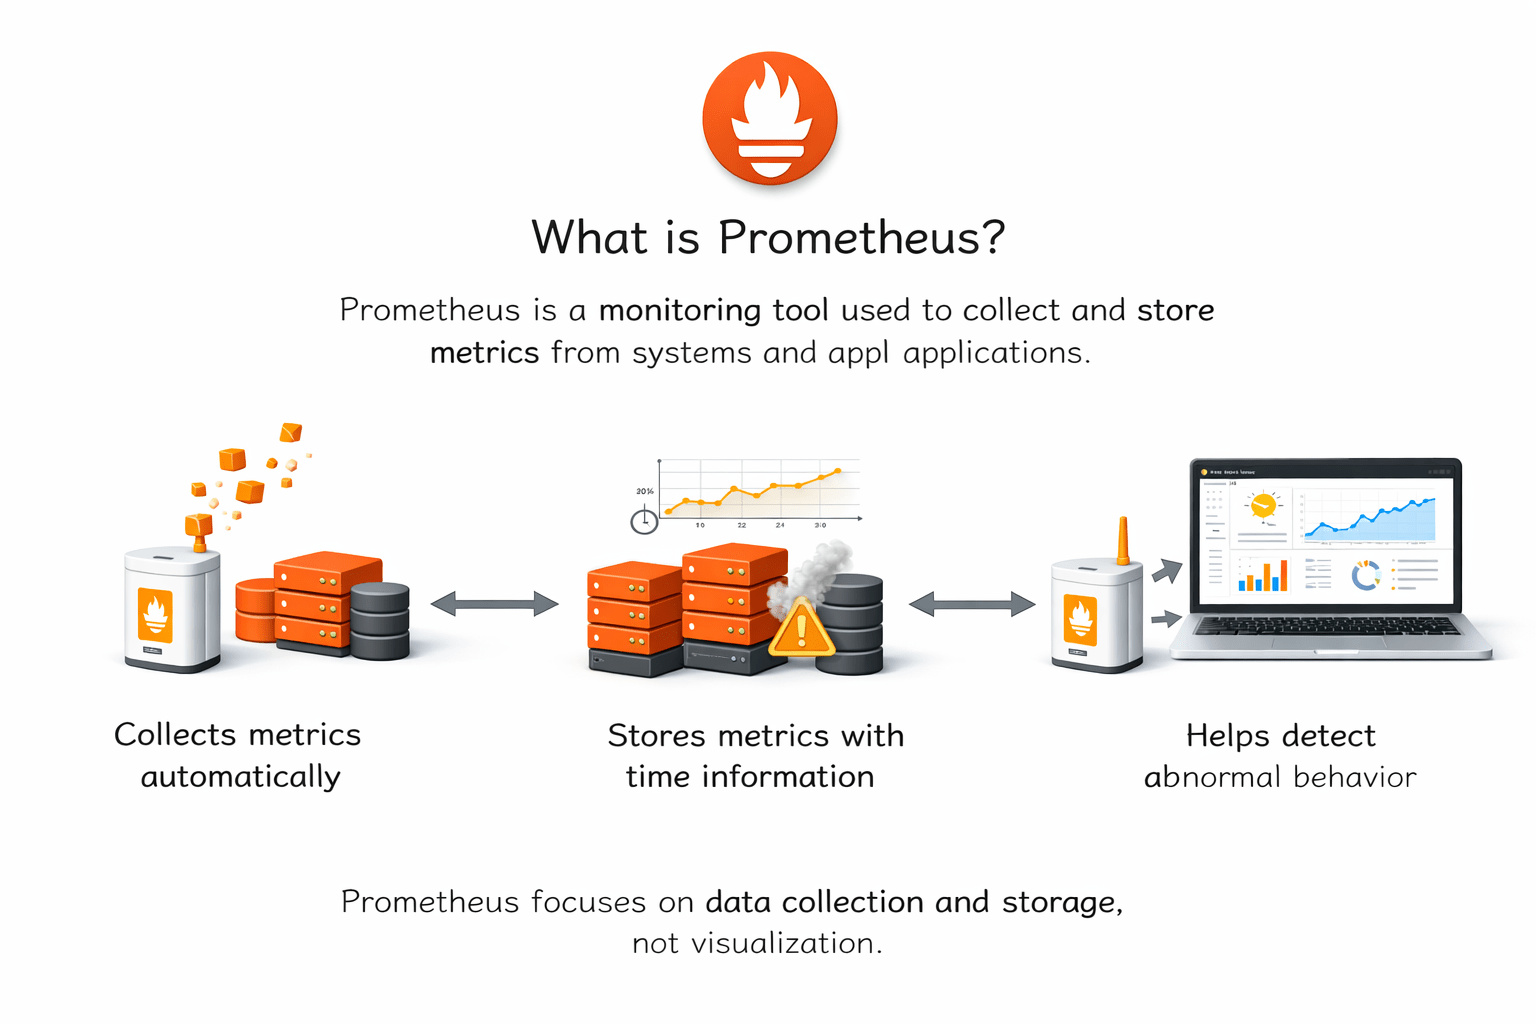
What is Prometheus?
Prometheus is a monitoring tool used to collect and store metrics from systems and applications
Prometheus focuses on data collection and storage, not visualization
Collects metrics automatically
At a high level, Prometheus
Stores metrics with time information
Helps detect abnormal behavior
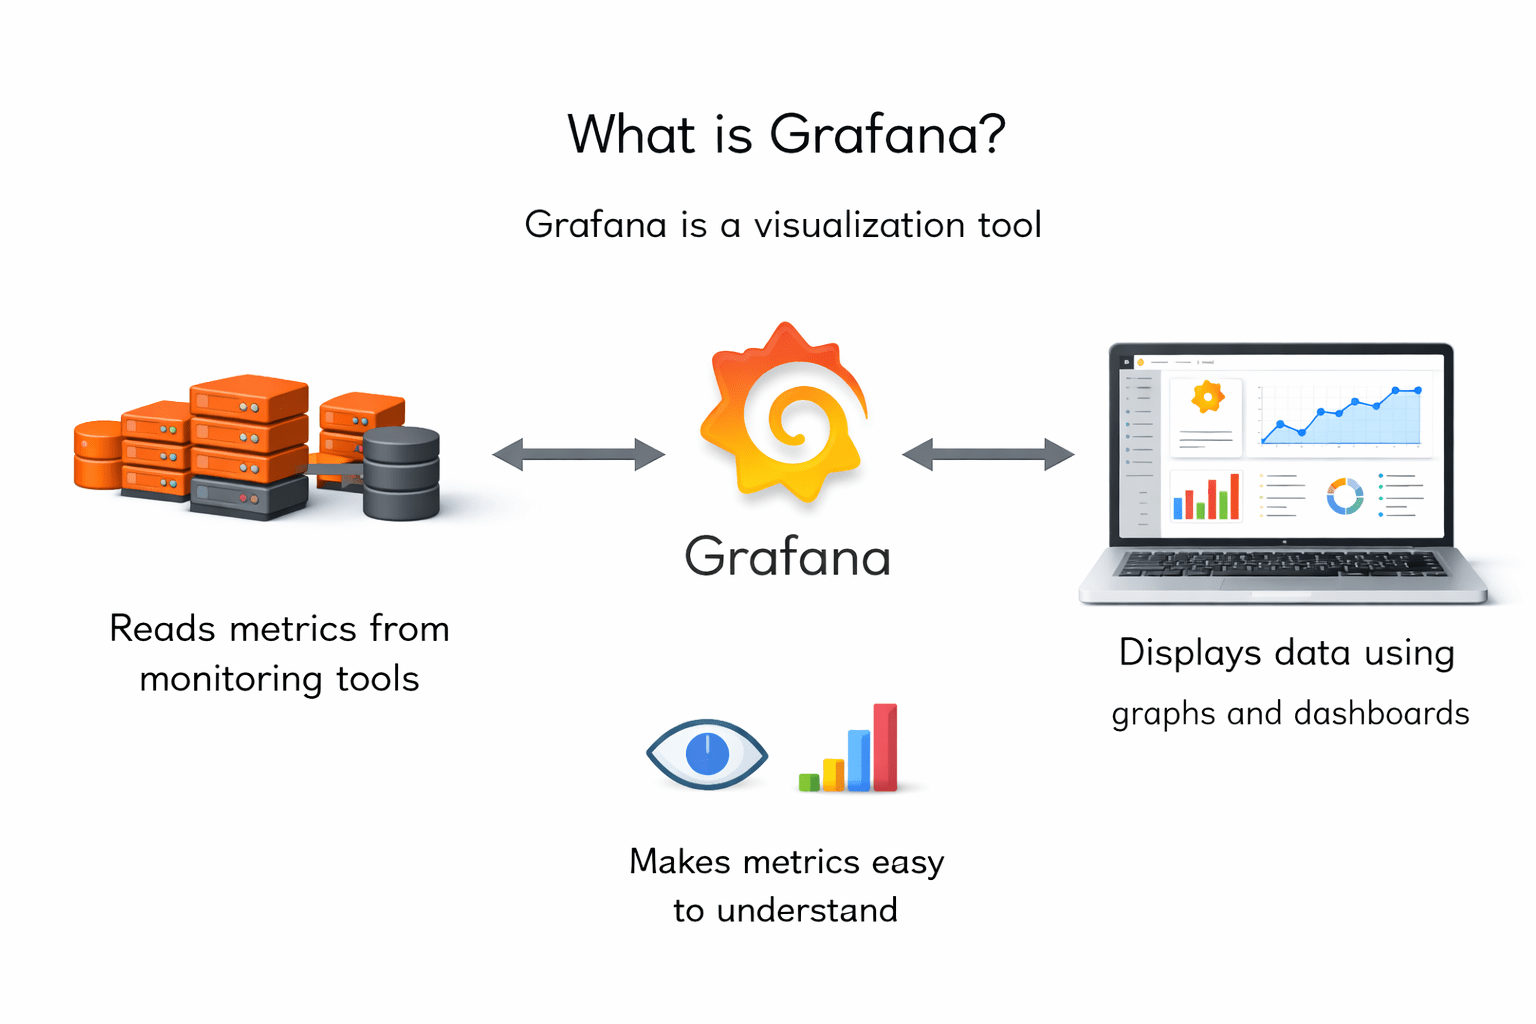
What is Grafana?
Grafana is a visualization tool
At a high level, Grafana
Reads metrics from monitoring tools
Displays data using graphs and dashboards
Makes metrics easy to understand
Grafana does NOT collect data by itself
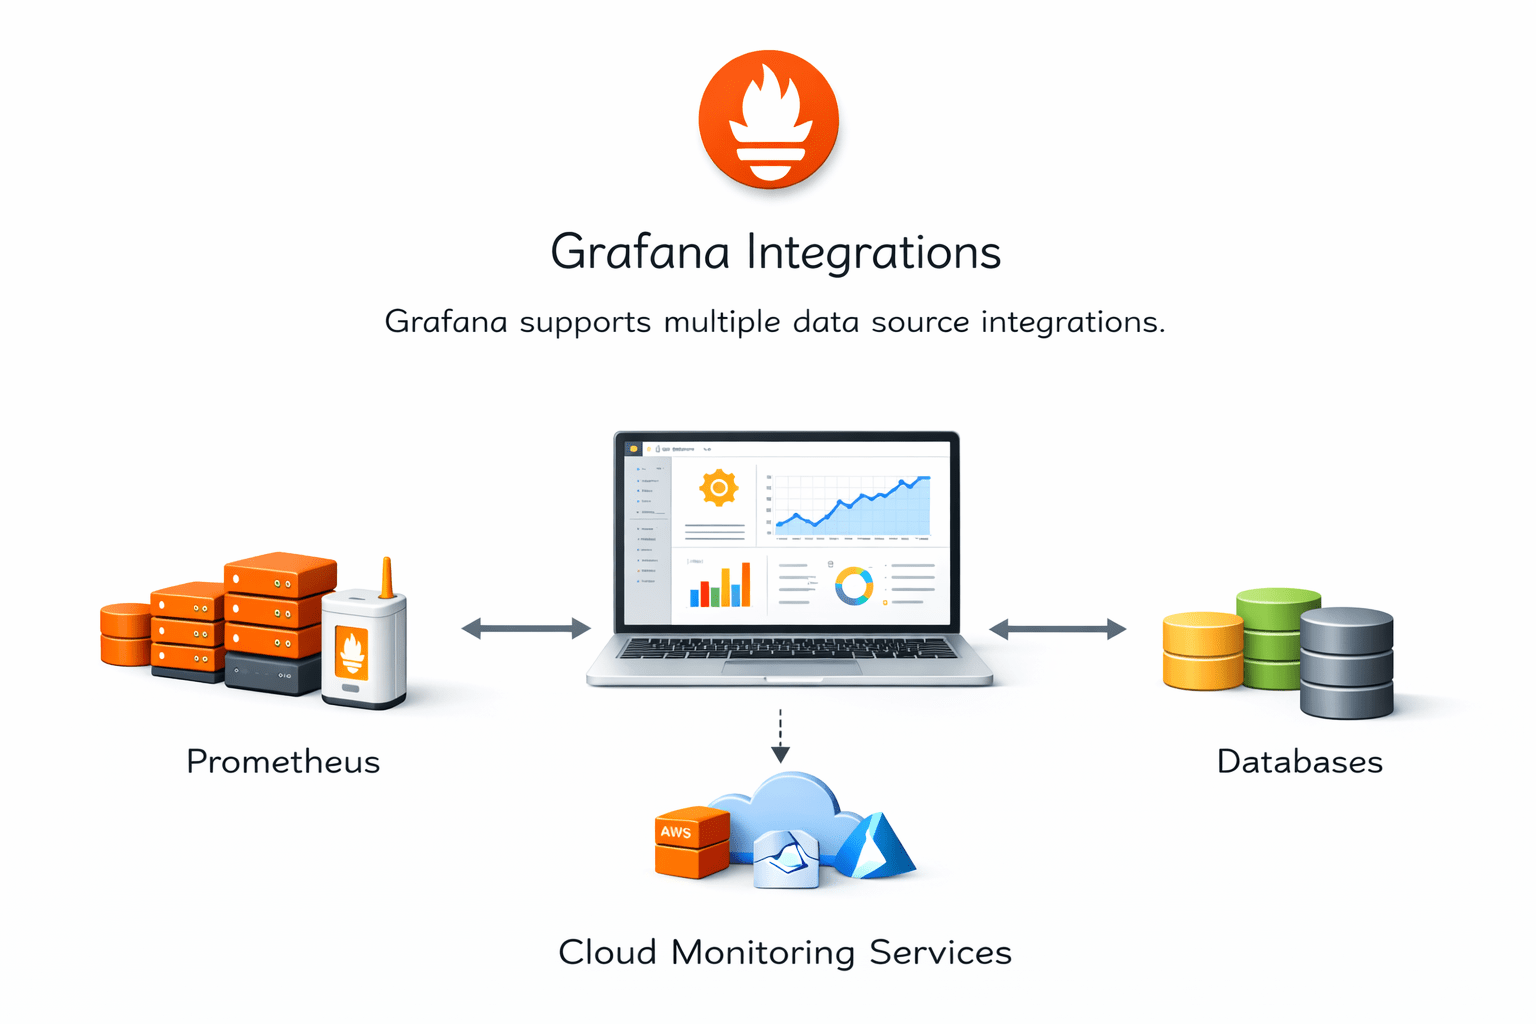
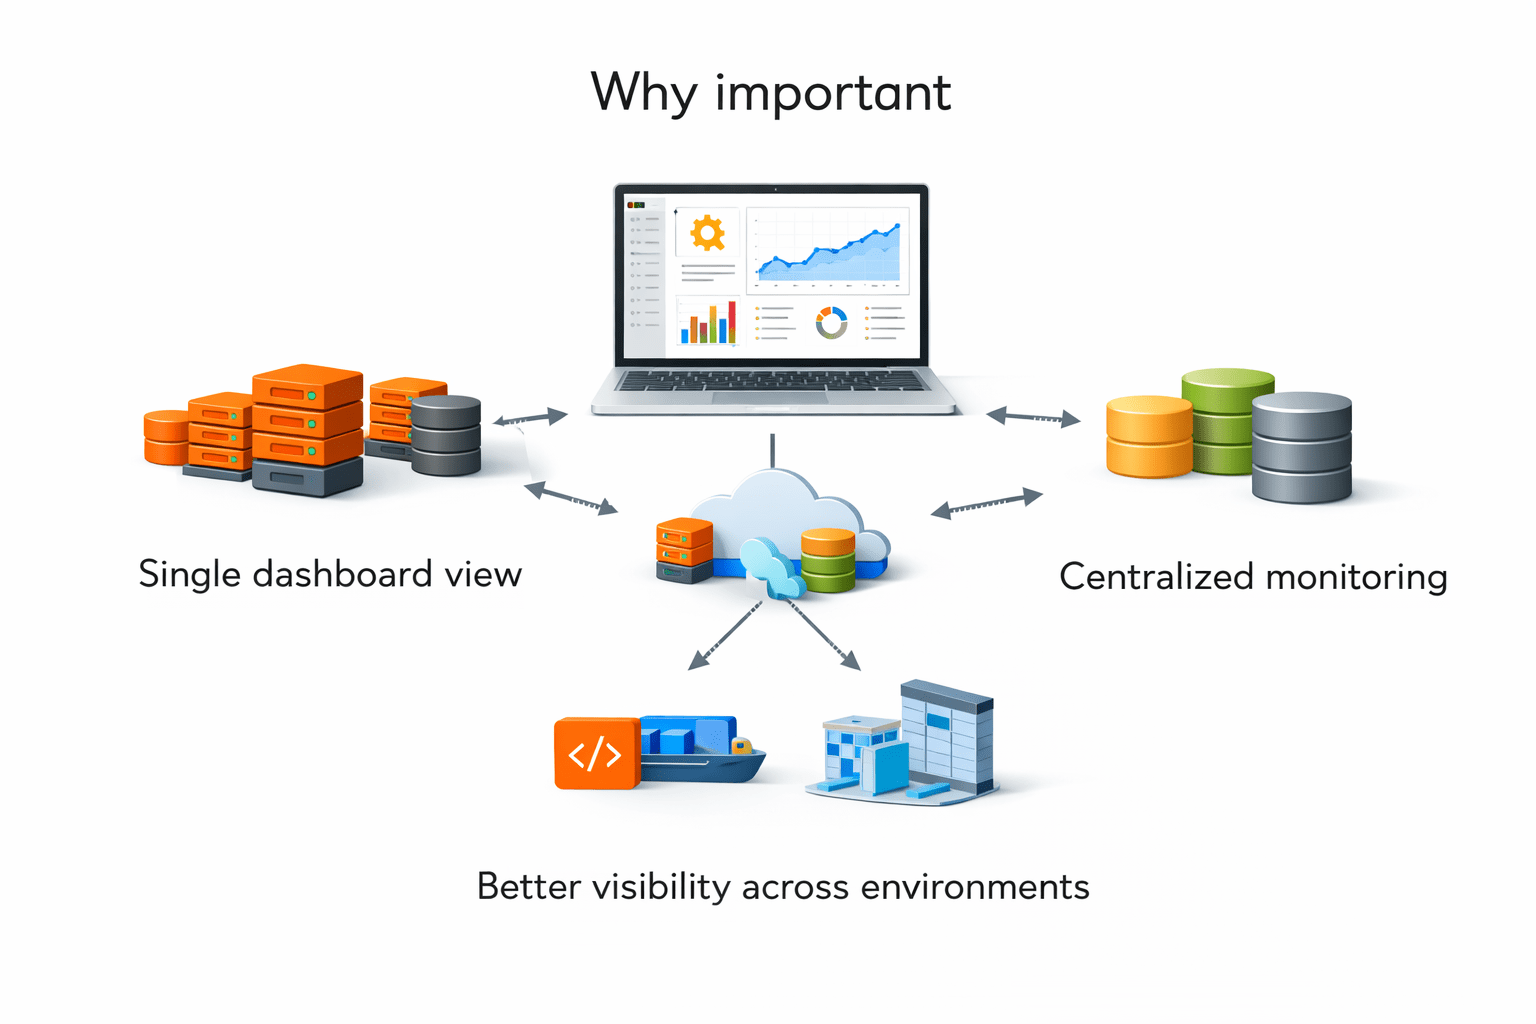
Grafana Integrations
Grafana supports multiple data source integrations
It can
Common integrations
Prometheus
Cloud monitoring services
Databases
Why important
Single dashboard view
Centralized monitoring
Better visibility across environments
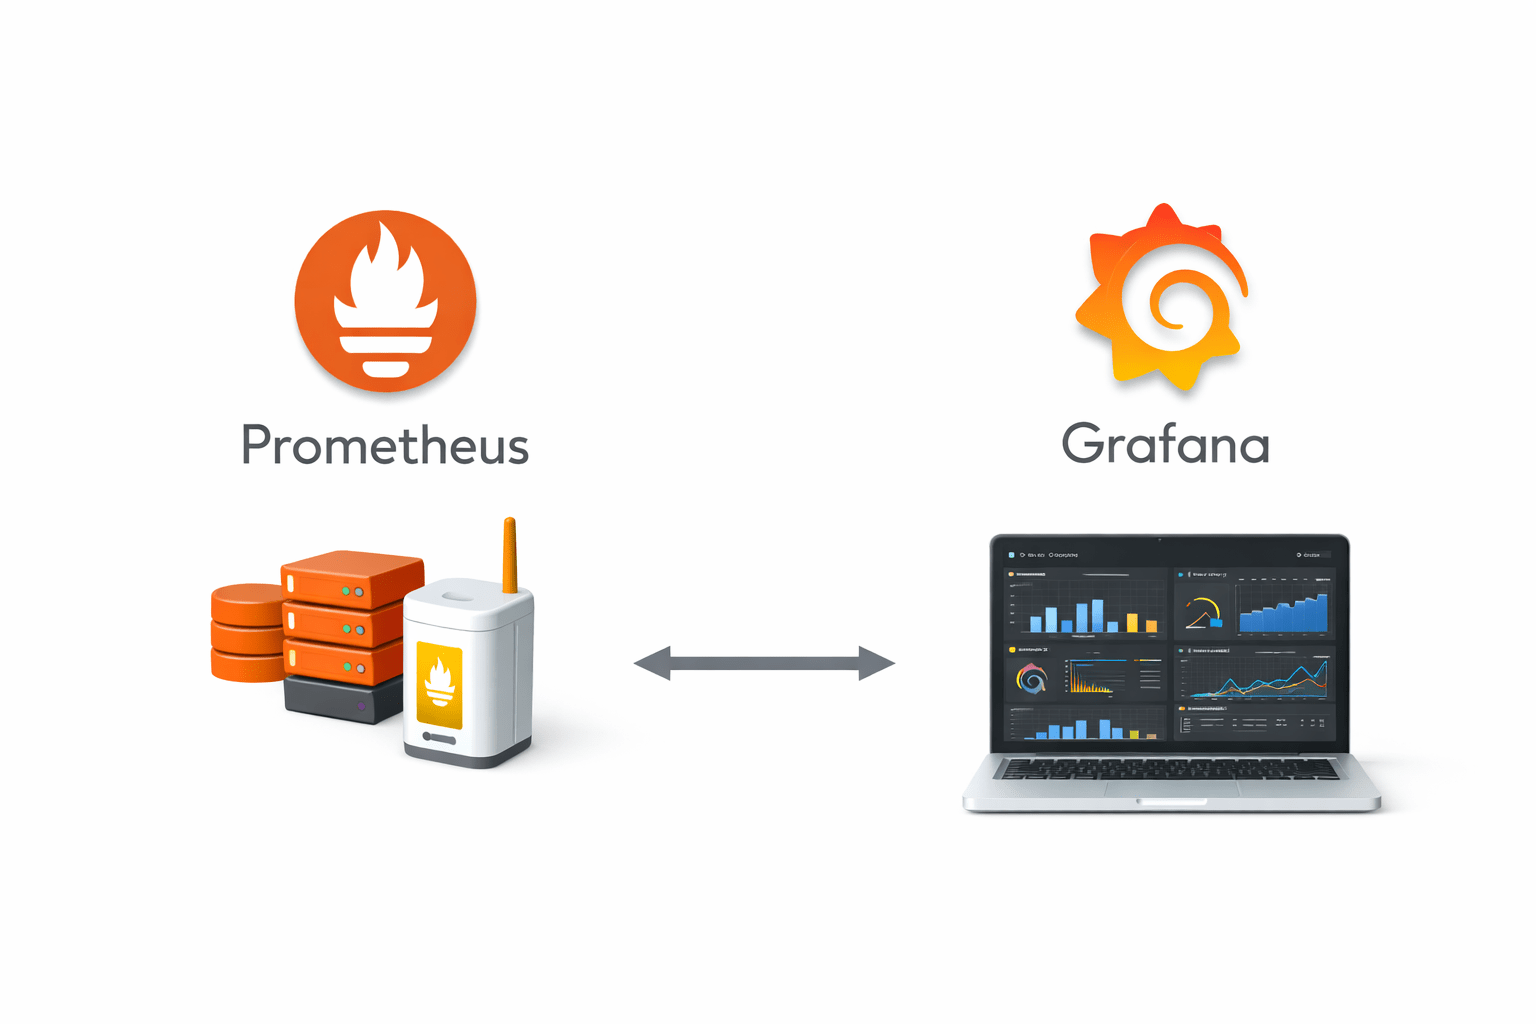
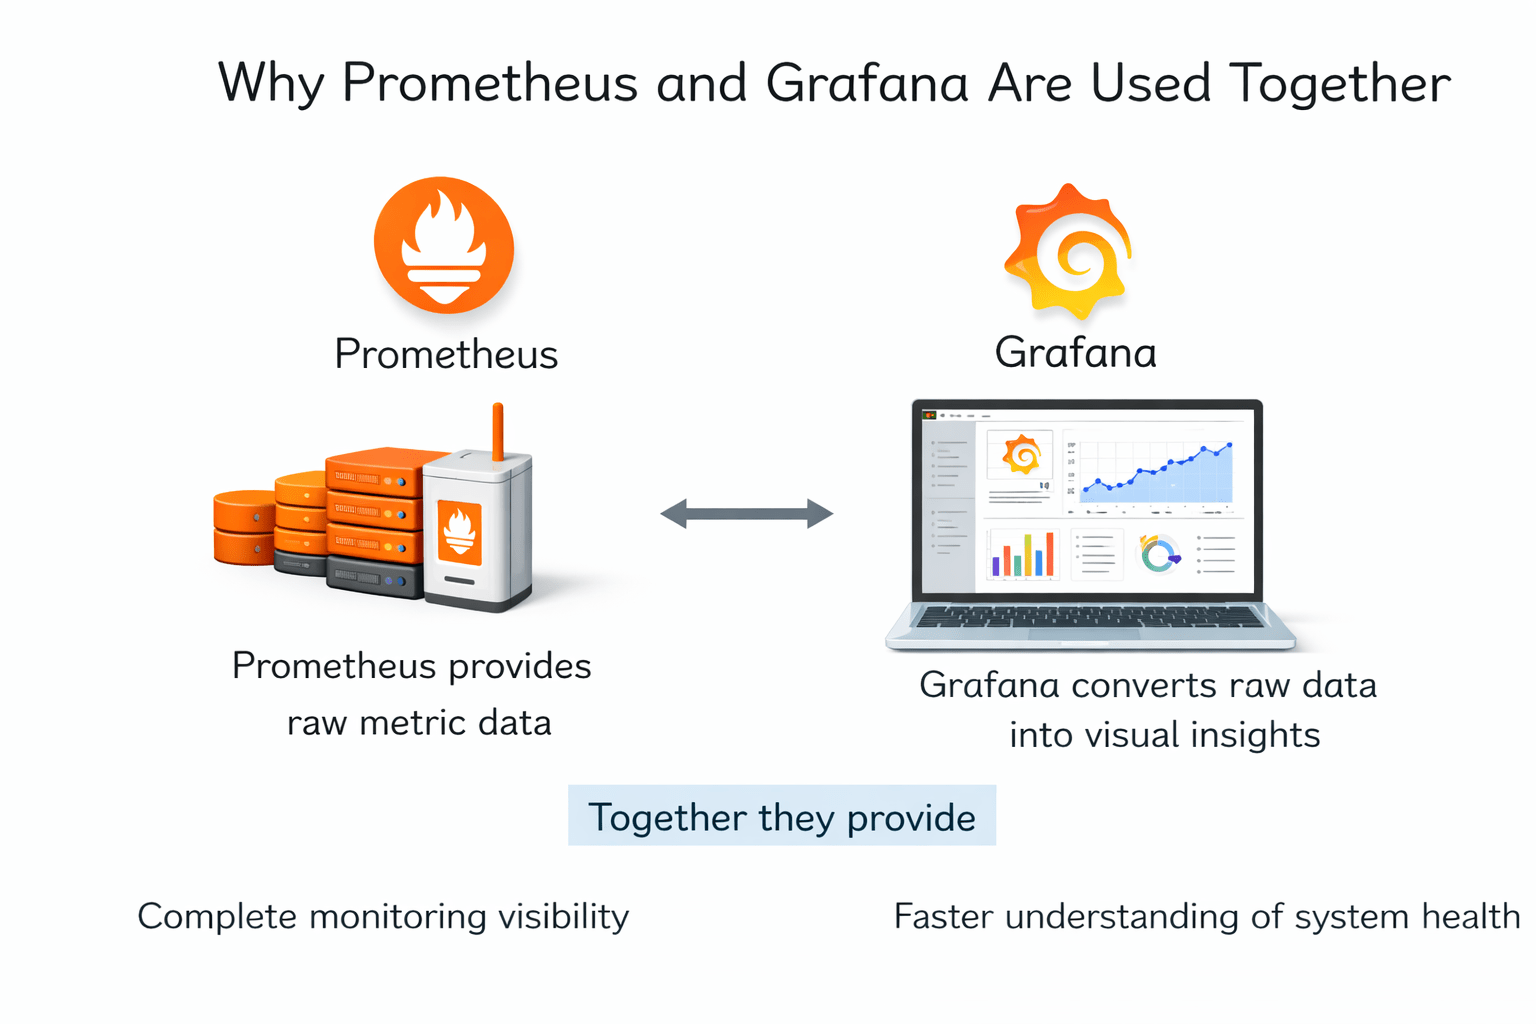
Why Prometheus and Grafana Are Used Together
Text
Prometheus provides raw metric data
Grafana converts raw data into visual insights
Together they provide
Faster understanding of system health
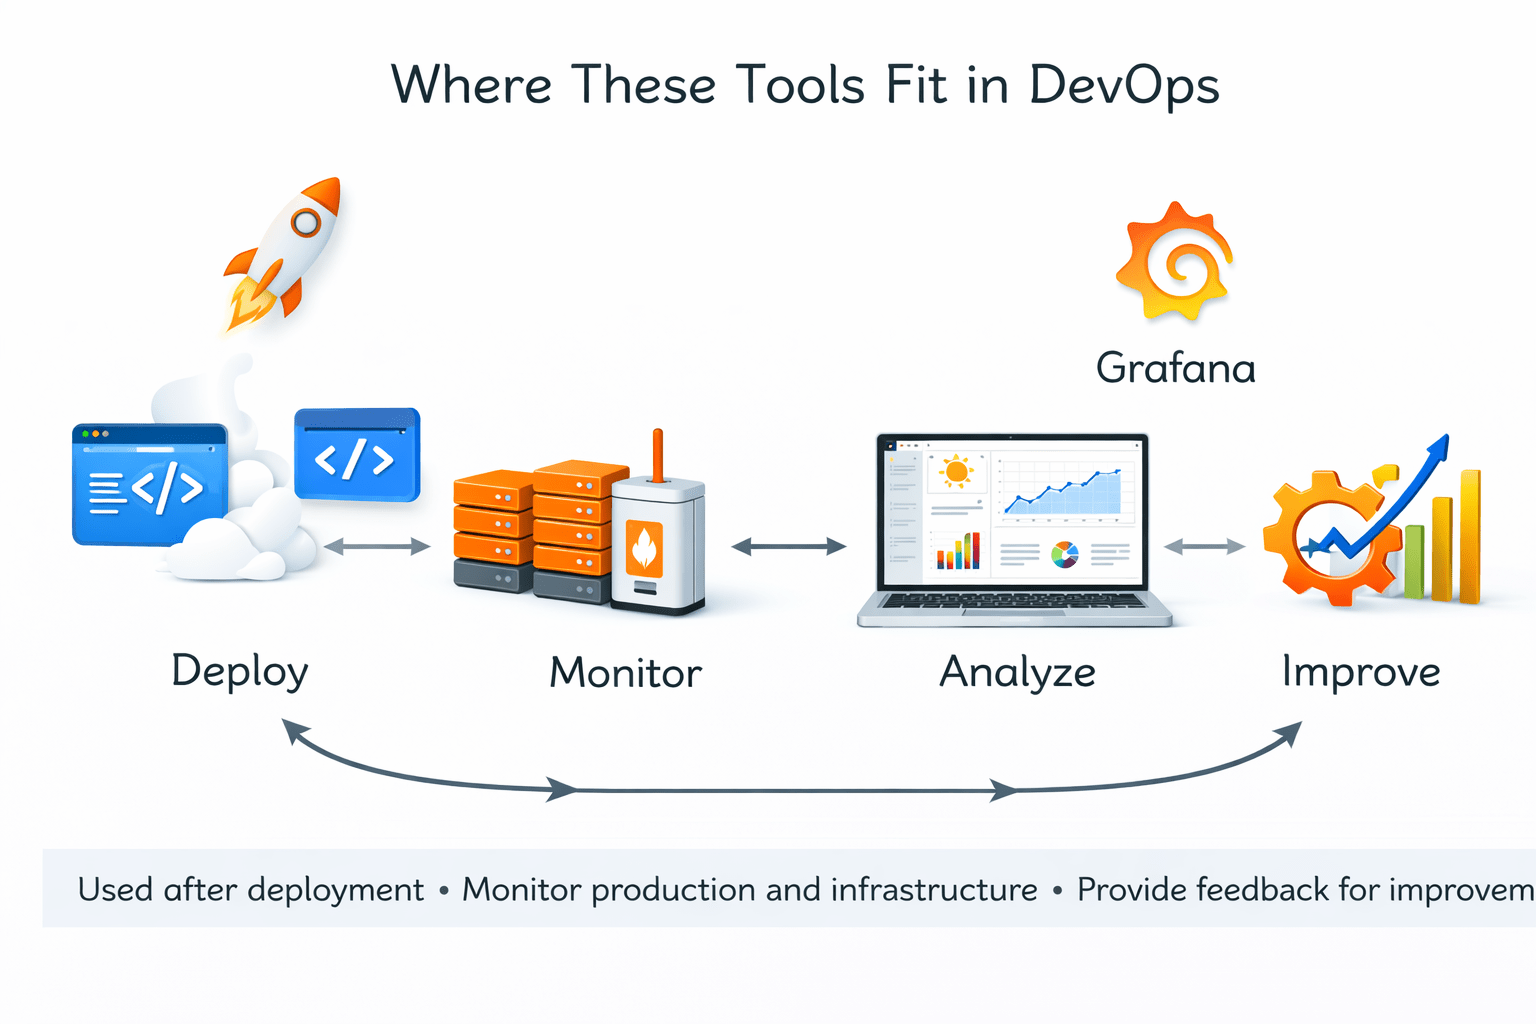
Where These Tools Fit in DevOps
Monitor production and infrastructure
Provide feedback for improvement
Deploy → Monitor → Analyze → Improve
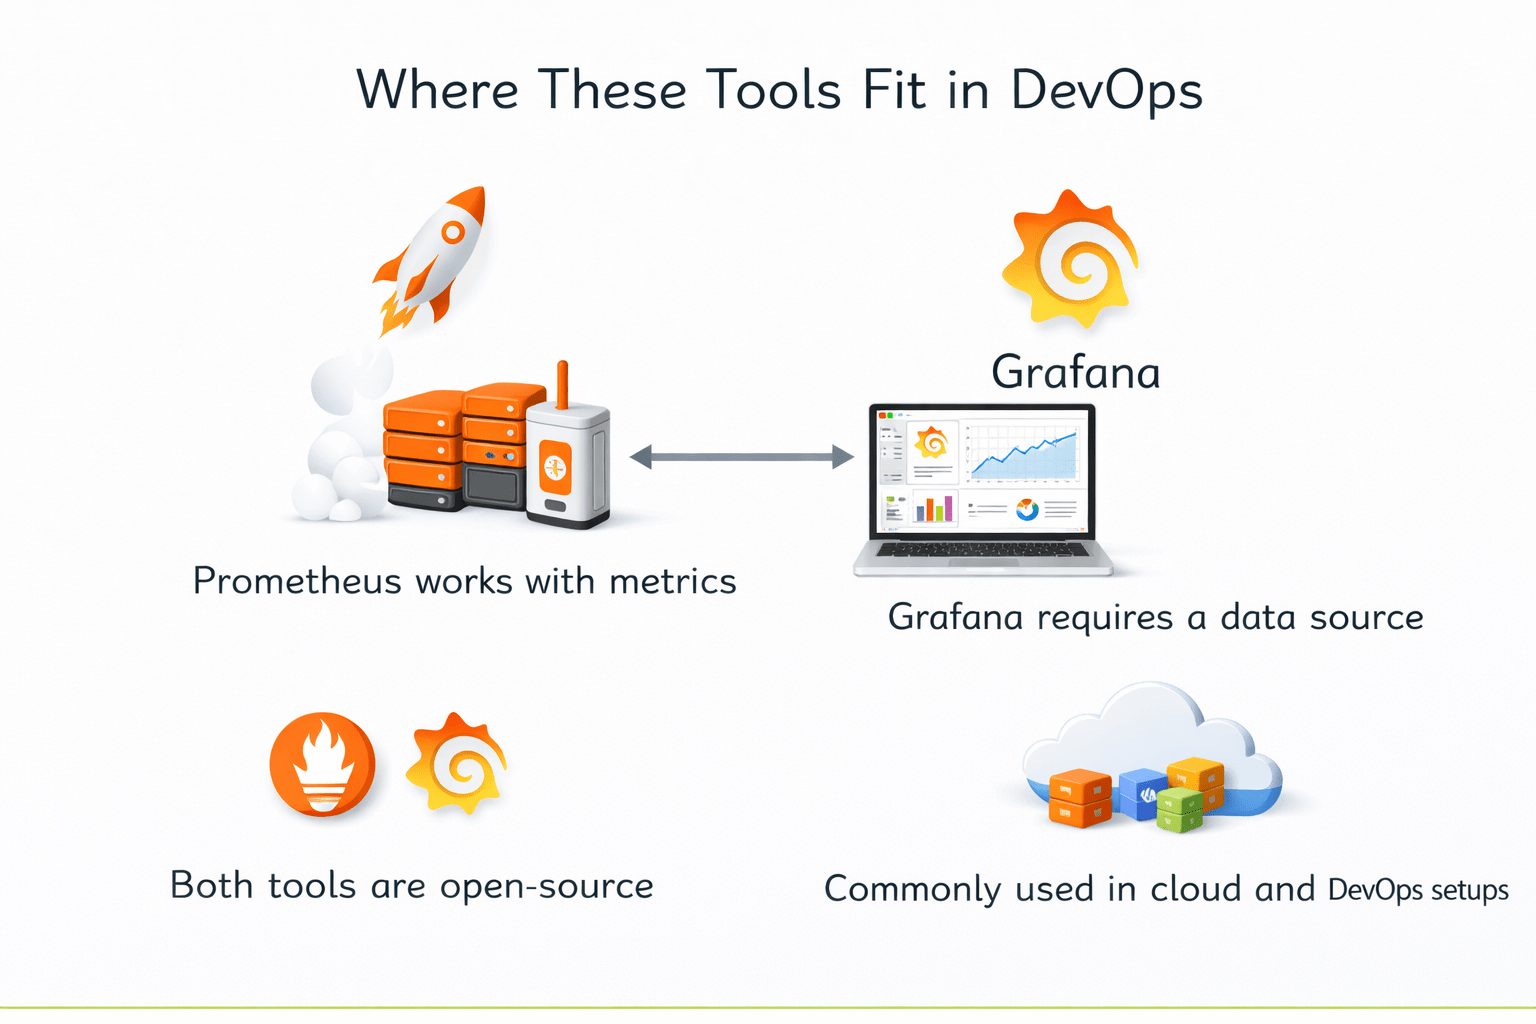
Where These Tools Fit in DevOps
Prometheus works with metrics
Grafana requires a data source
Both tools are open-source
Commonly used in cloud
& DevOps setups
Summary
4
Both tools are essential in DevOps monitoring
3
Grafana visualizes monitoring data
2
Prometheus collects and stores metrics
1
Monitoring tools automate system observation
Quiz
What is the main role of Prometheus?
A. Visualizing dashboards
B. Collecting and storing metrics
C. Writing log files
D. Deploying applications
Answer
What is the main role of Prometheus?
A. Visualizing dashboards
B. Collecting and storing metrics
C. Writing log files
D. Deploying applications
By Content ITV


