


Content ITV PRO
This is Itvedant Content department
Learning Outcome
6
Explain the iterative structure of the Data Science Lifecycle
5
Differentiate qualitative, quantitative, and mixed analysis approaches
4
Explain structural categories of datanels
3
Analyze differences between qualitative and quantitative datasets
2
Classify data accurately across multiple dimensions
1
Distinguish clearly between data and information
Learners should know :
Identification of categorical vs numerical variables
Basic interpretation of charts and summaries
These operations rely on data structure and classification principles explored today
Dataset organization into rows and columns
Aggregation techniques (sum, count, average)
Filtering and grouping
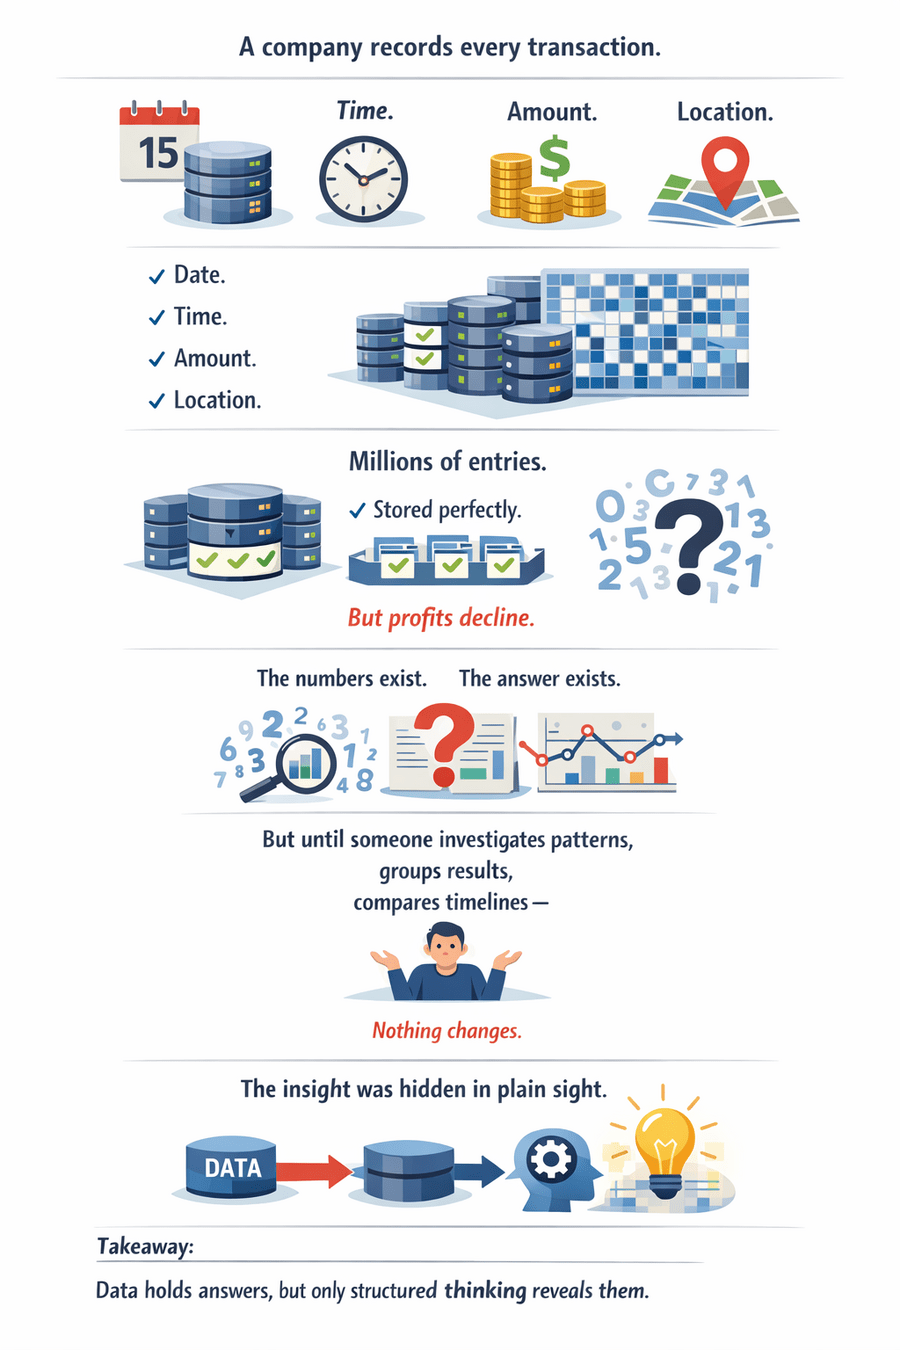
Imagine a company records every transaction.
Millions of Entries
Time
Amount
Location
Date
But until someone investigates patterns,
groups results,
compares timelines
The number exist
The Answer exist
The insight was hidden in plain sight.
Data holds answers, but only structured thinking reveals them.
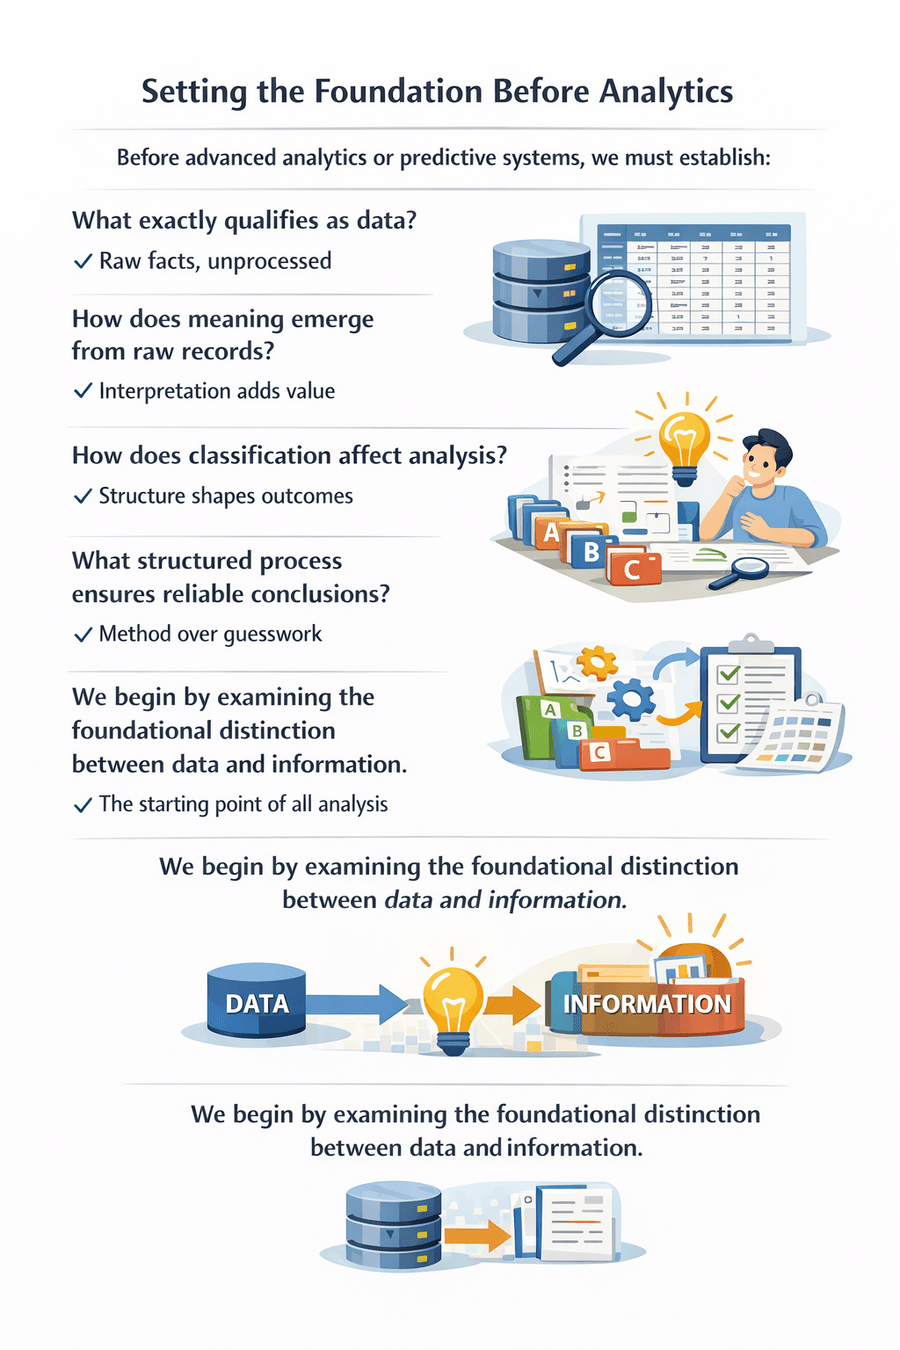
Before advanced analytics or predictive systems, we must establish:
What exactly qualifies as data?
How does meaning emerge from raw records?
How does classification affect analysis?
What structured process ensures reliable conclusions?
We begin by examining the foundational distinction between data and information.
Data
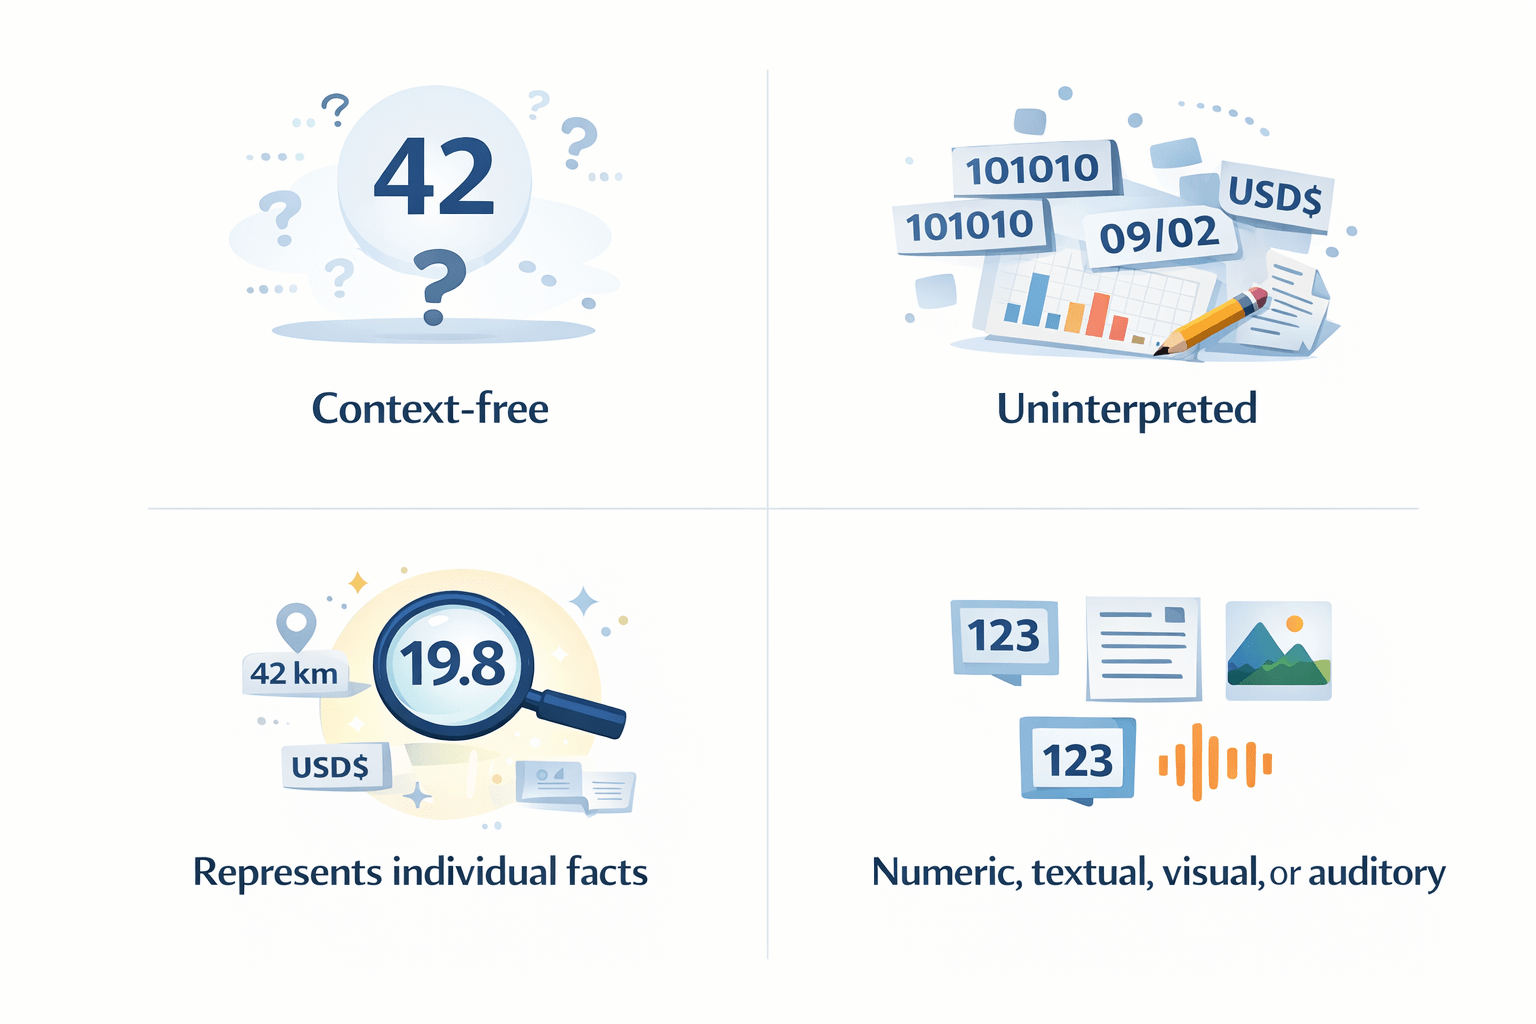
Data consists of raw observations, measurements, or recordings collected from events, systems, or environments.
Key Properties:
Data does not inherently answer questions. It is neutral and descriptive.
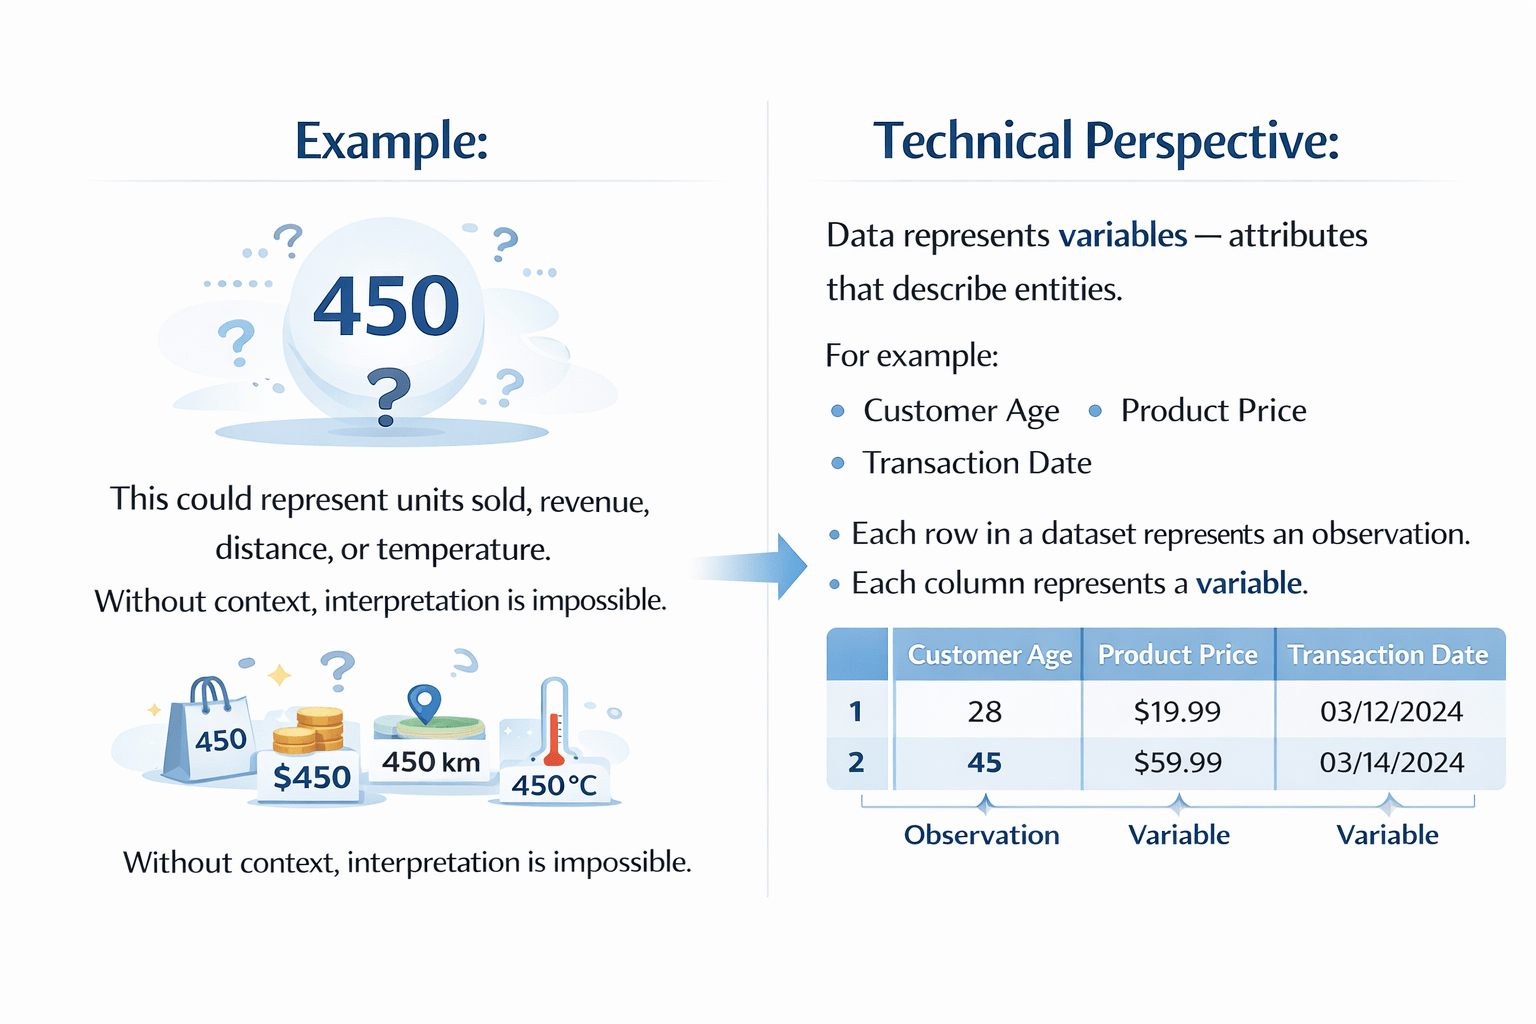
This could represent units sold, revenue, distance, or temperature.
Without context, interpretation is impossible.
Technical Perspective
Data represents variables — attributes that describe entities.
For example:
Customer Age
Product Price
Transaction Date
Each row in a dataset represents an observation.
Each column represents a variable.
Variable
Variable
Variable
Observation
Observation
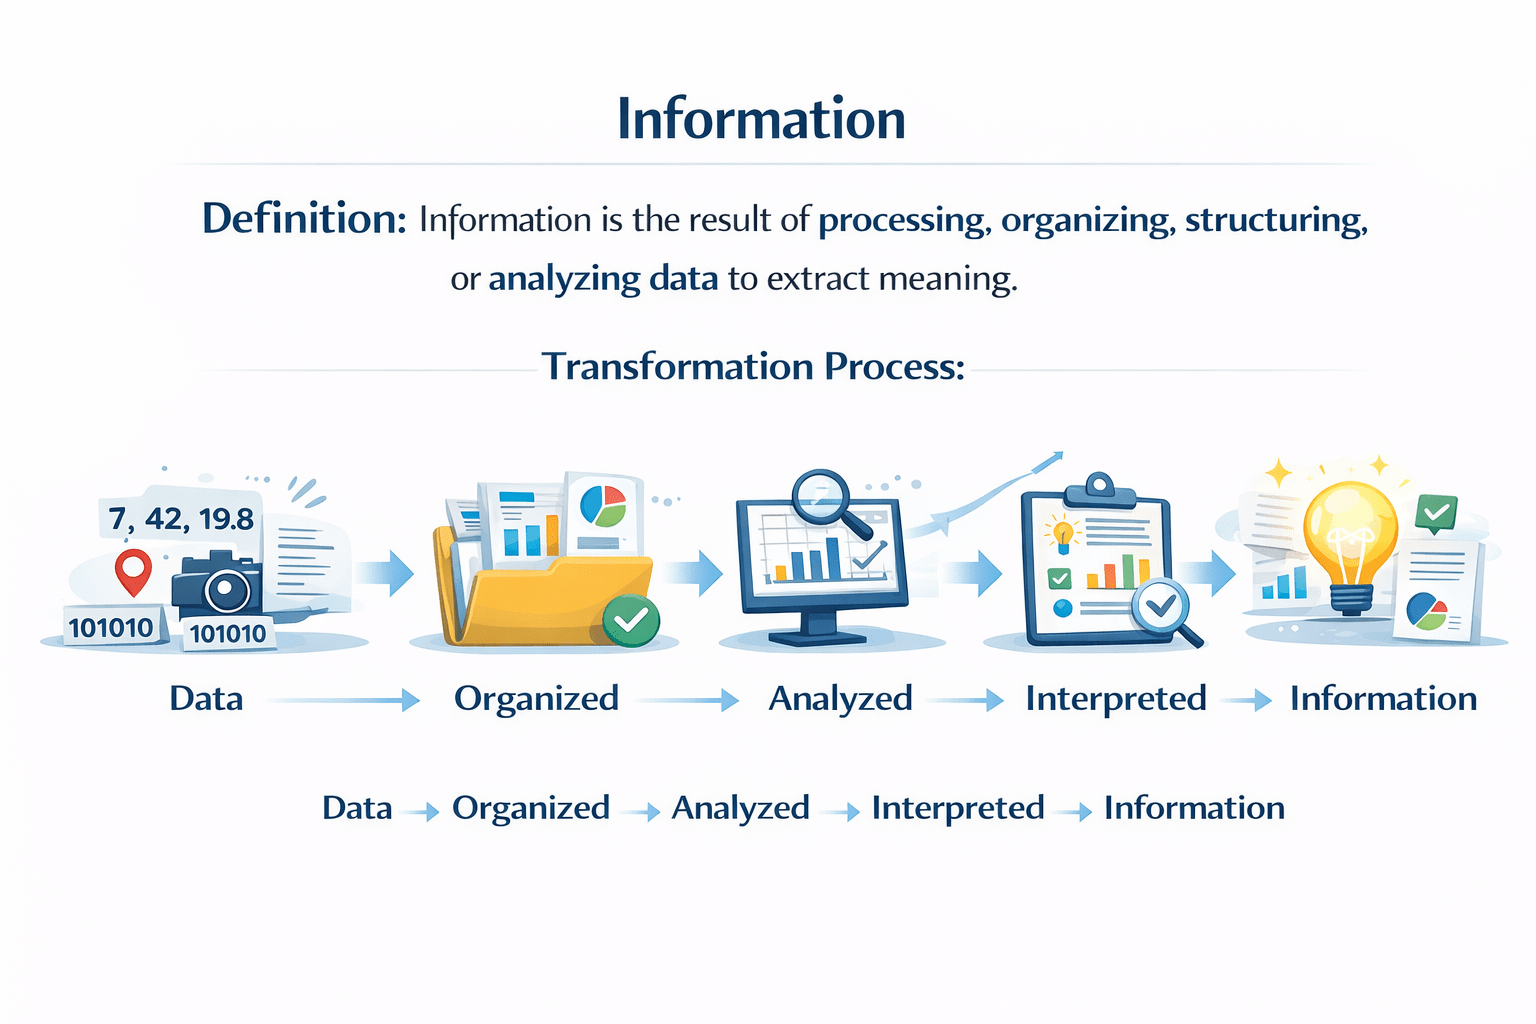
Information
Information is the result of processing, organizing, structuring, or analyzing data to extract meaning.
Data
Organized
Analyzed
Interpreted
Information
Transformation Process
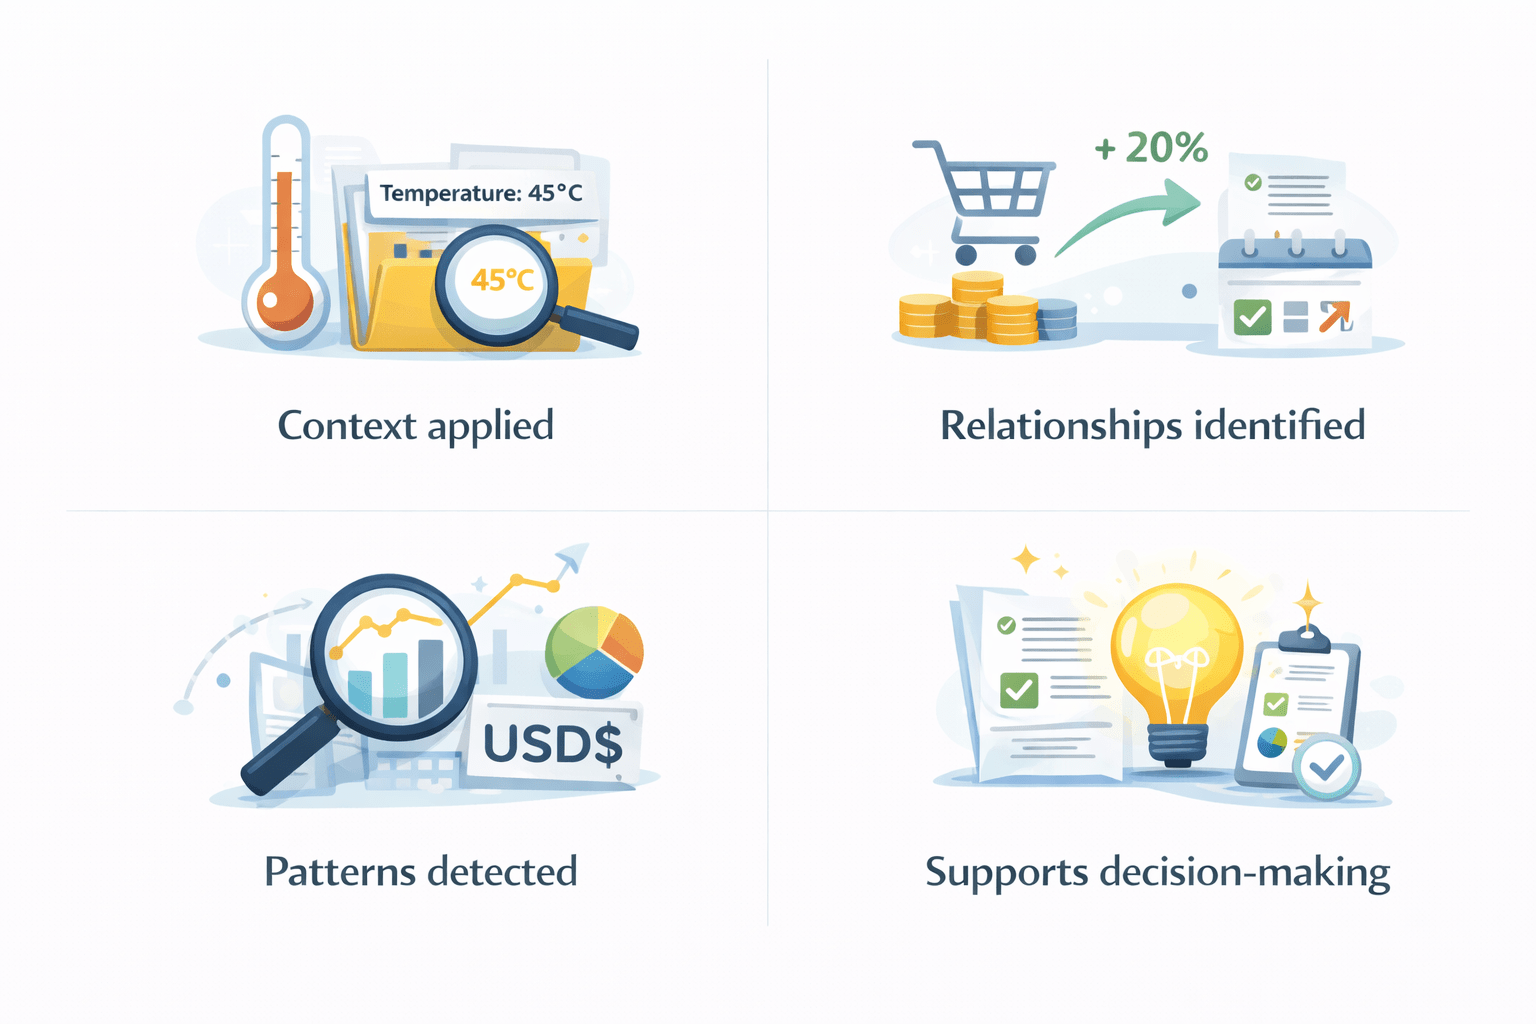
Characteristics
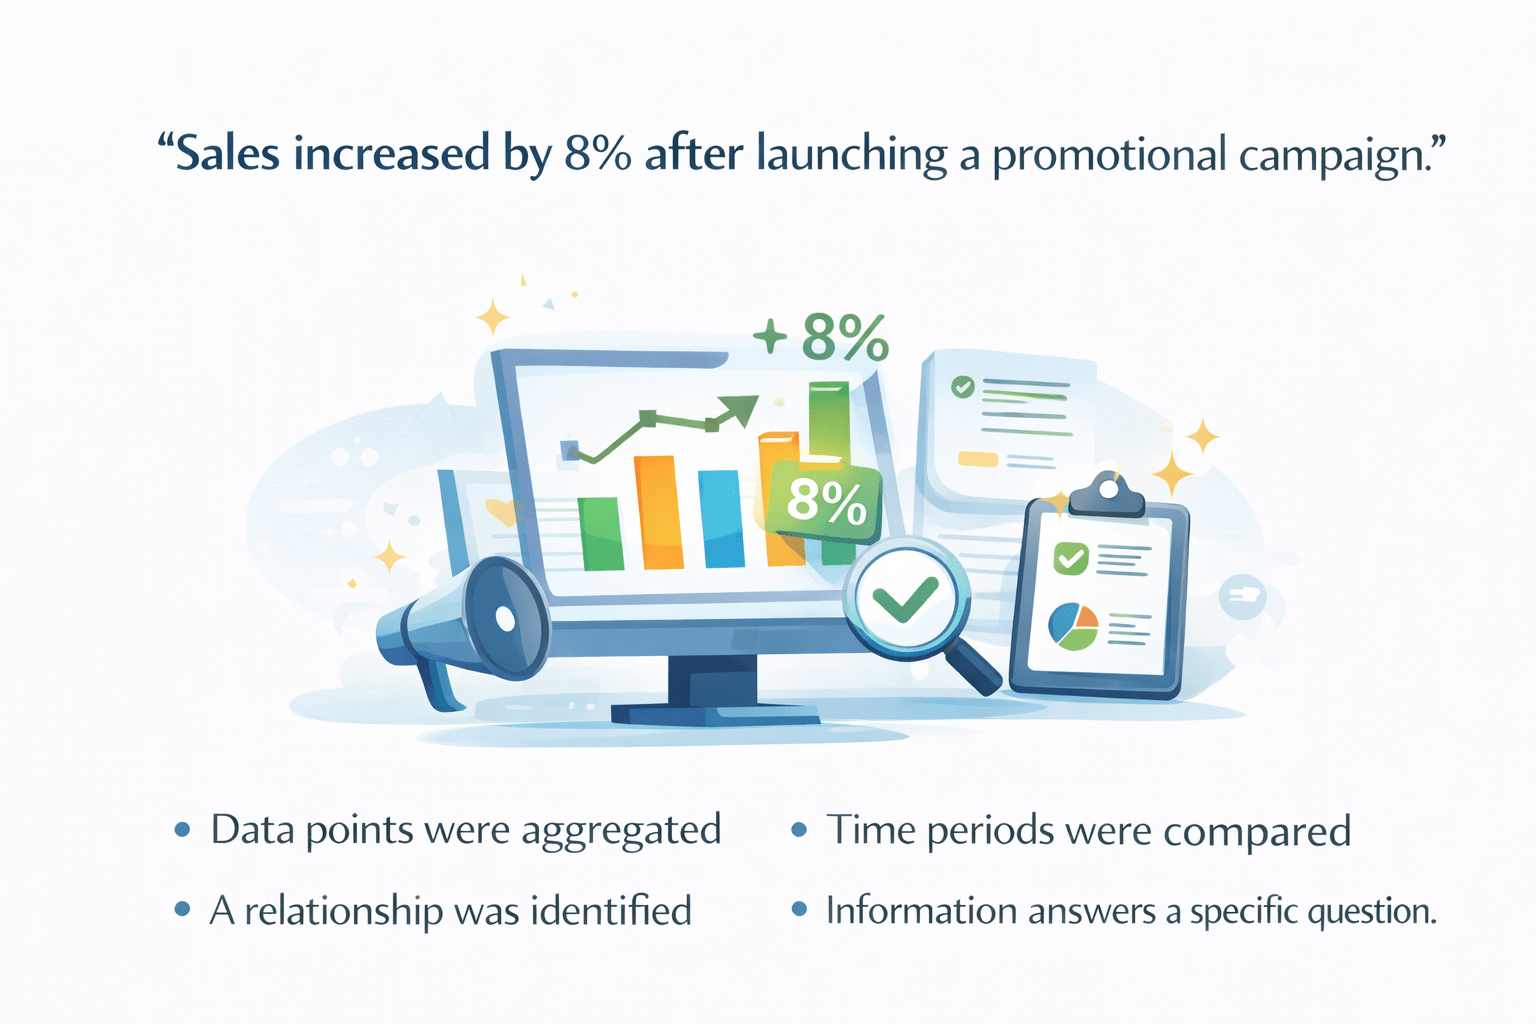
Imagine Sales increased by 8% after launching a promotional campaign
Information answers a specific question.
A relationship was identified
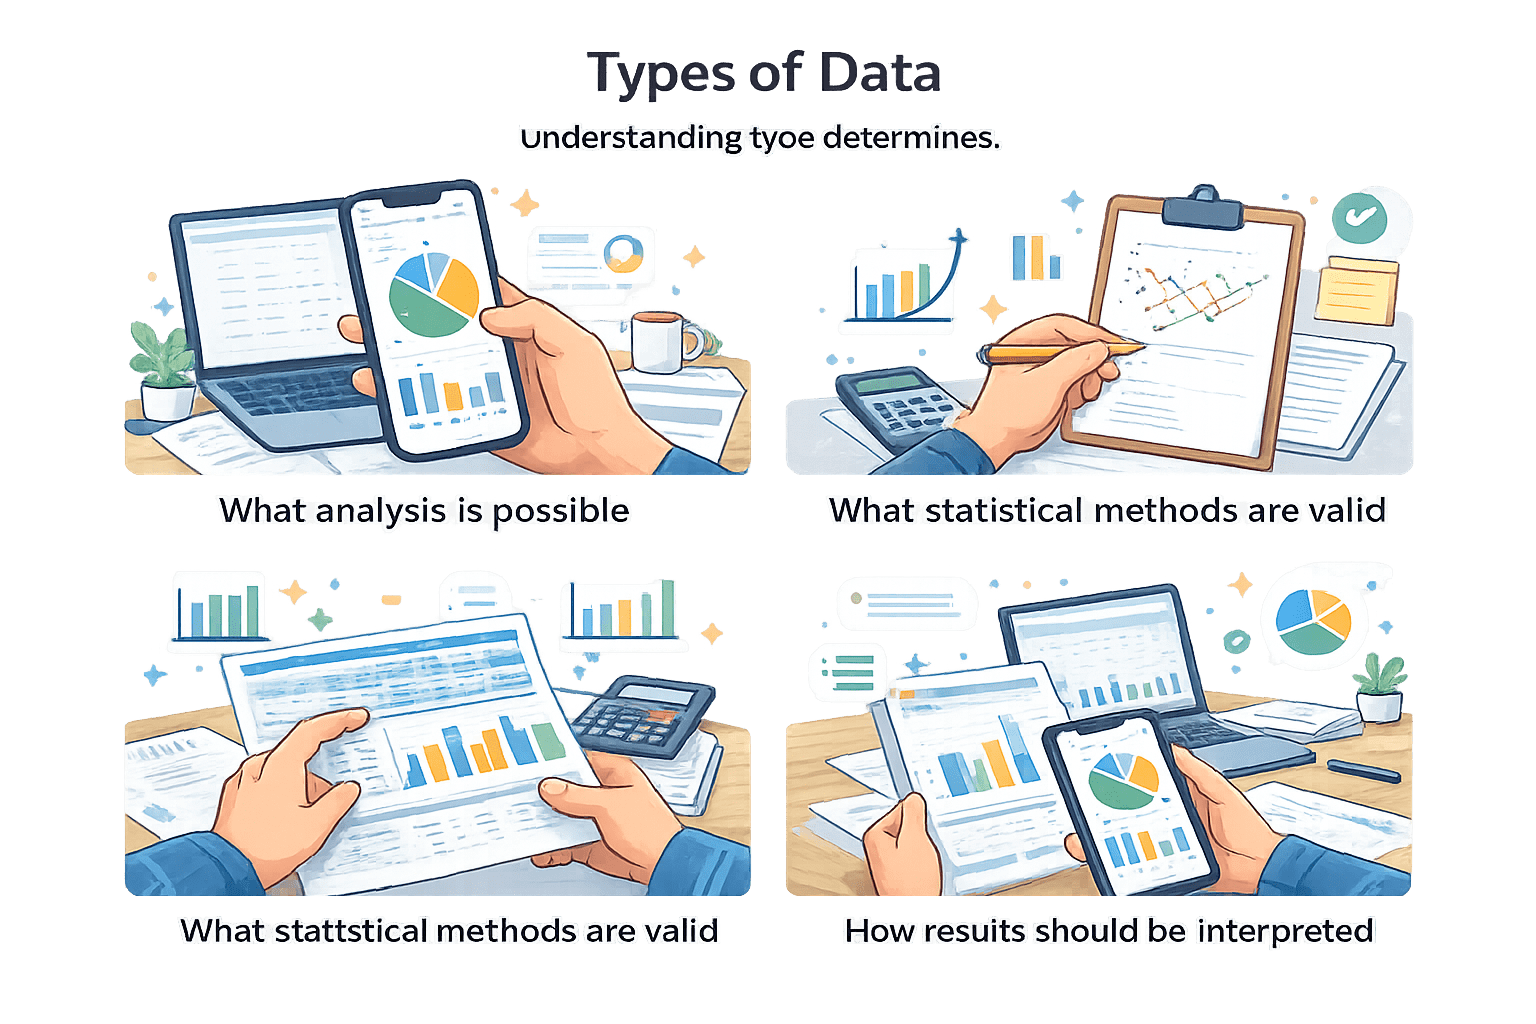
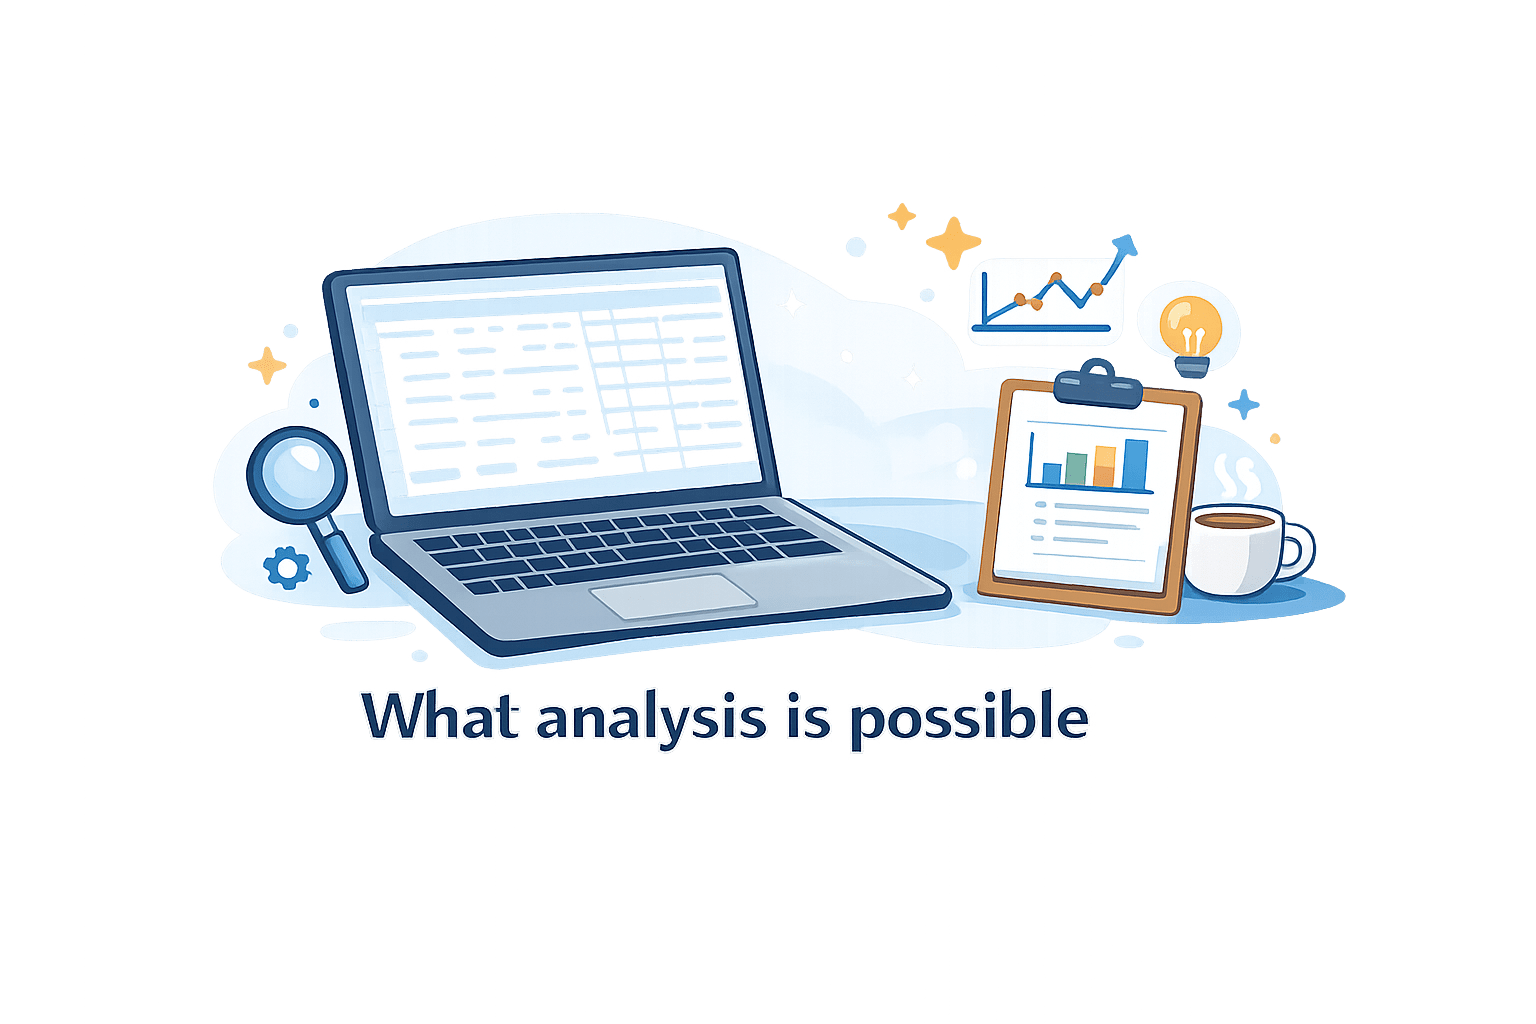
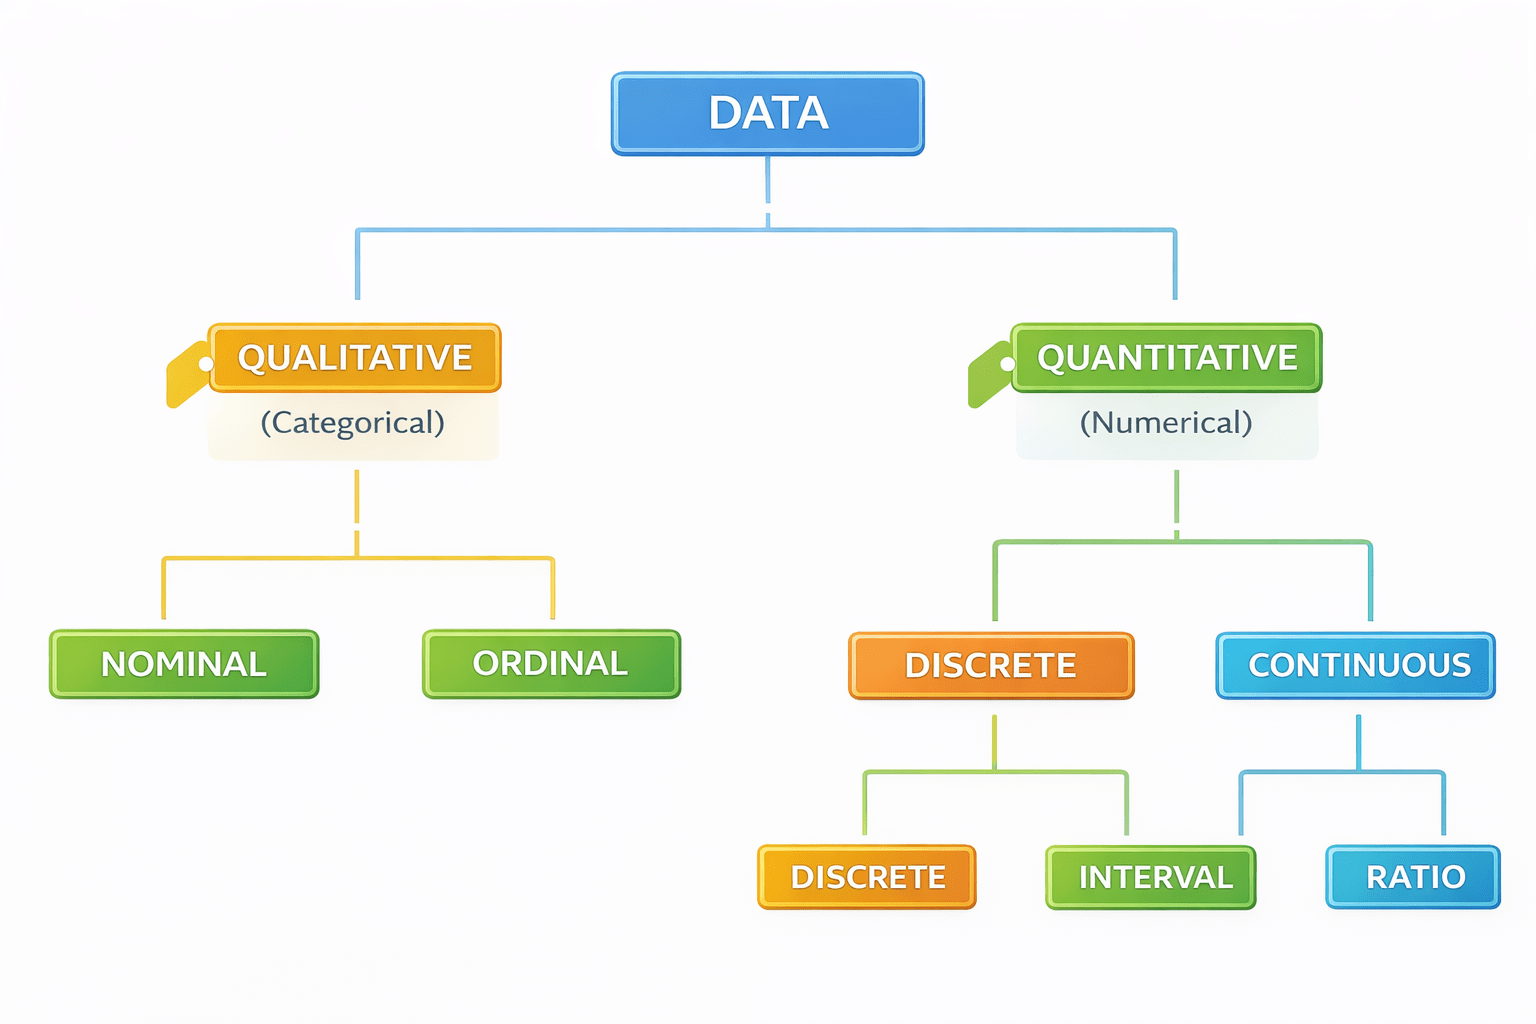
Types of Data
Understanding type determines:
How results should be interpreted
What analysis is possible
What statistical methods are valid
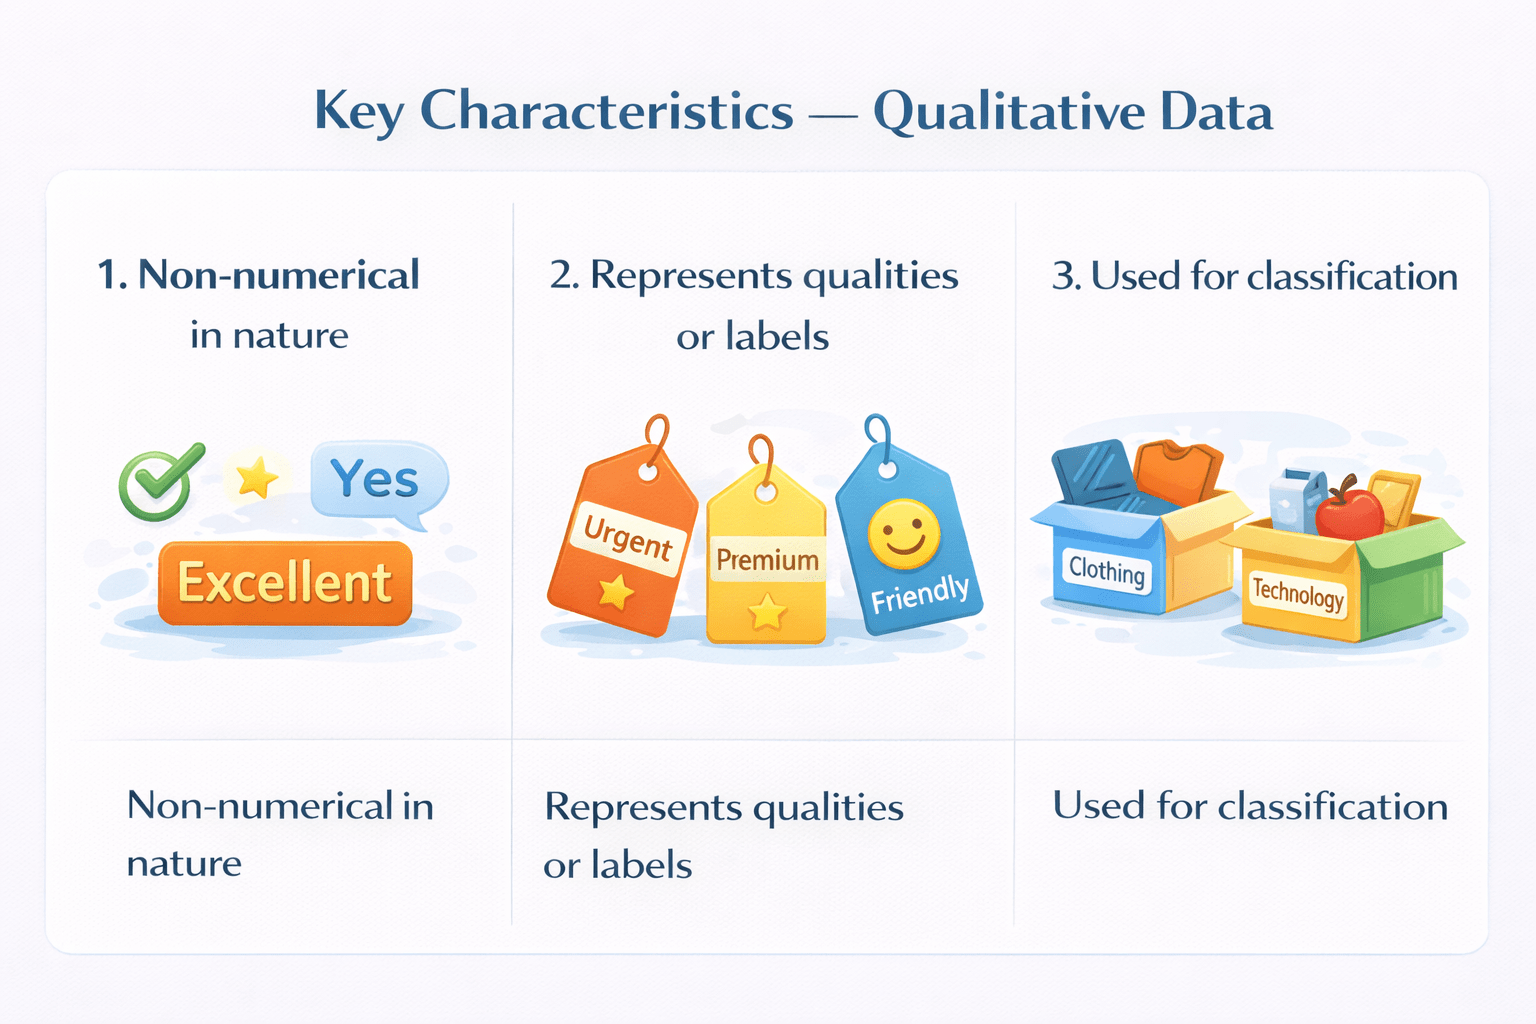
Qualitative Data
Descriptive data representing characteristics or categories.
3.Used for classification
2.Represents qualities or labels
1.Non-numerical in nature
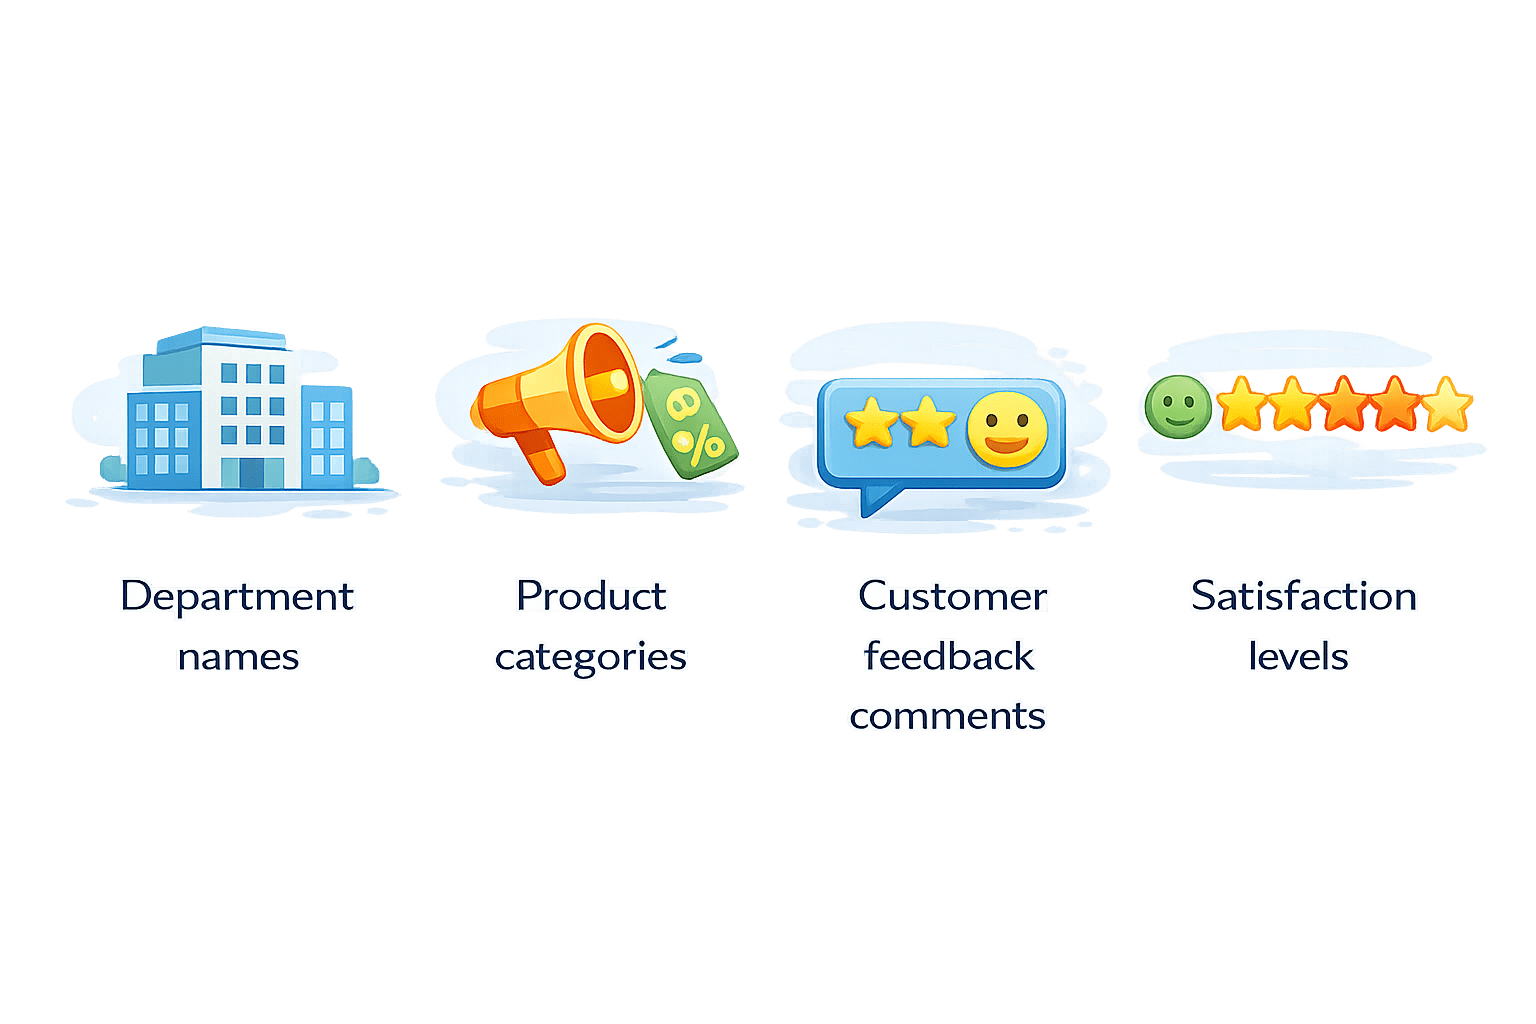
Example
Satisfaction levels
Customer feedback
omments
Product categories
Department names
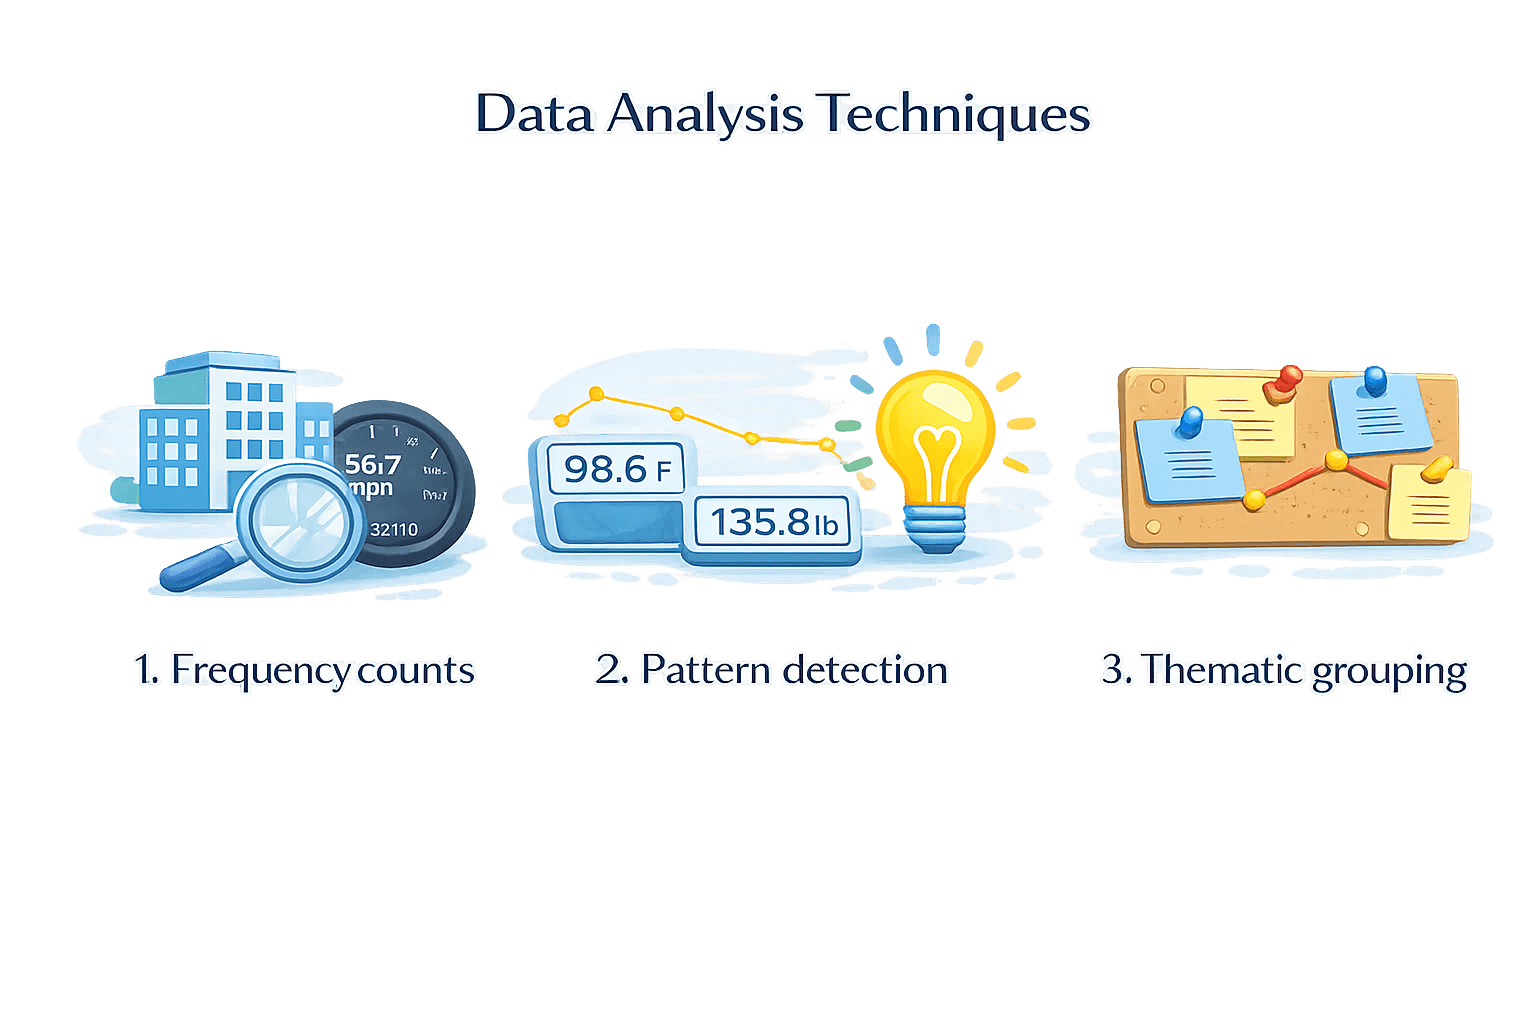
Analytical Implication:
Cannot be meaningfully averaged.
Primarily analyzed using:
Thematic grouping
Pattern detection
Frequency counts
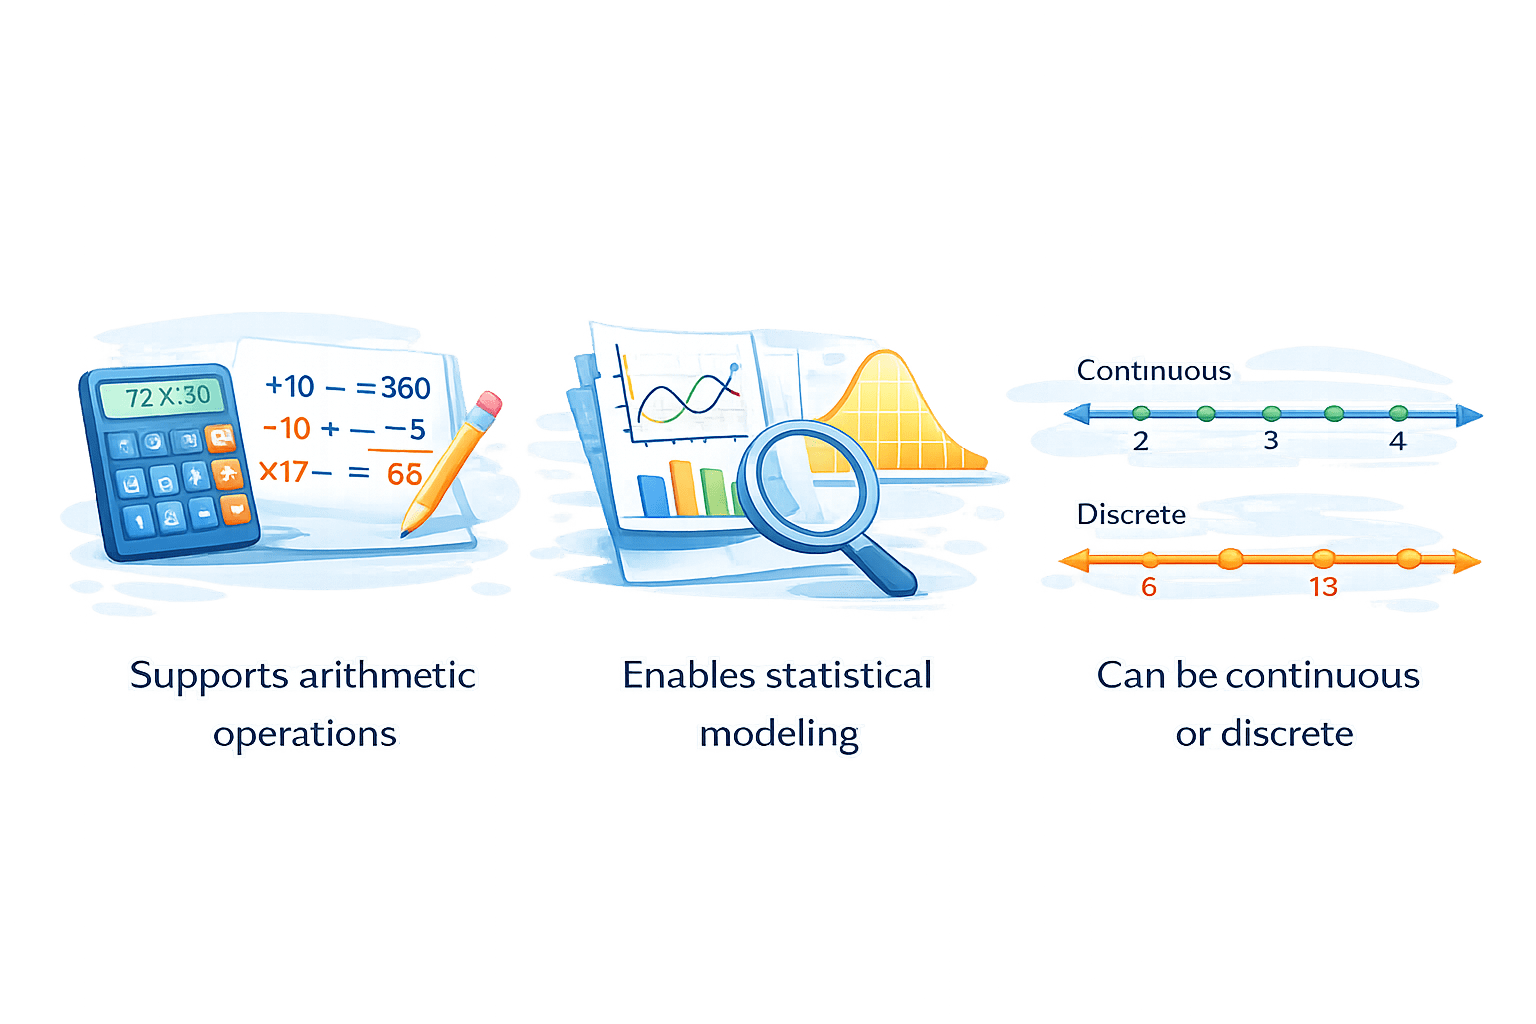
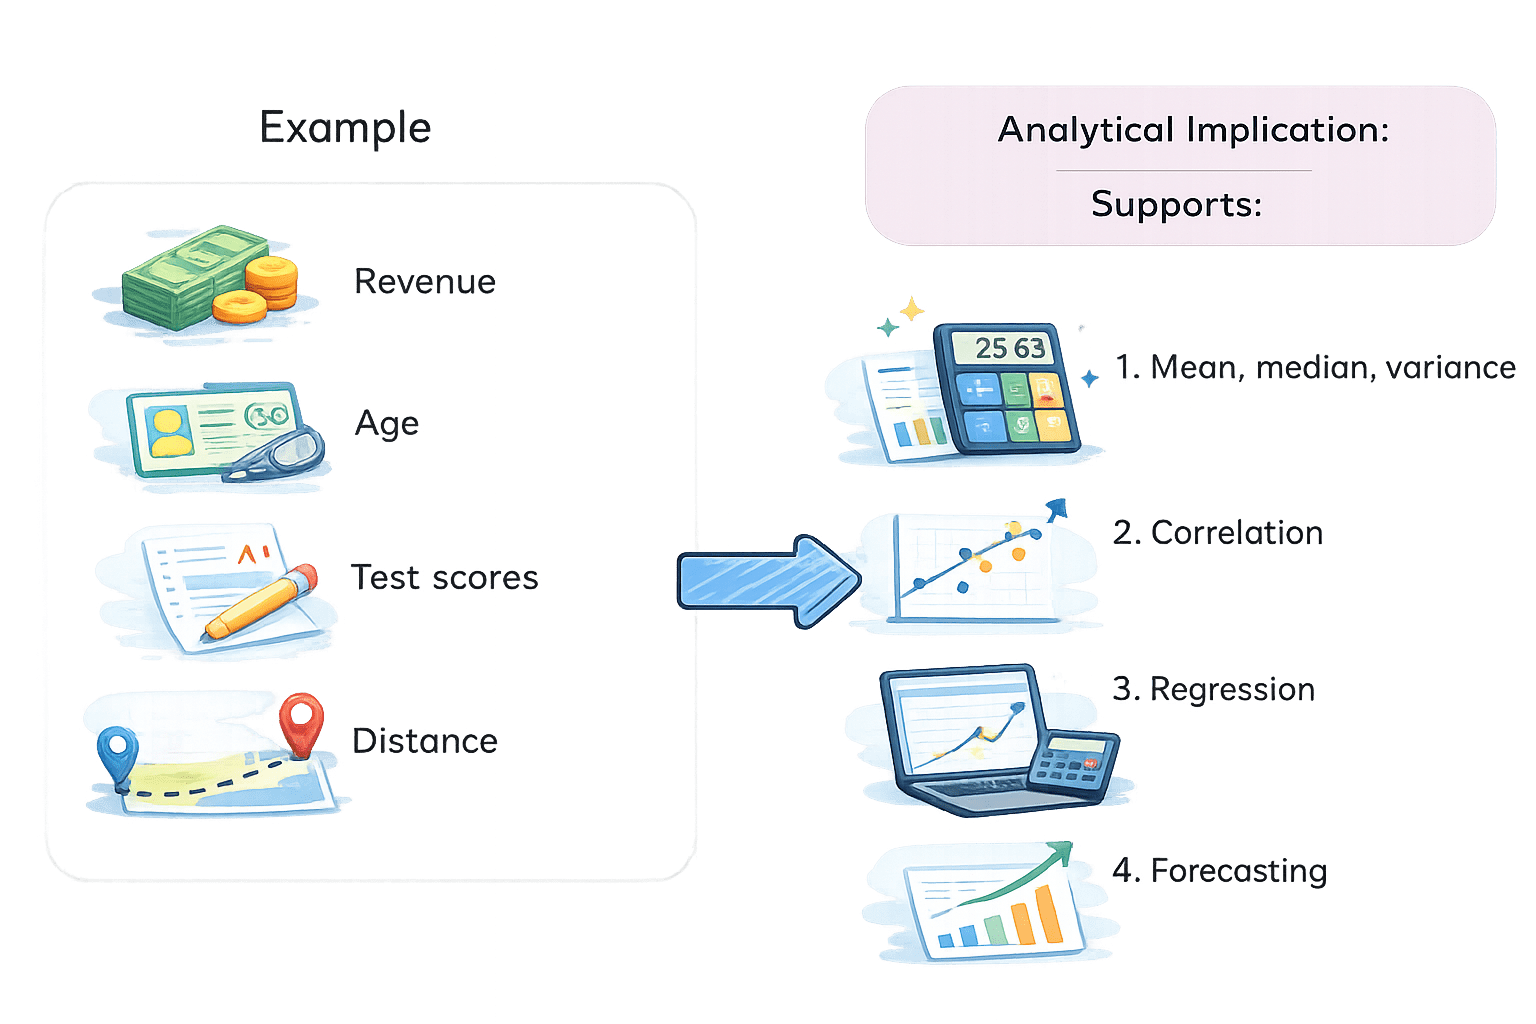
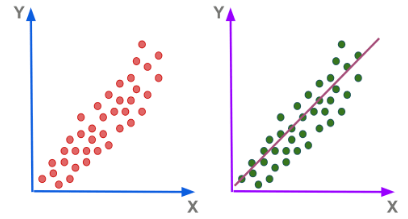
Quantitative Data
Numeric data representing measurable quantities.
Key Characteristics:
Supports arithmetic operations
Enables statistical modeling
Can be continuous or discrete
Example
Analytical Implication:
Cannot be meaningfully averaged.
Primarily analyzed using:
Correlation
Forcasting
Regression
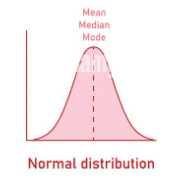
Mean,Median,Mode
RATIO
These is subtypes of qualitative data
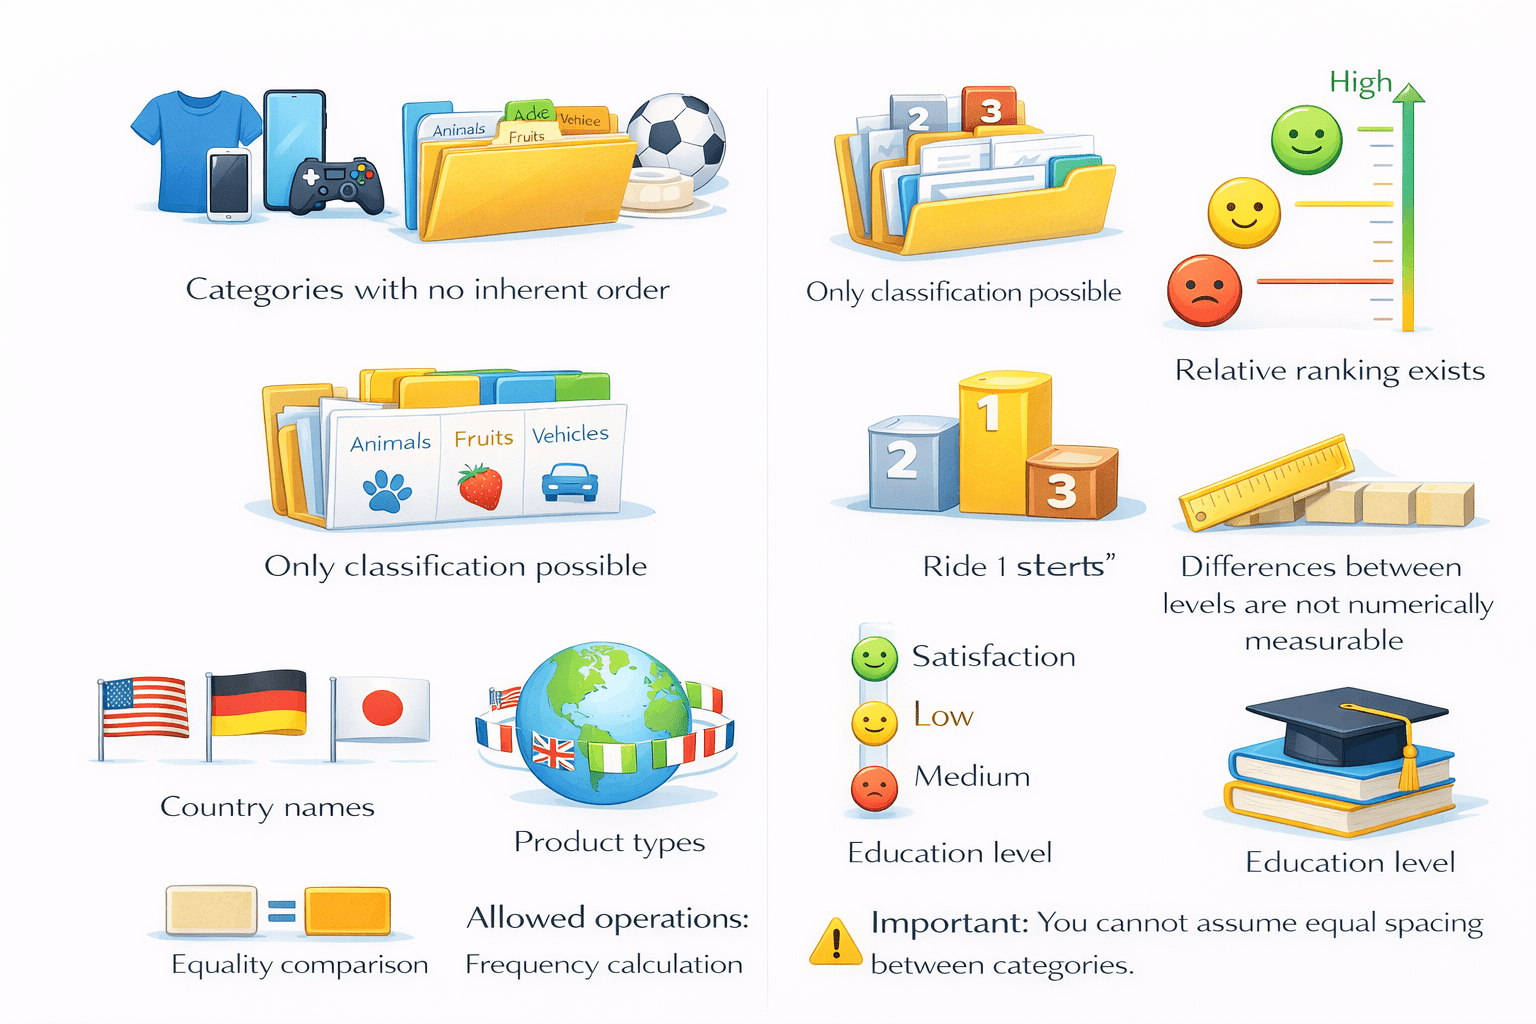
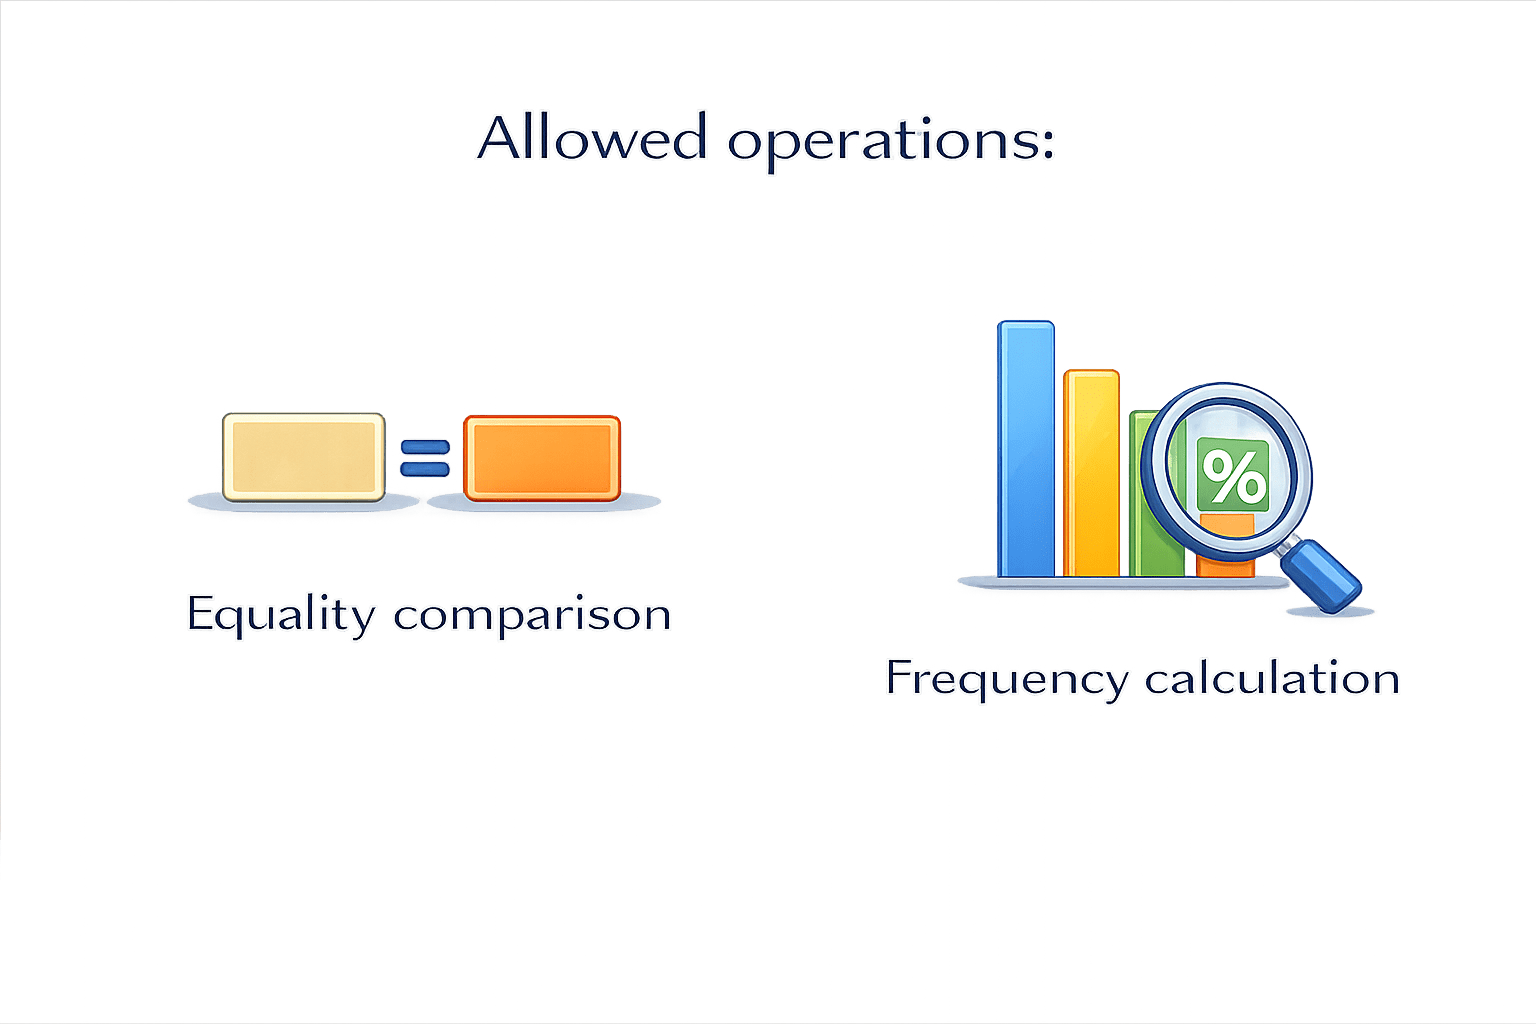
Nominal Data
Categories with no inherent order
Only classification possible
No ranking
Country Names
Product types
Example:
Equality
comparision
Frequency
calculation
Allowed operation
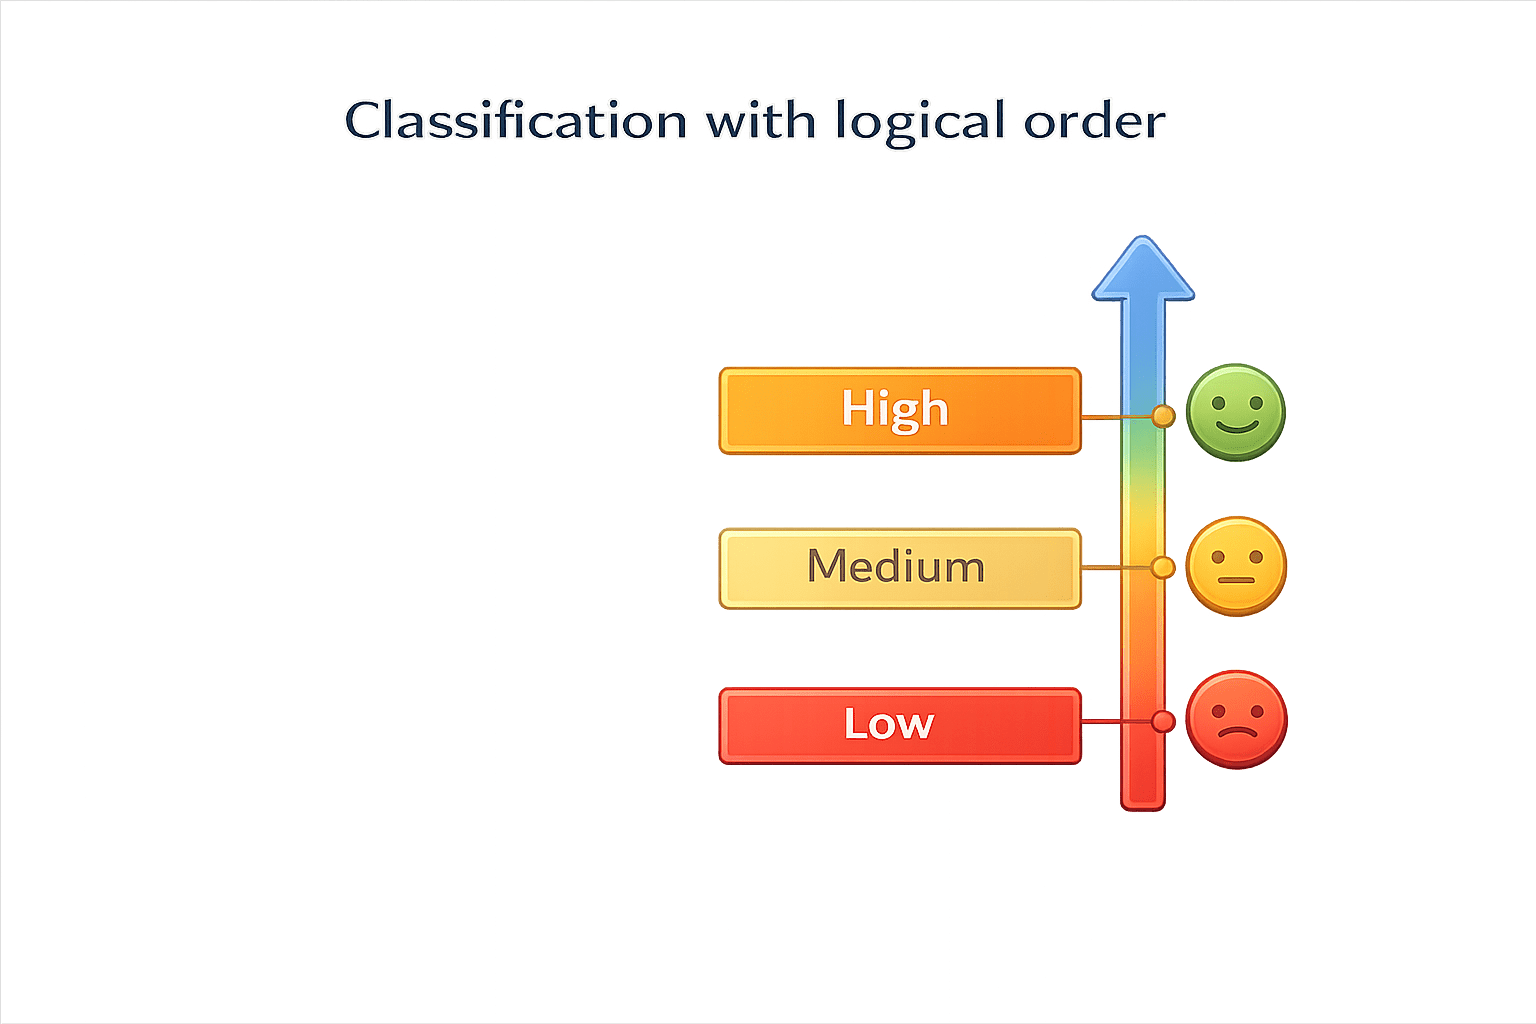
Ordinal Data
Categories with logical order
Relative ranking exists
Differences between levels are not numerically measurable
You should not treat ordinal data like numerical data
Example:
Good
Okay
Bad
Education level
Satisfaction Level
These is subtypes of quantitative data
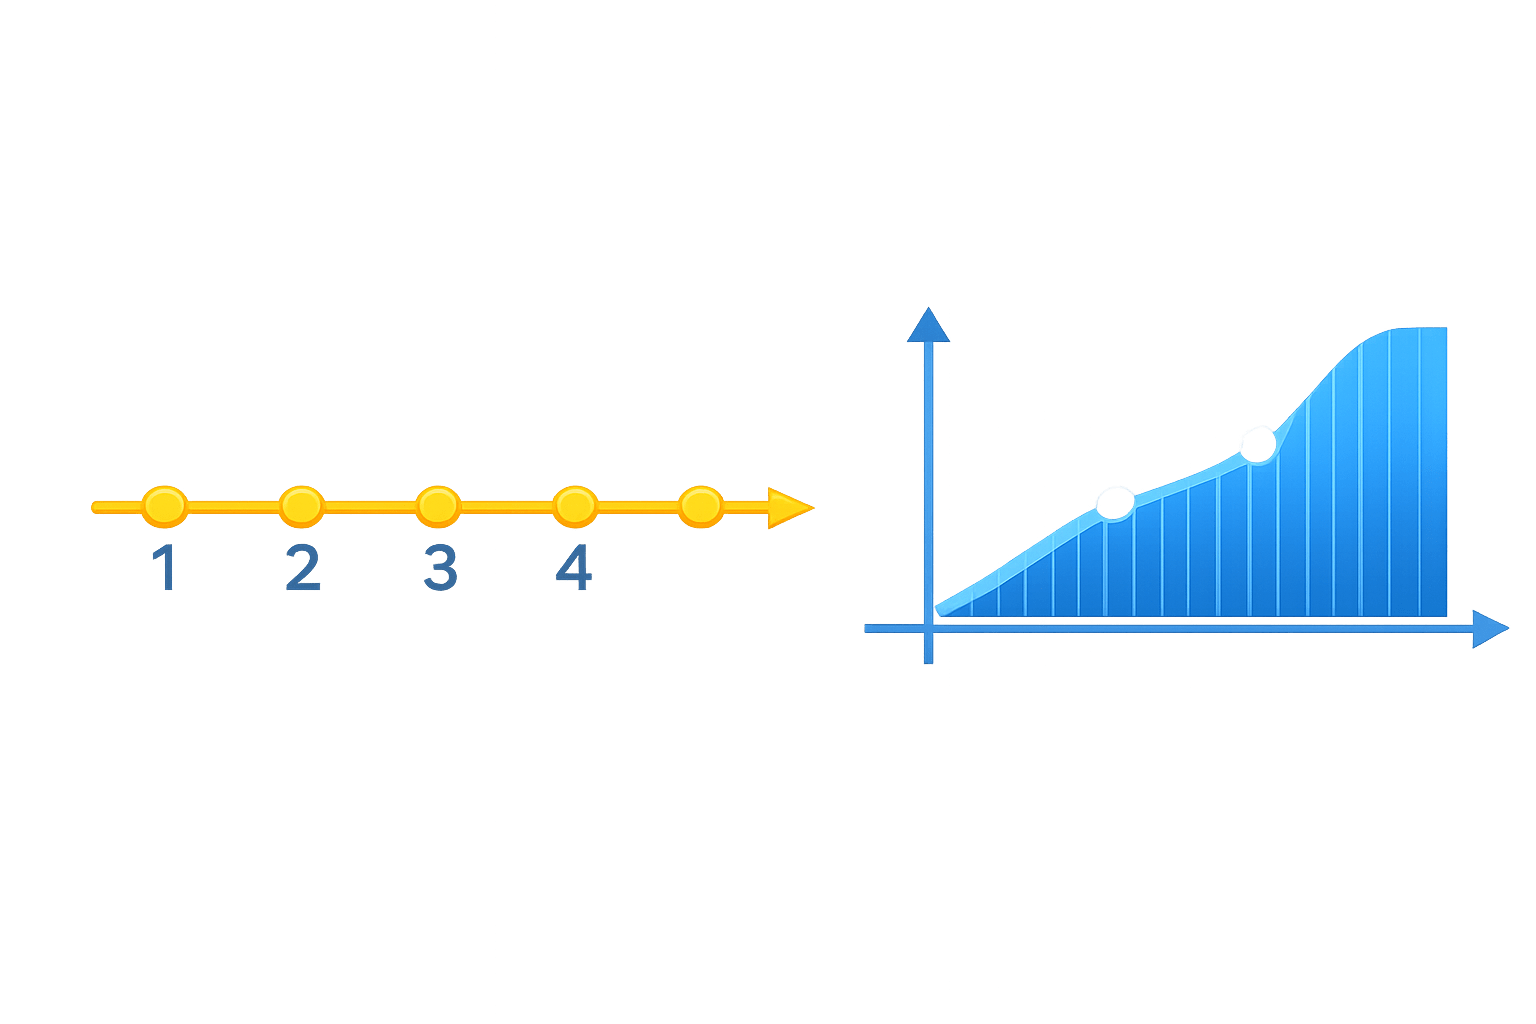
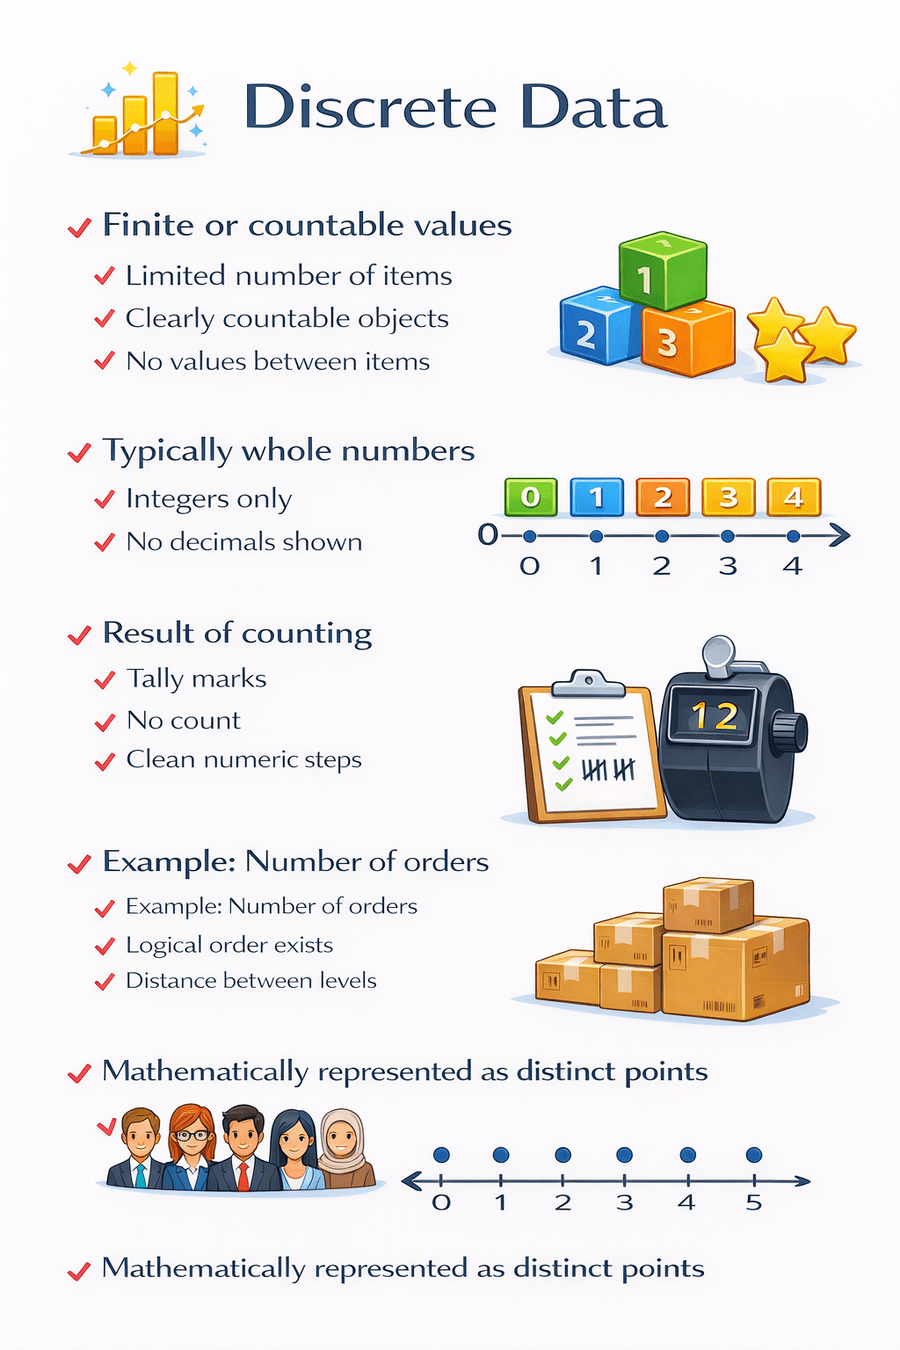
Discrete Data
Finite or countable values
Typically whole numbers
Result of counting
Mathematically represented as distinct points.
Example:
Number of employees
Number of orders
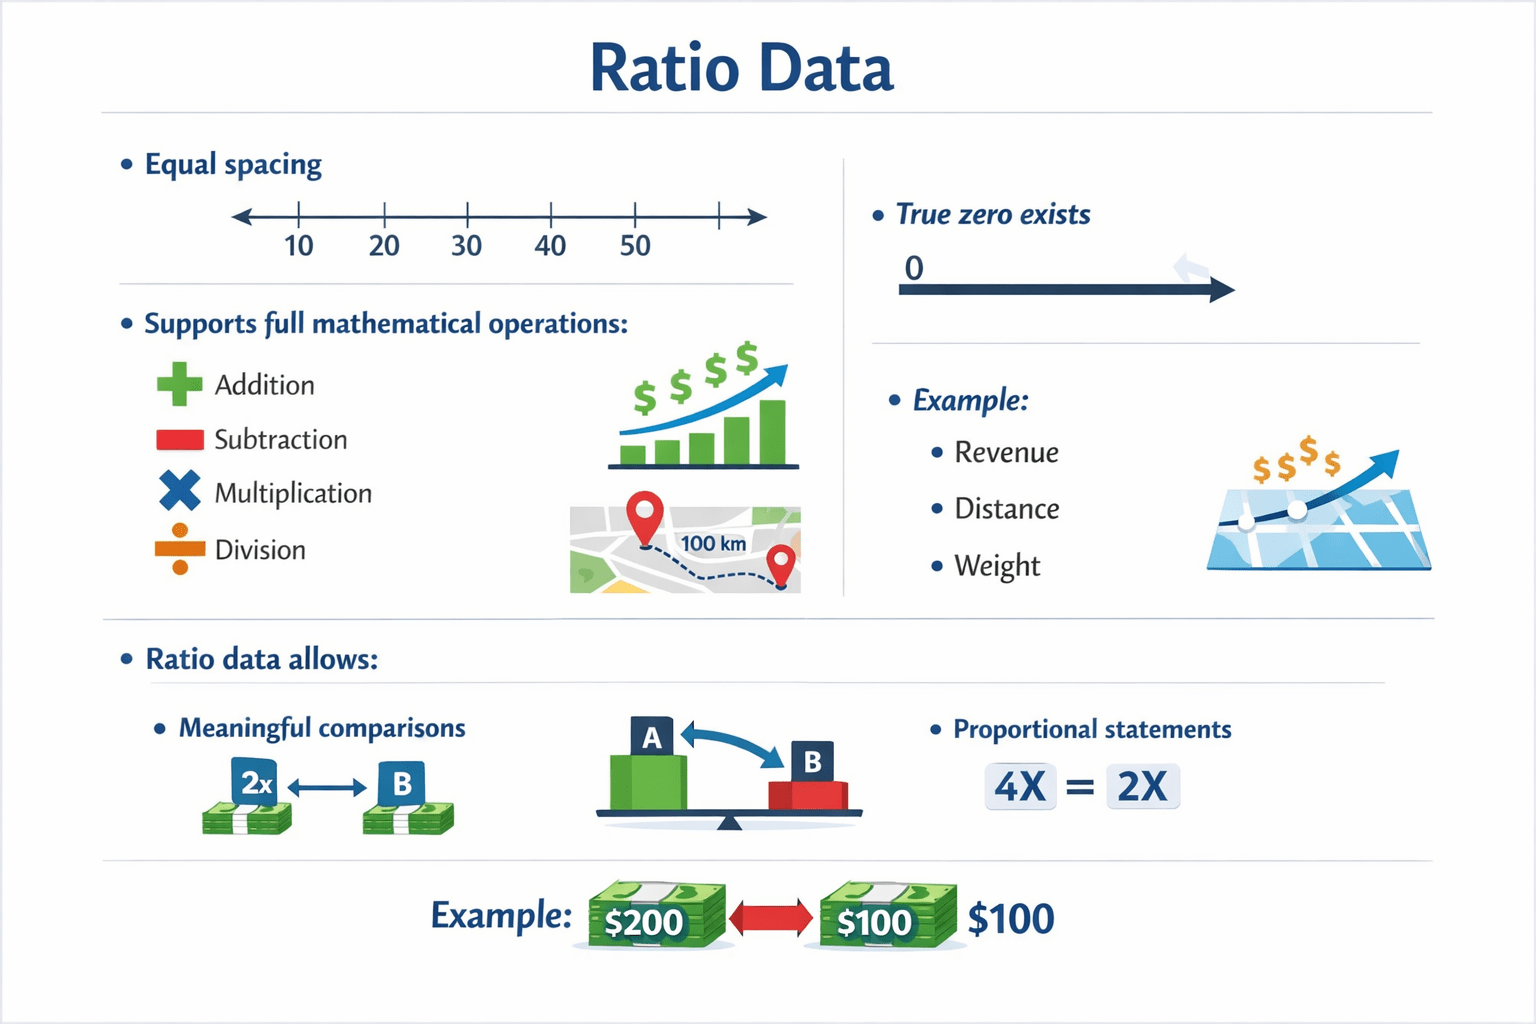
Ratio Data
Equal spacing
True zero exists
Supports full mathematical operations
Addition
Subtraction
Multipication
Division
Proportional statements
Ratio data allows:
Example:
Revenue
Distance
Weight
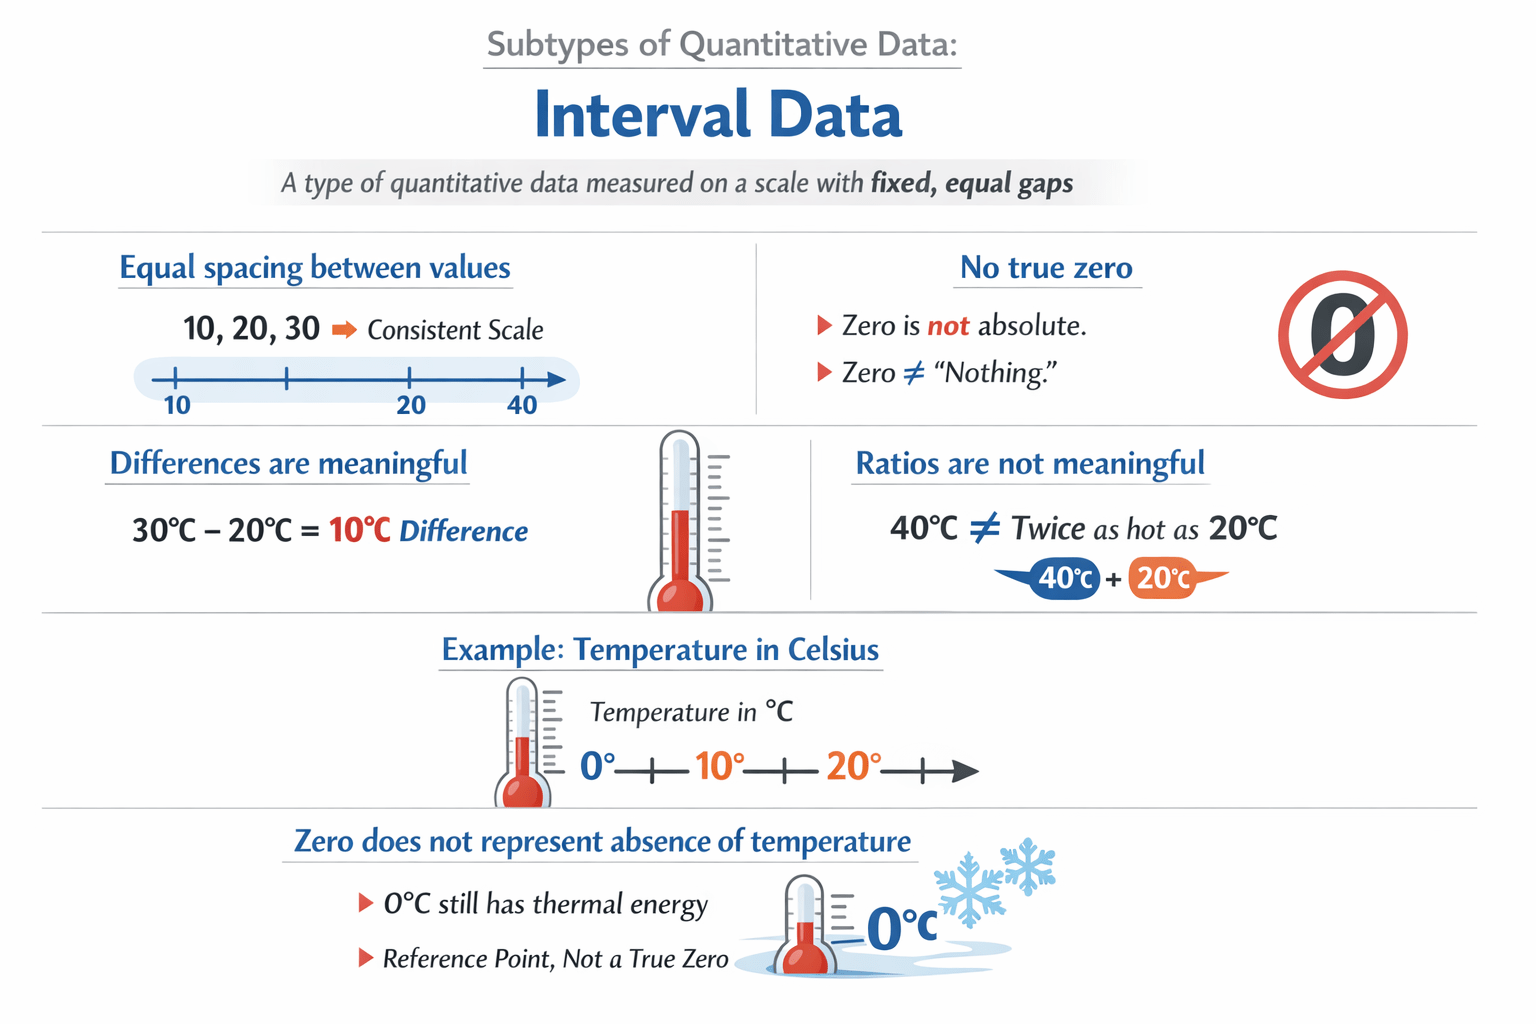
Interval Data
Equal spacing between values
Differences are meaningful
Example:
Temperature in Celsius
Zero does not represent absence of temperature.
These is subtypes of quantitative data
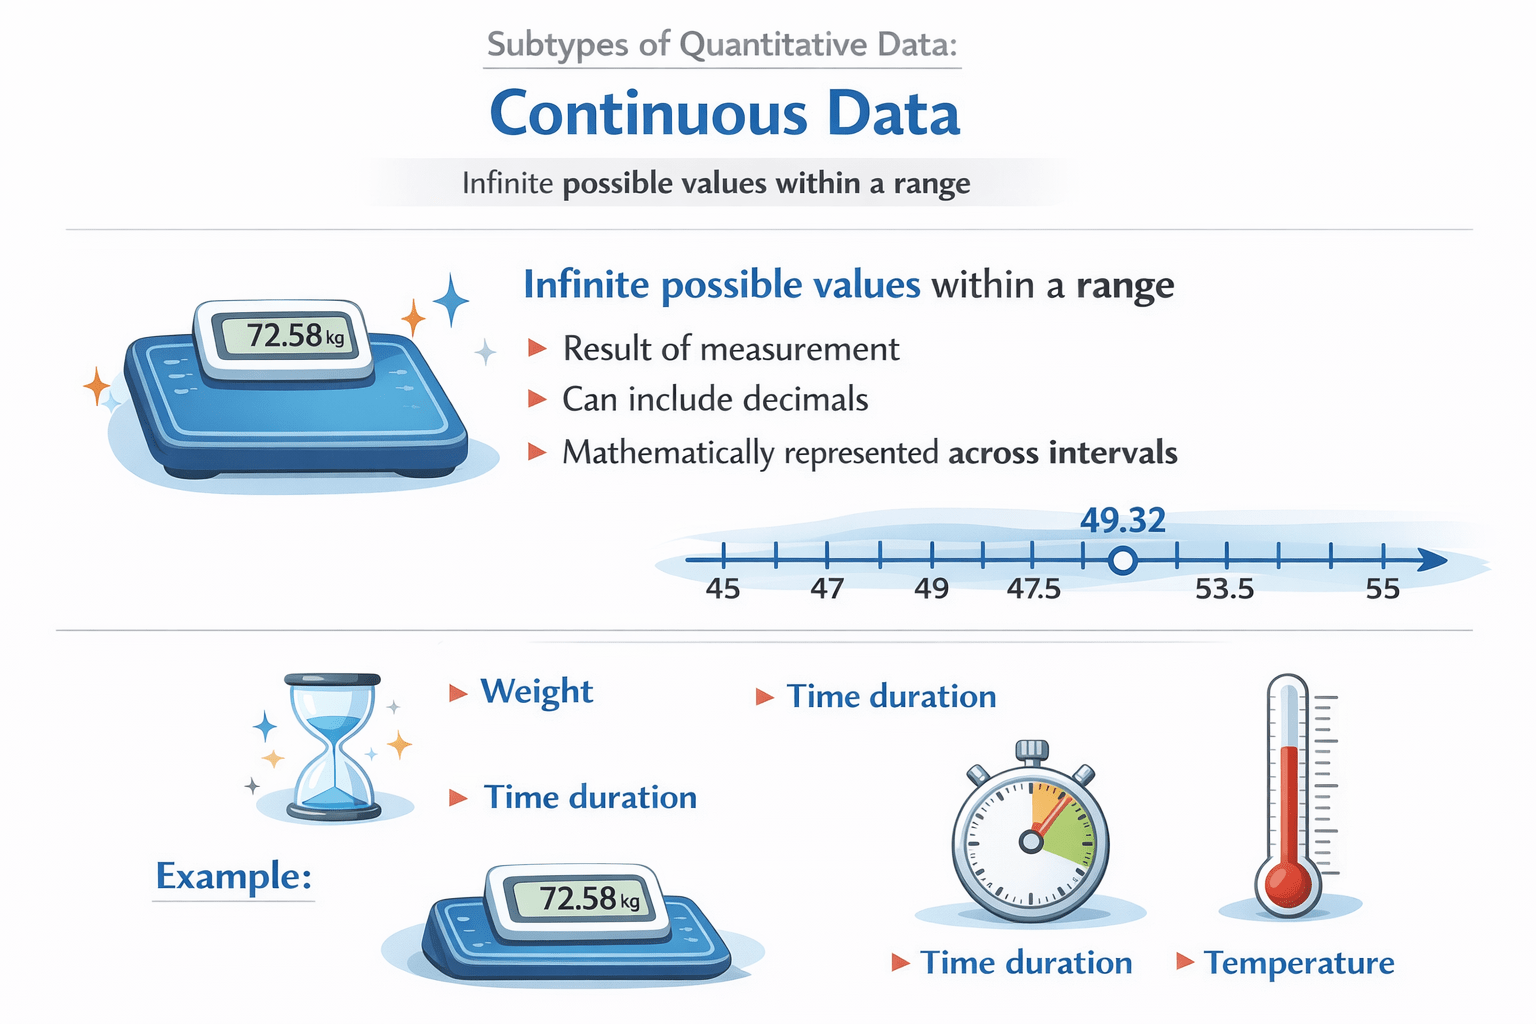
Continuous Data
Infinite possible values within a range
Result of measurement
Can include decimals
Example:
Weight
Temperature
Time duration
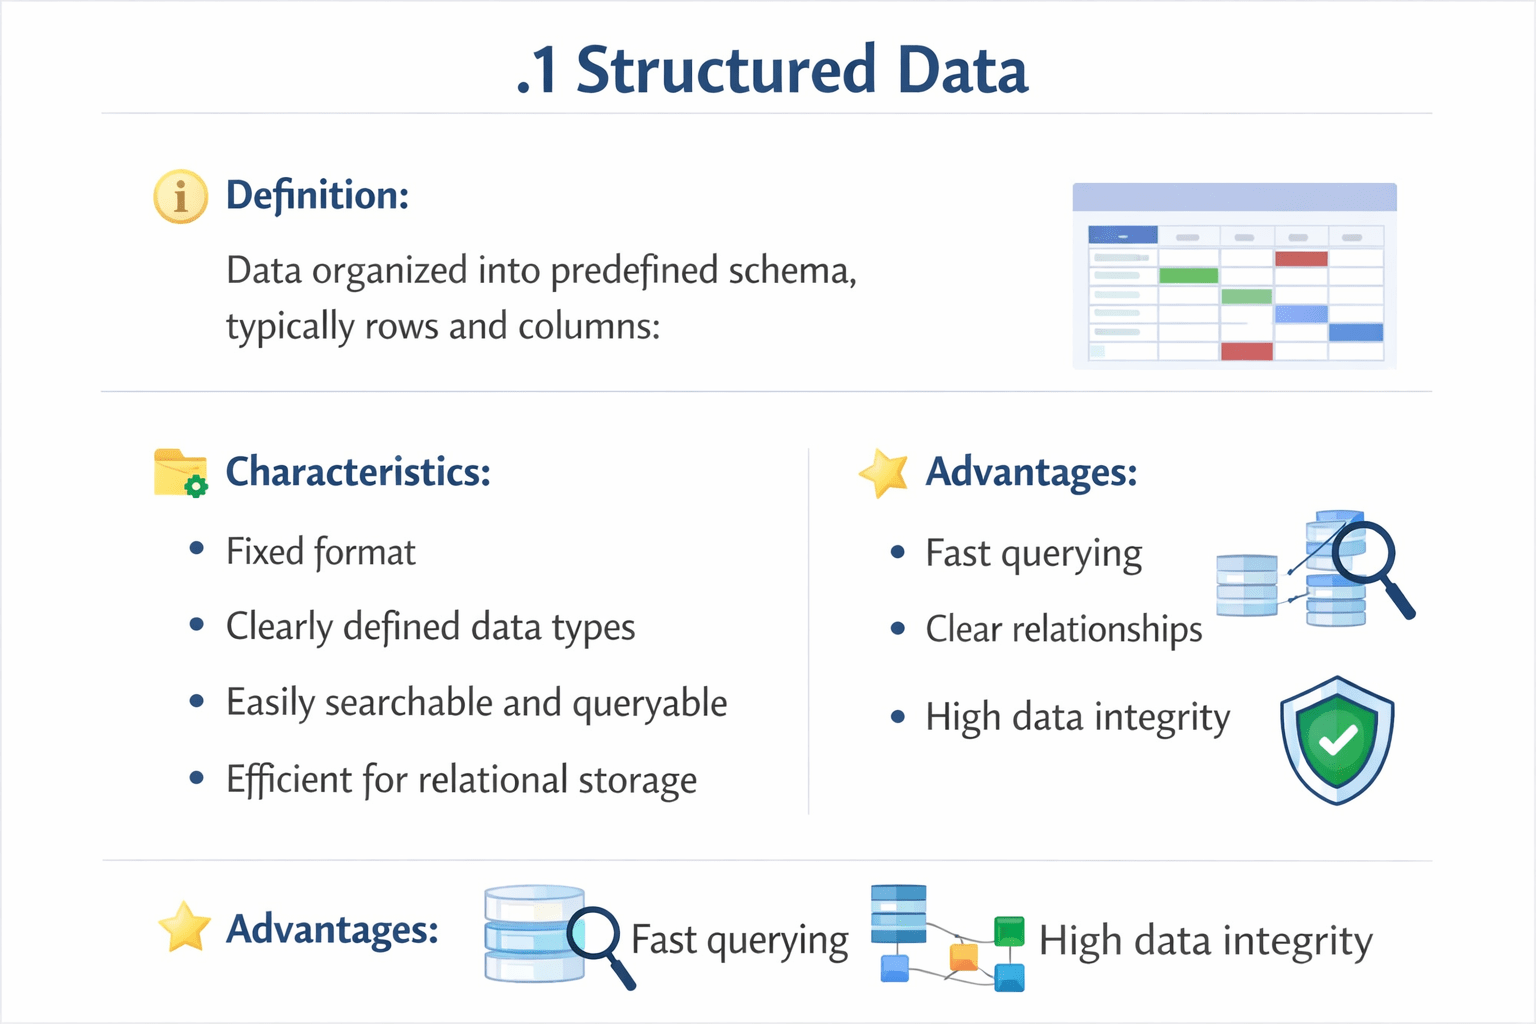
Structured Data
Data organized into predefined schema, typically rows and columns.
Characteristics:
Fixed format
Clearly defined data types
Easily searchable and queryable
Efficient for relational storage
Advantages:
Fast querying
Clear relationships
High data integrity
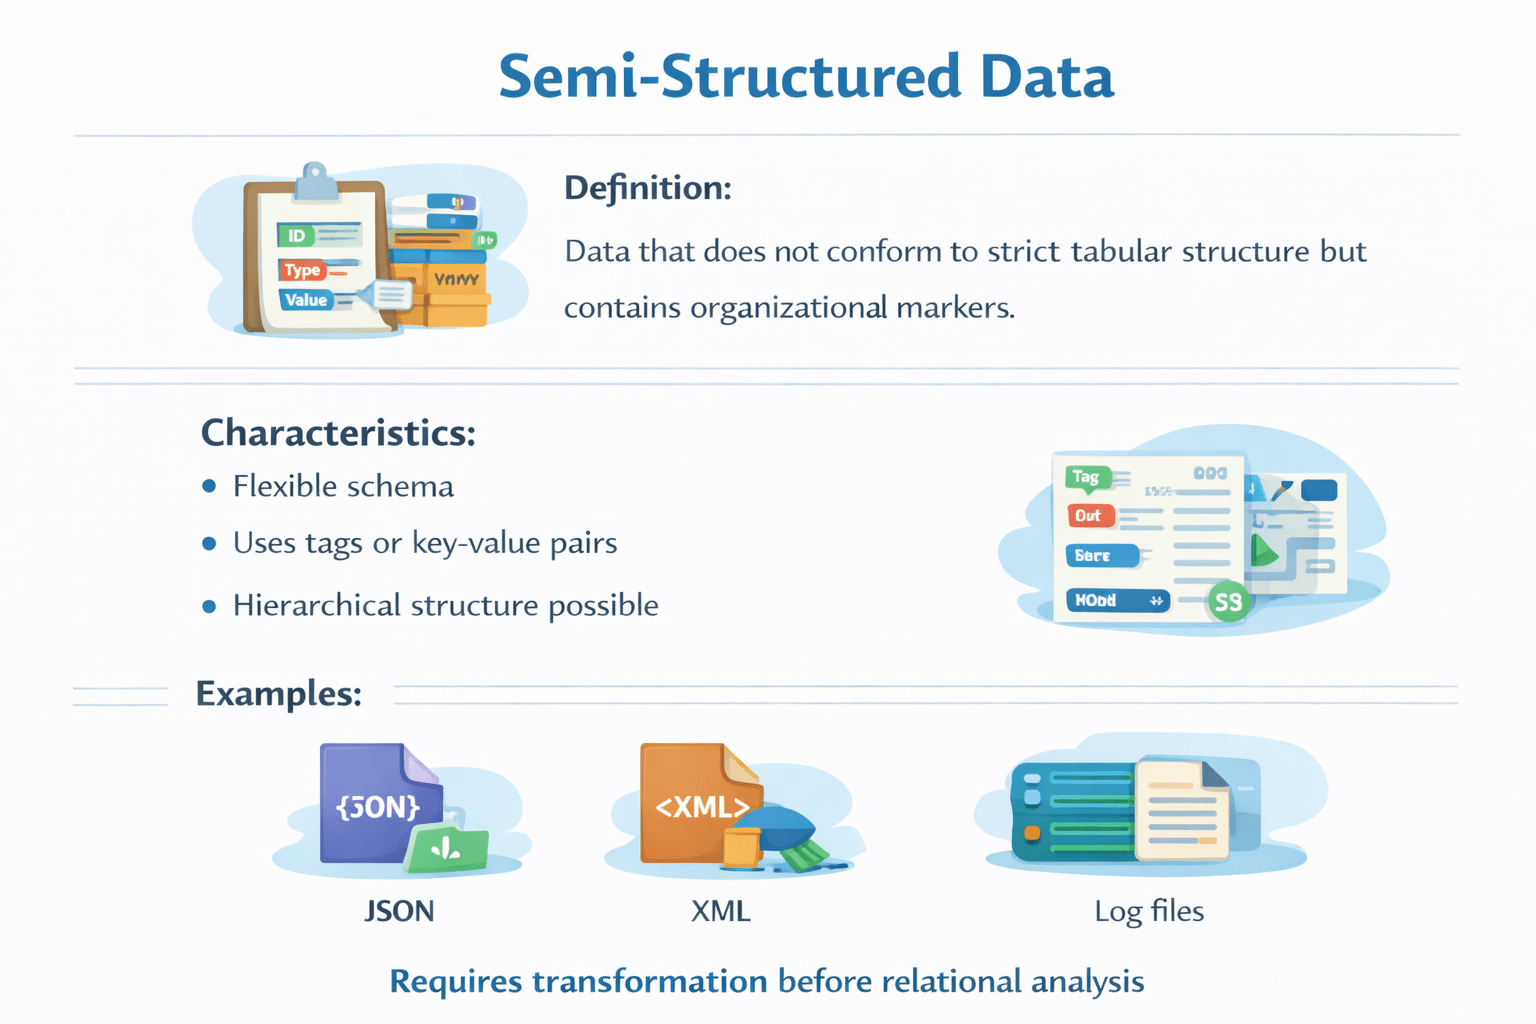
Semi-Structured Data
Characteristics:
Flexible schema
Uses tags or key-value pairs
Hierarchical structure possible
Definition:
Data that does not conform to strict tabular structure but contains organizational markers.
JSON
Log Files
XML
Uses
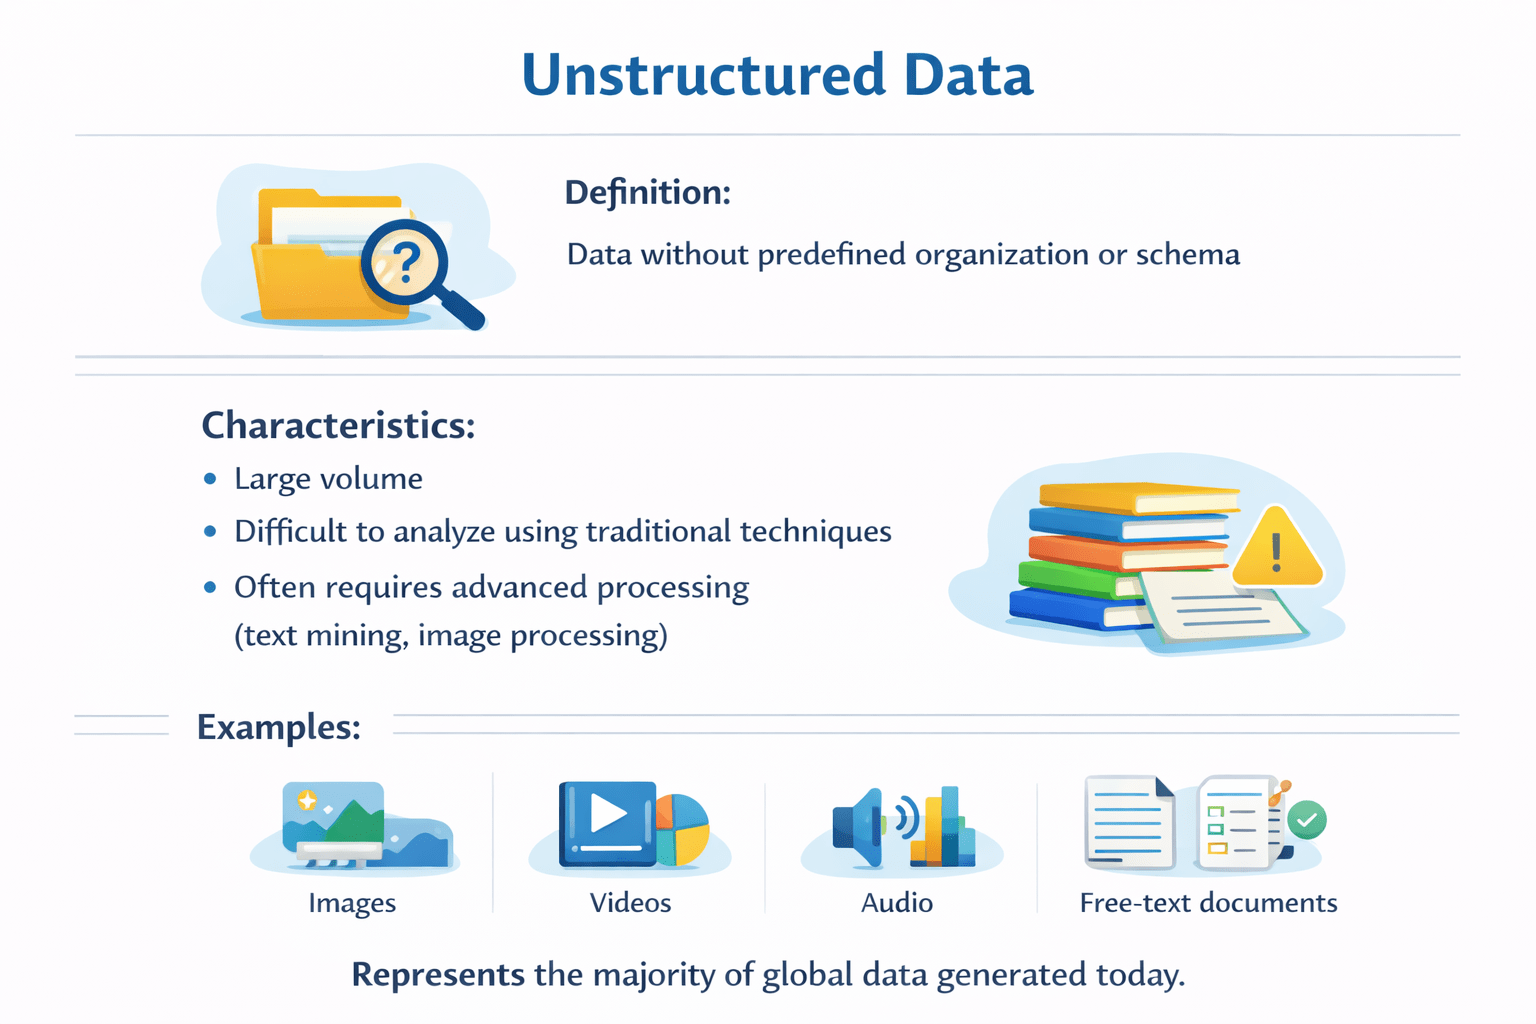
Unstructured Data
Characteristics:
Large volume
Difficult to analyze using traditional techniques
Often requires advanced processing (text mining, image processing)
Definition:
Data without predefined organization or schema.
Images
Audio
VIdeos
Free-text documents
Uses:
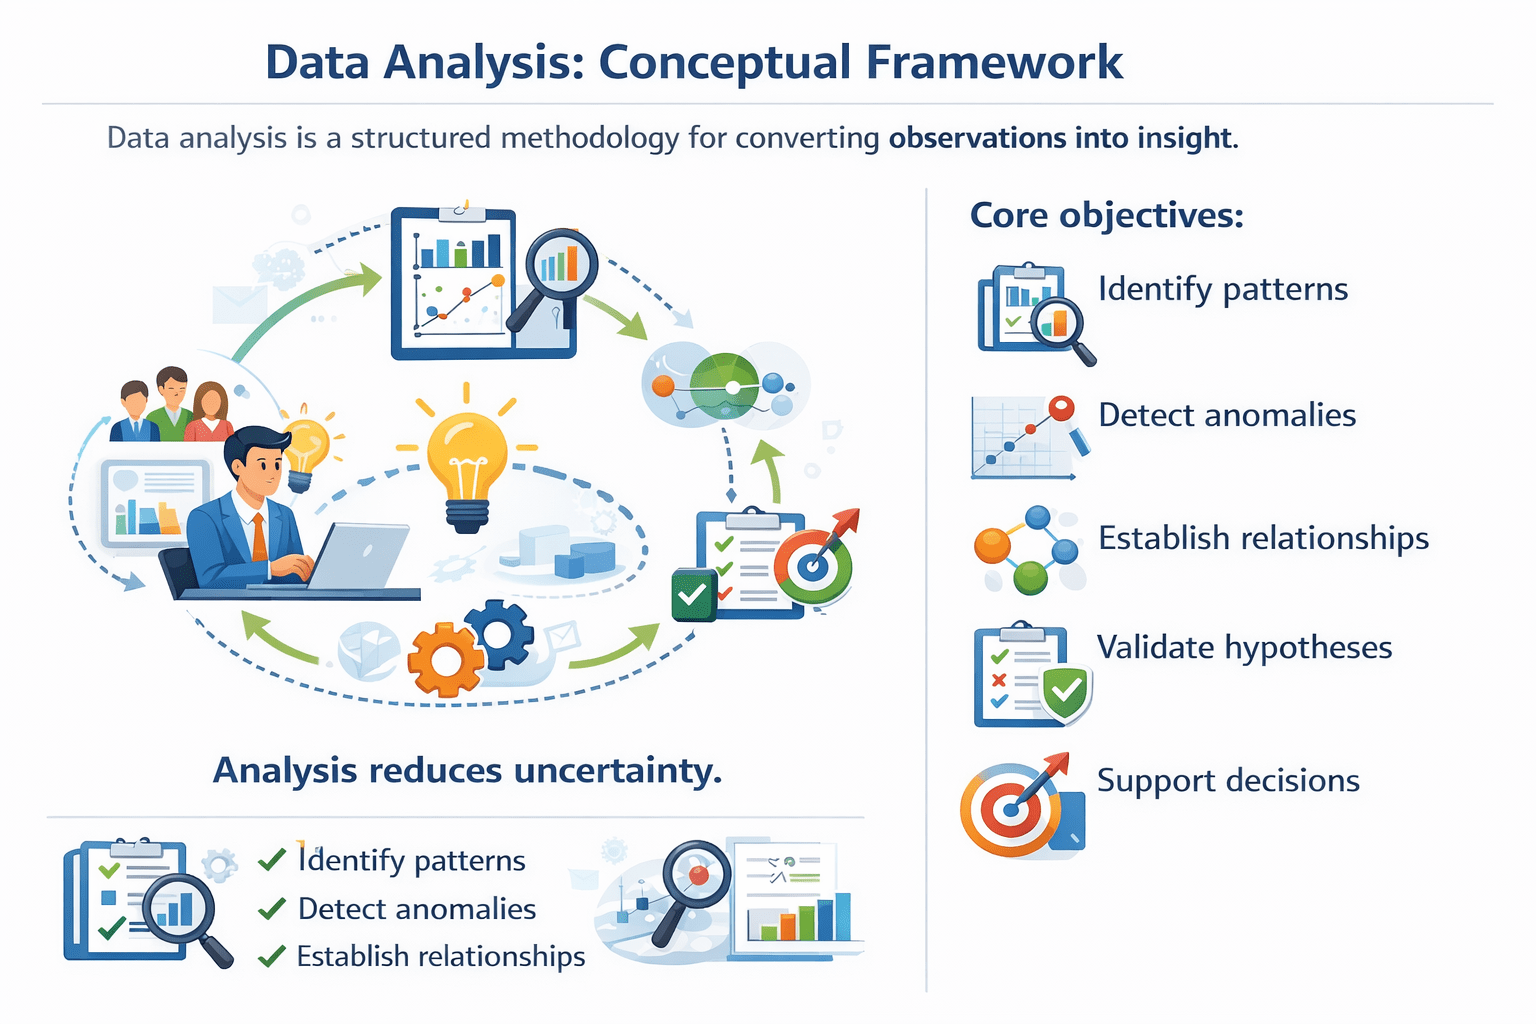
Data Analysis: Conceptual Framework
Data analysis is a structured methodology for converting observations into insight.
Analysis reduces uncertainty.
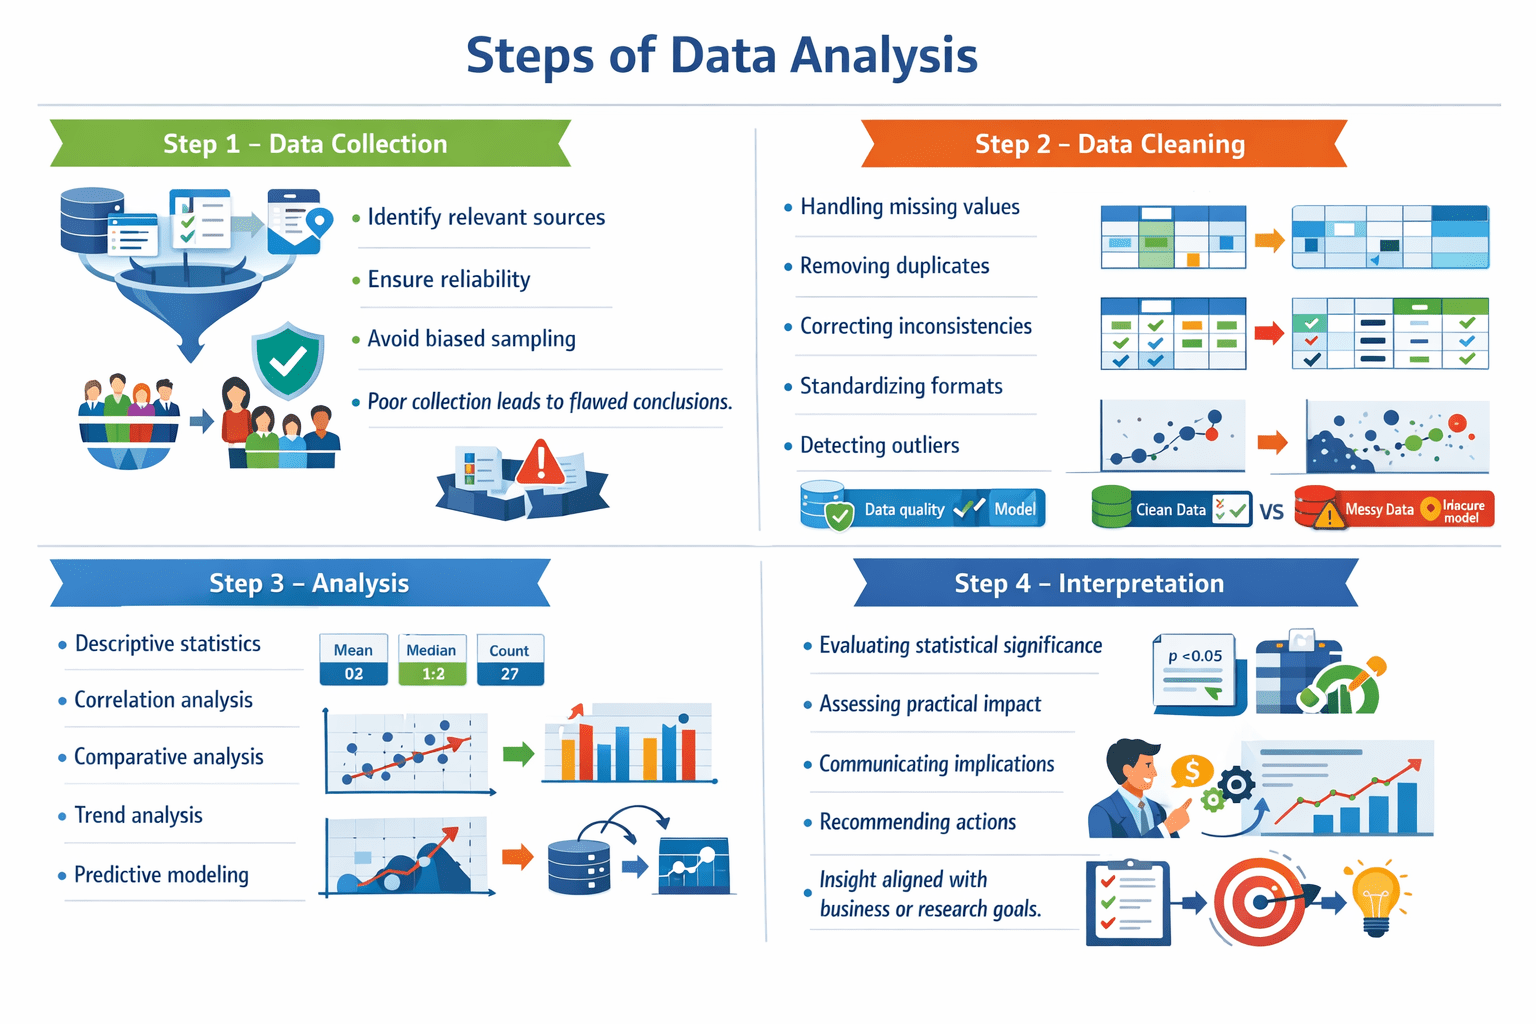
Steps of Data Analysis
Step 1 – Data Collection
Identify relevant sources
Ensure reliability
Avoid biased sampling
Poor collection leads to flawed conclusions.
Step 2 – Data Cleaning
Critical stage.
Includes:
Handling missing values
Removing duplicates
Correcting inconsistencies
Standardizing formats
Detecting outliers
Data quality directly impacts model accuracy.
Steps of Data Analysis
Step 3 – Analysis
Techniques include:
Descriptive statistics
Correlation analysis
Comparative analysis
Trend analysis
Predictive modeling
Choice of method depends on data type
and objective.
Steps of Data Analysis
Step 4 – Interpretation
Involves:
Evaluating statistical significance
Assessing practical impact
Communicating implications
Recommending actions
Insight must align with business
or research goals.and objective.
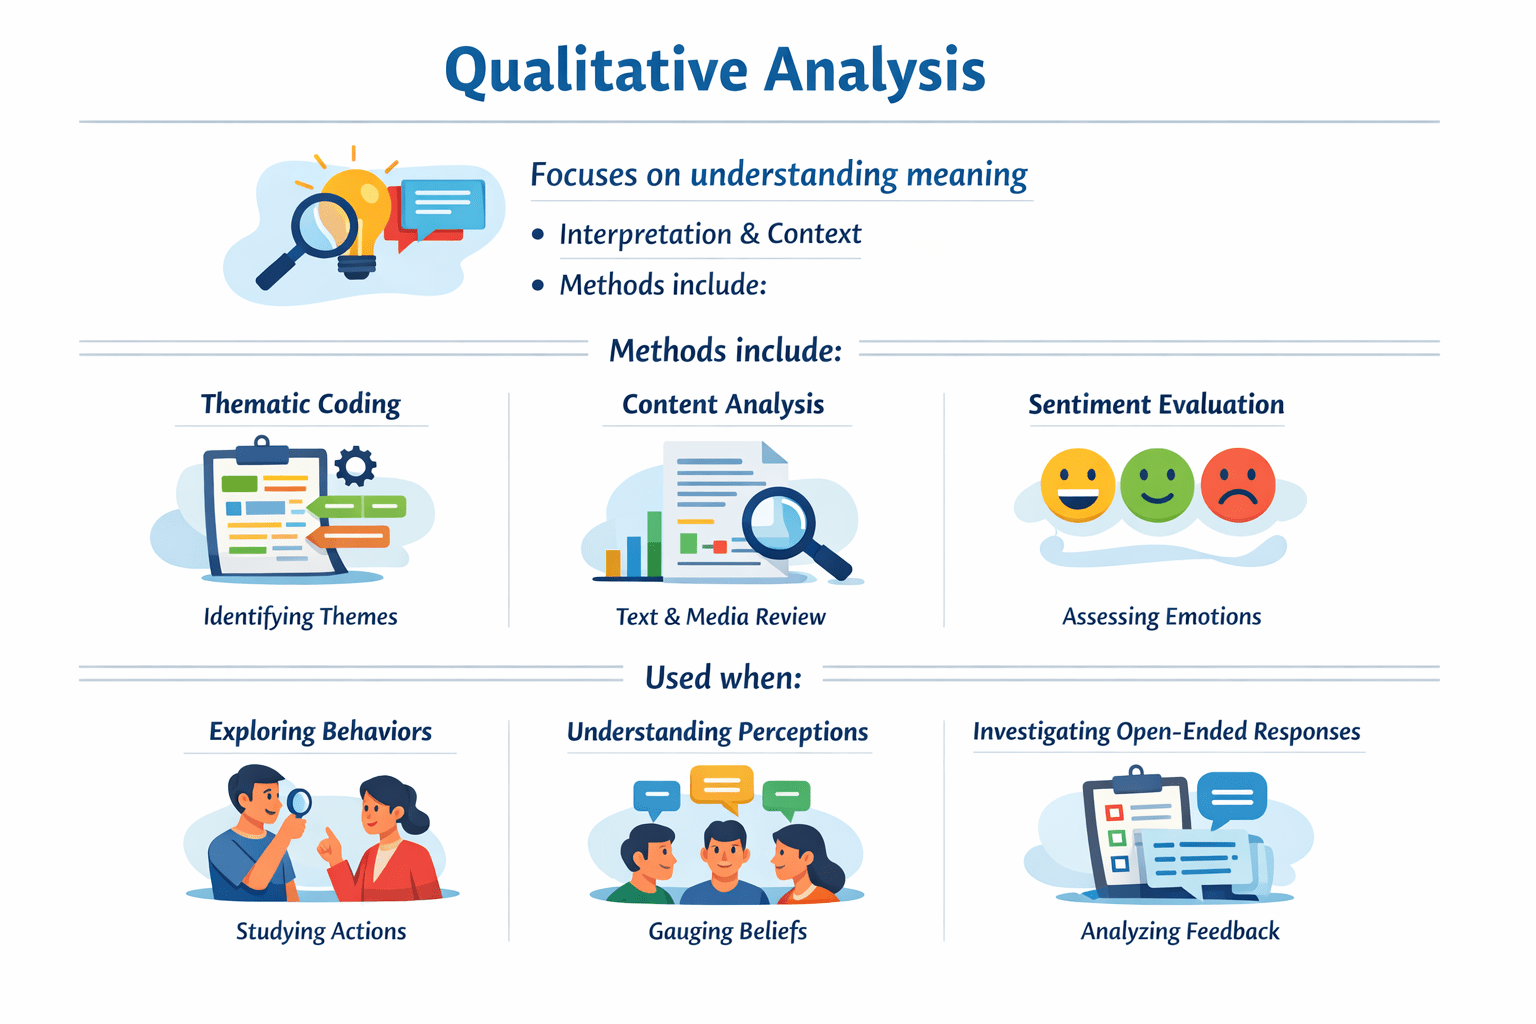
Qualitative Analysis
Thematic coding
Sentiment evaluation
Content analysis
Exploring
behaviors
Investigating open-ended responses
Understanding
perceptions
Focuses on understanding meaning.
Method Include
Used When
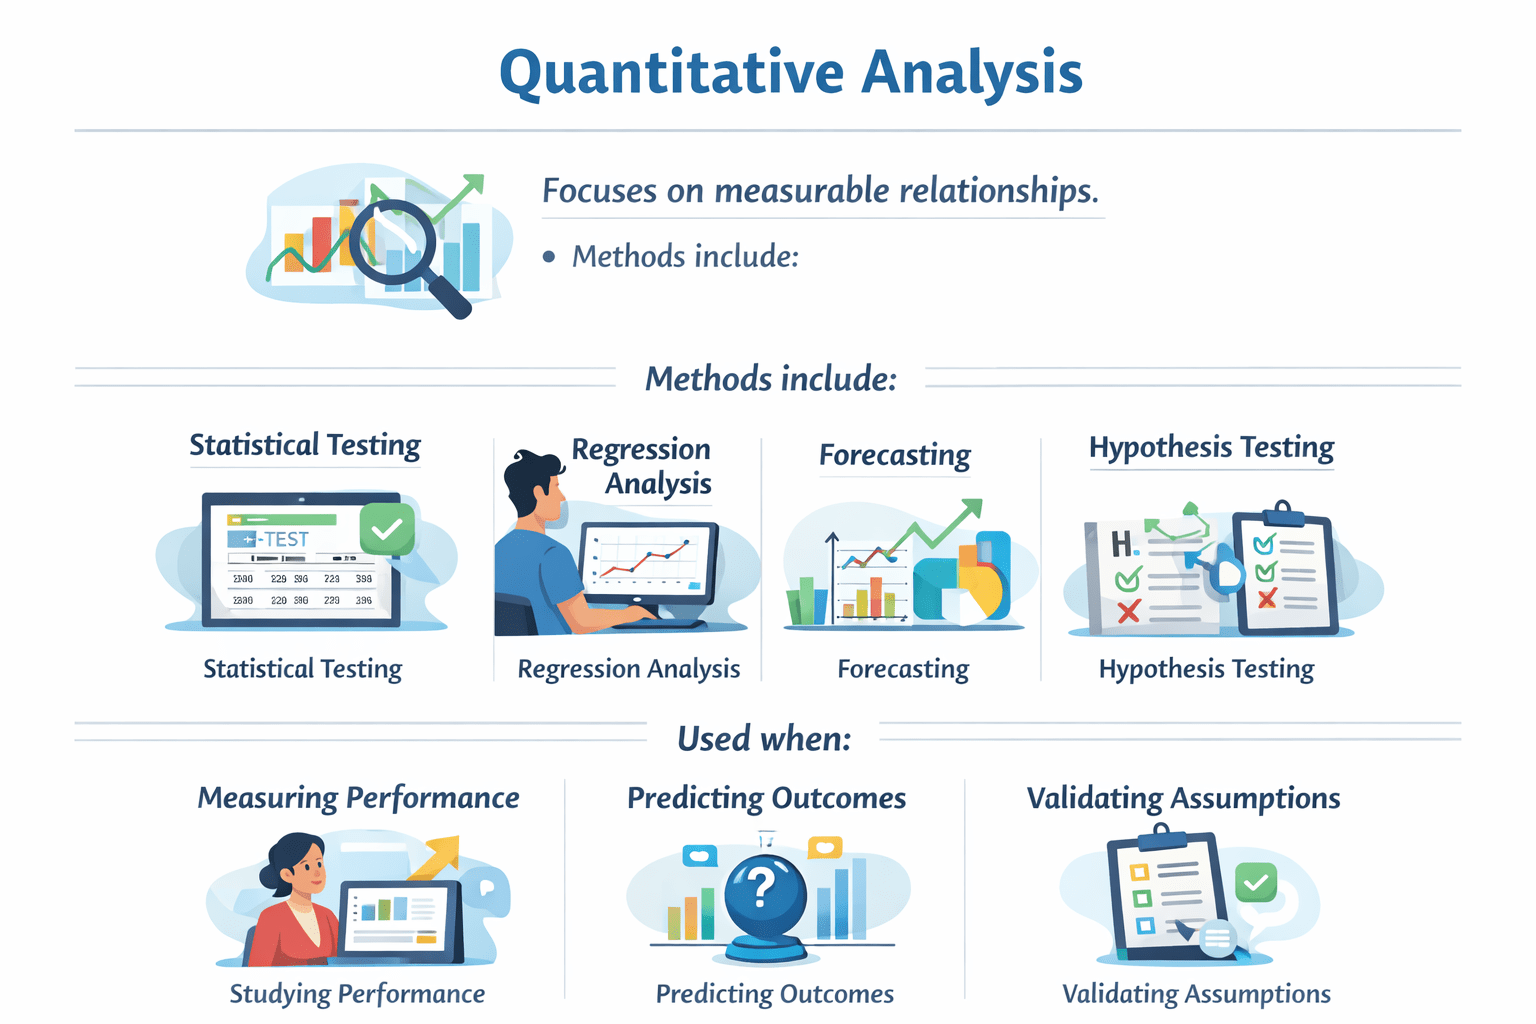
Quantitative Analysis
Forecasting
Regression analysis
Measuring performance
Validating assumptions
Predicting outcomes
Focuses on measurable relationships.
Method Include
Used When
Hypothesis testing
Statistical testing
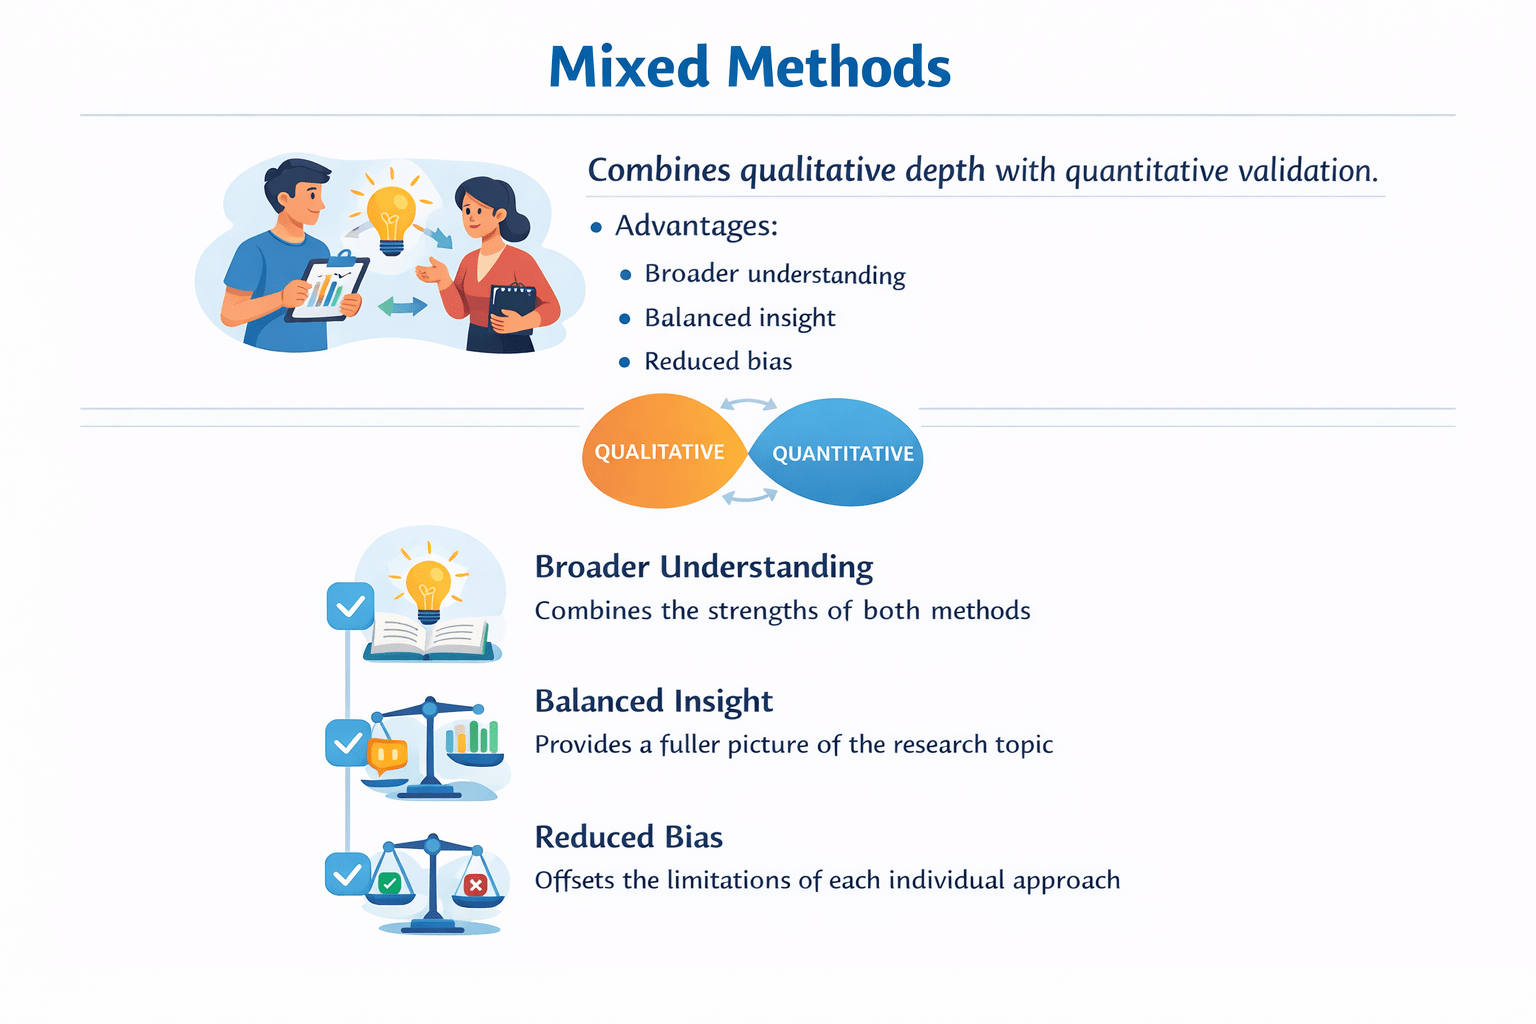
Mixed Methods
Combines qualitative depth with quantitative validation.
Advantages:
Broader understanding
combines the strenght of both methods
Balanced insight
Provides a fuller picture of the research topic
Reduced bias
offsets the limitation of each individual approach
The Data Science Lifecycle
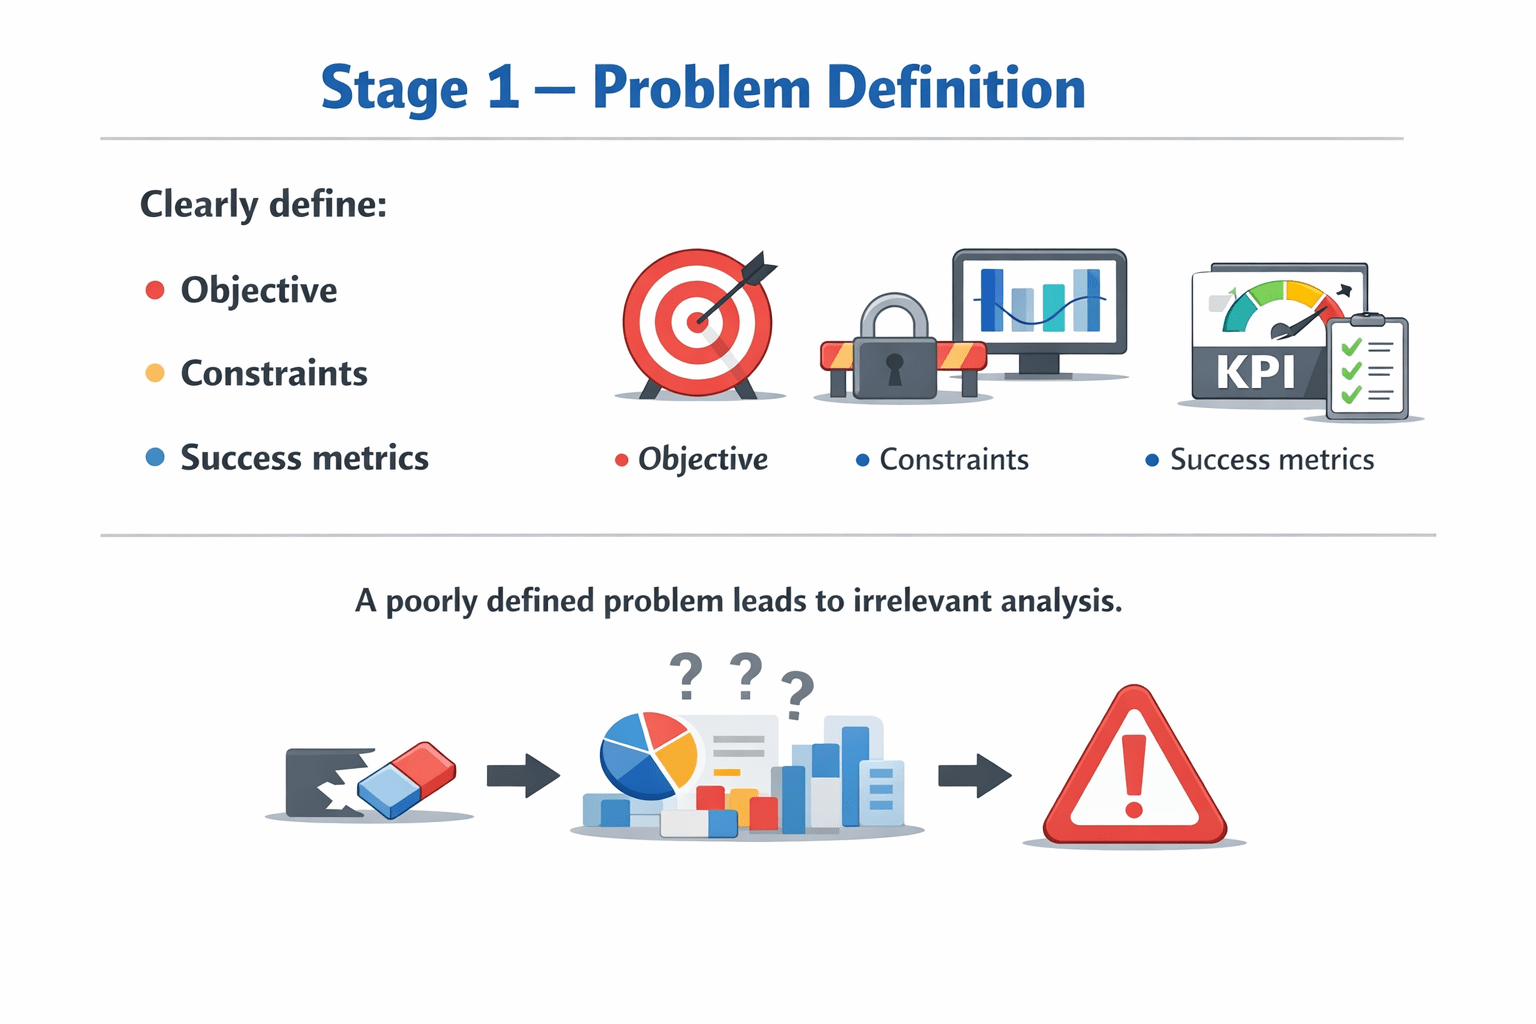
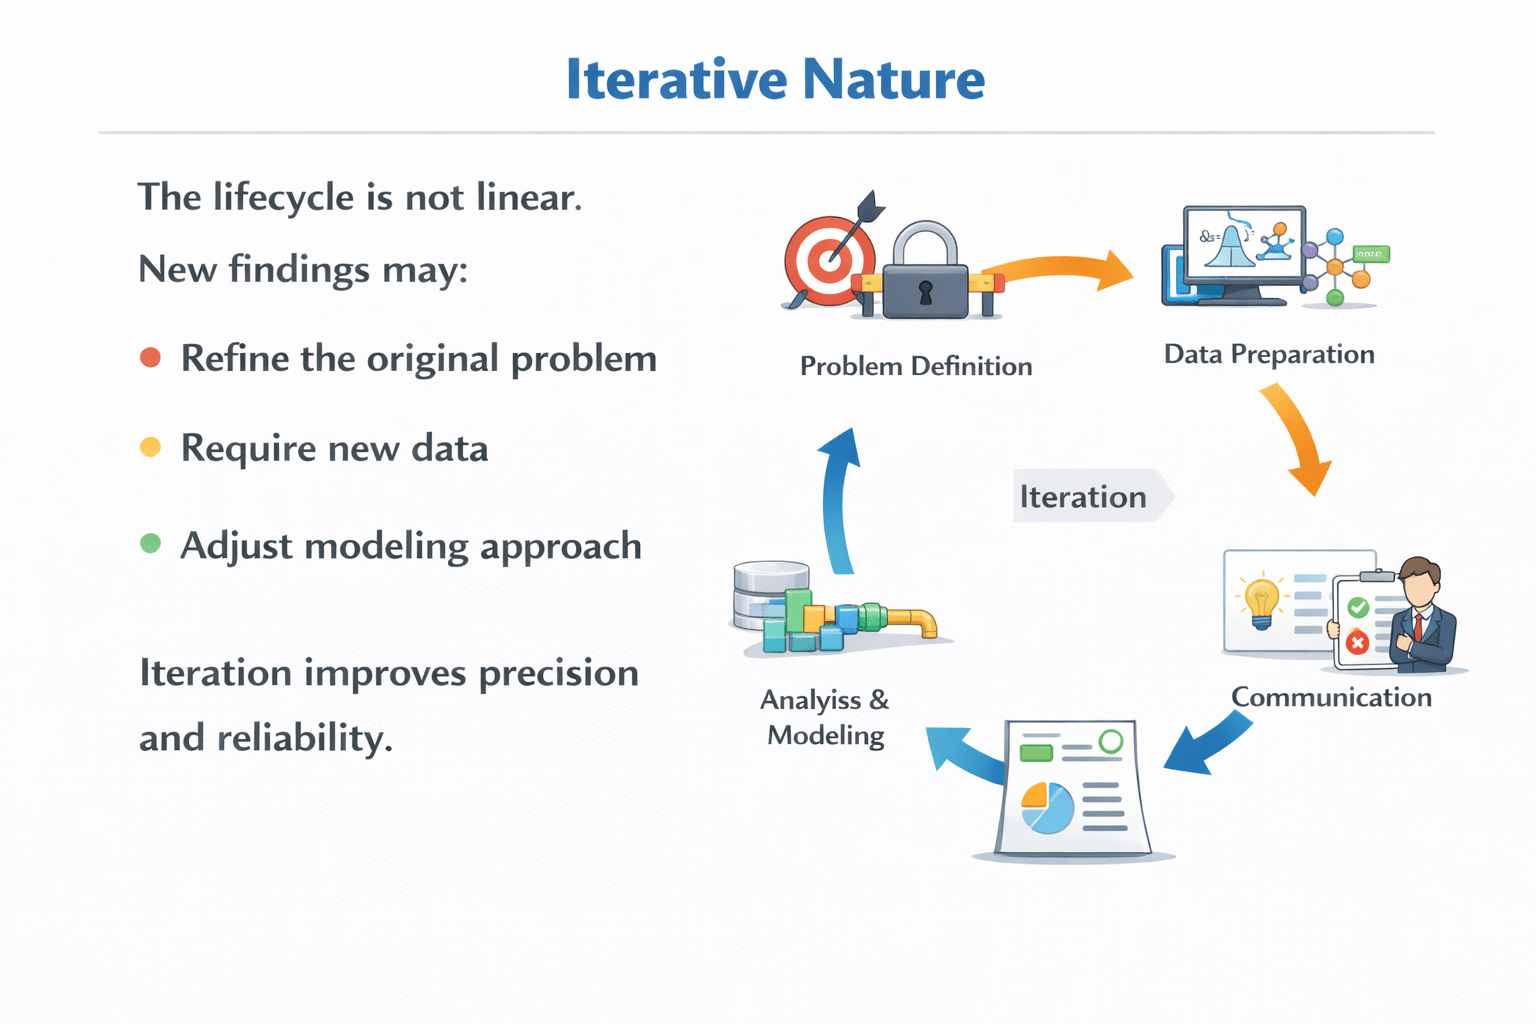
Stage 1 – Problem Definition
A poorly defined problem leads to irrelevant analysis.
Clearly define:
Objective
Constraints
Success metrics
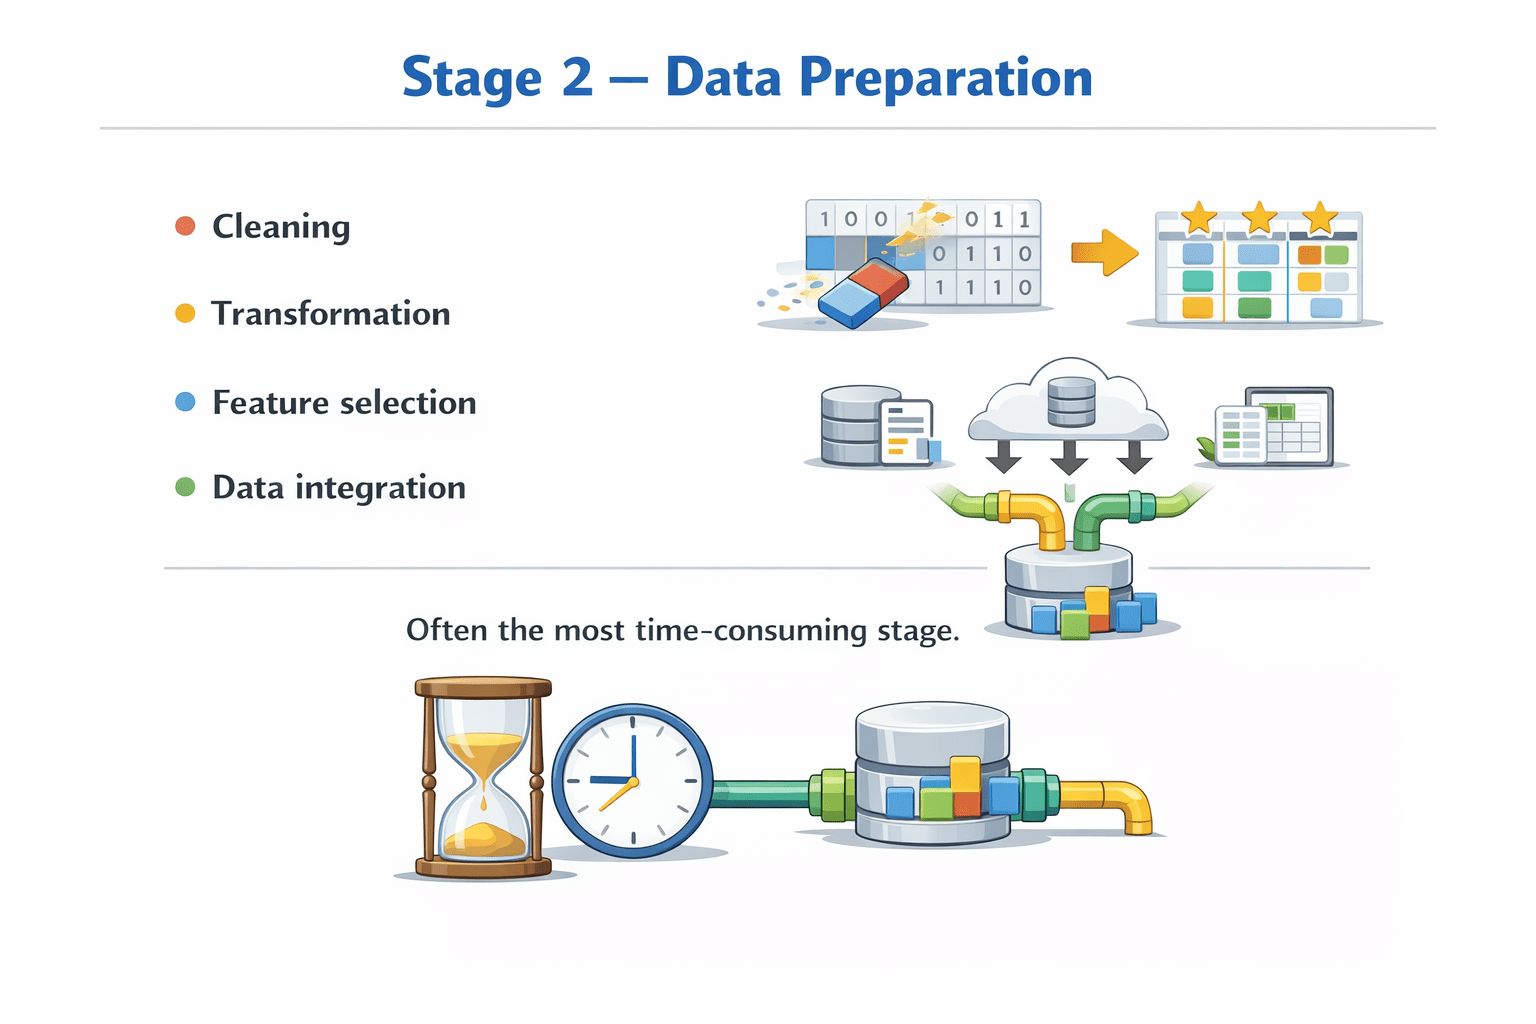
Stage 2 – Data Preparation
Cleaning
Transformation
Feature selection
Data integration
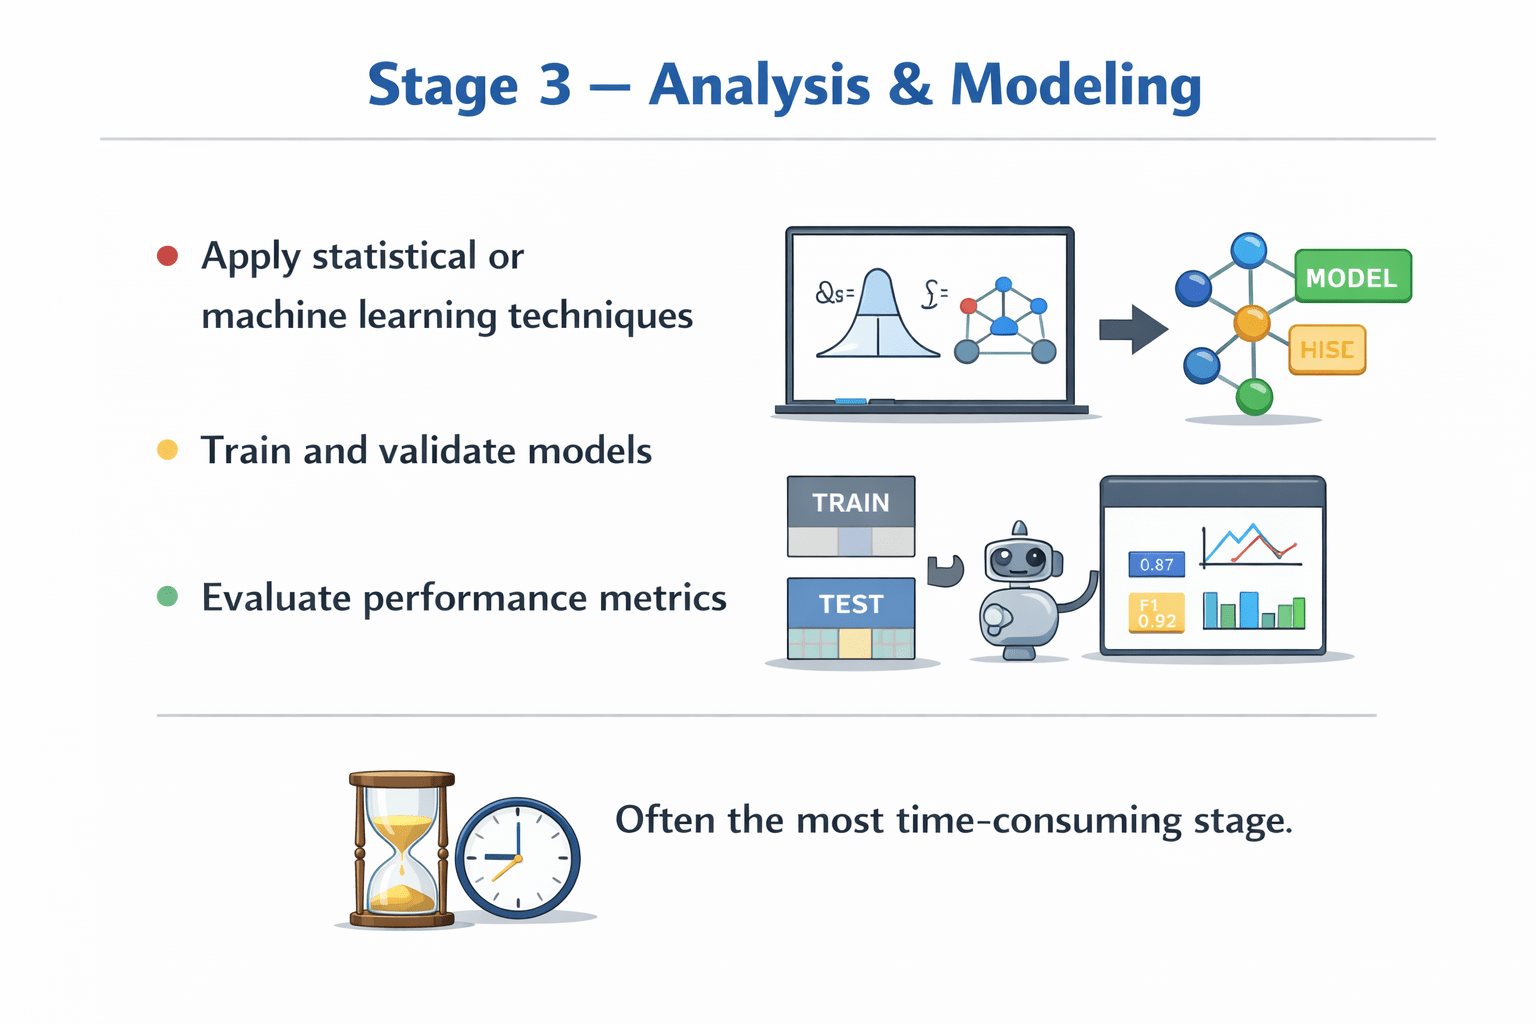
Often the most time-consuming stage.
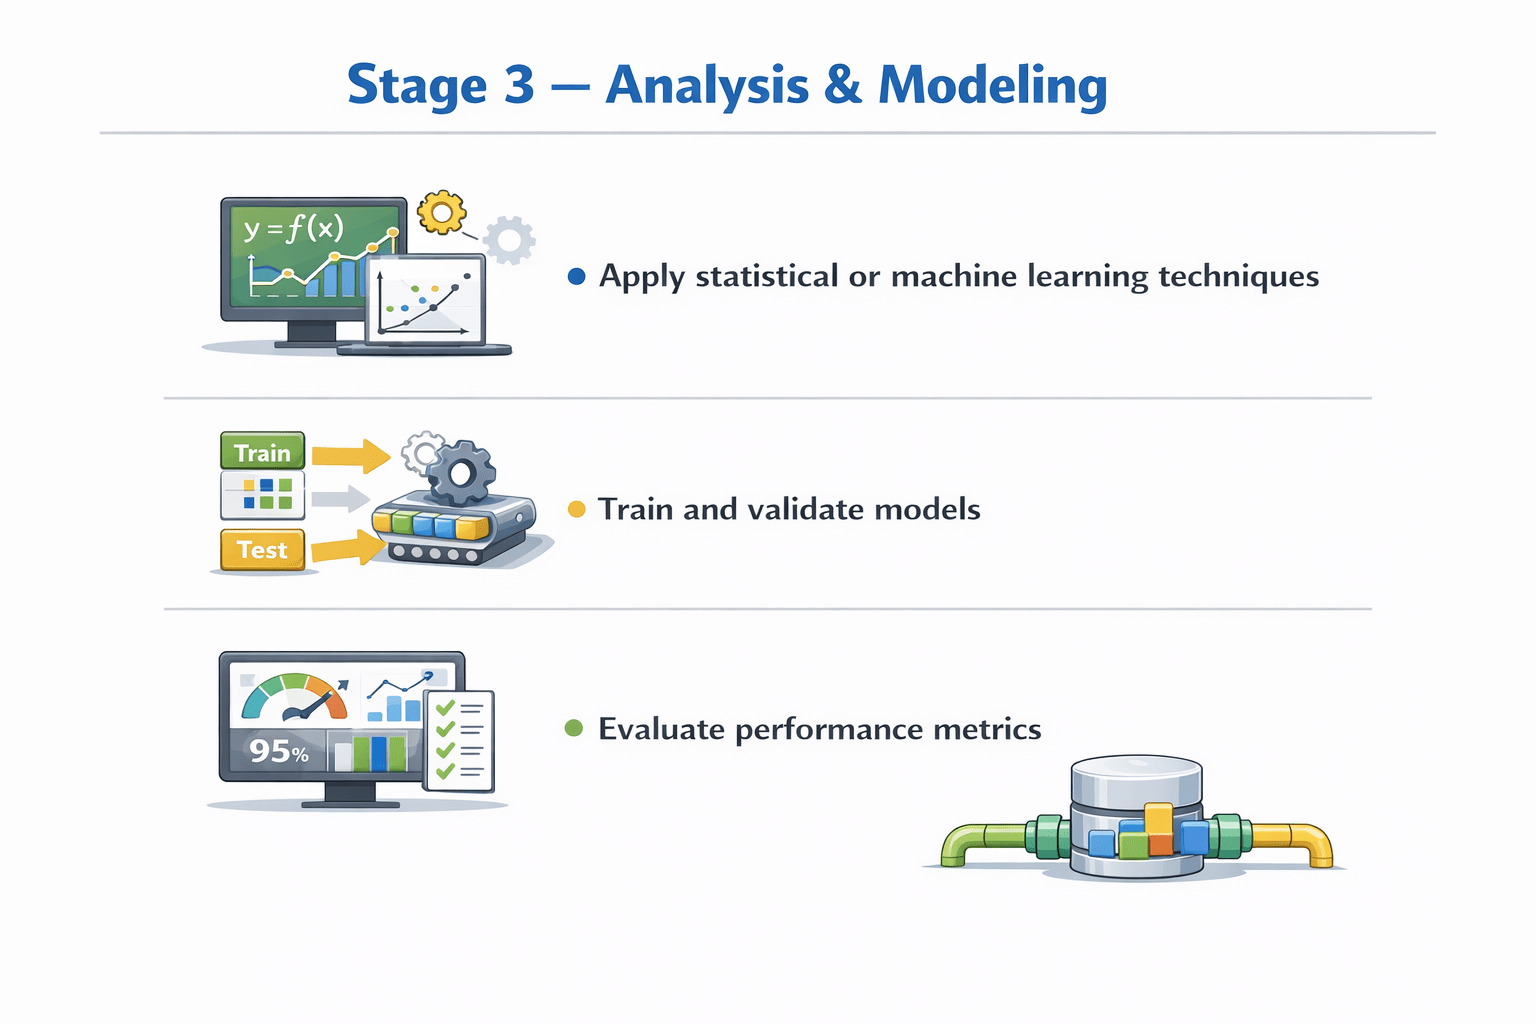
Stage 3 – Analysis & Modeling
Apply statistical or machine learning techniques
Train and validate models
Evaluate performance metrics
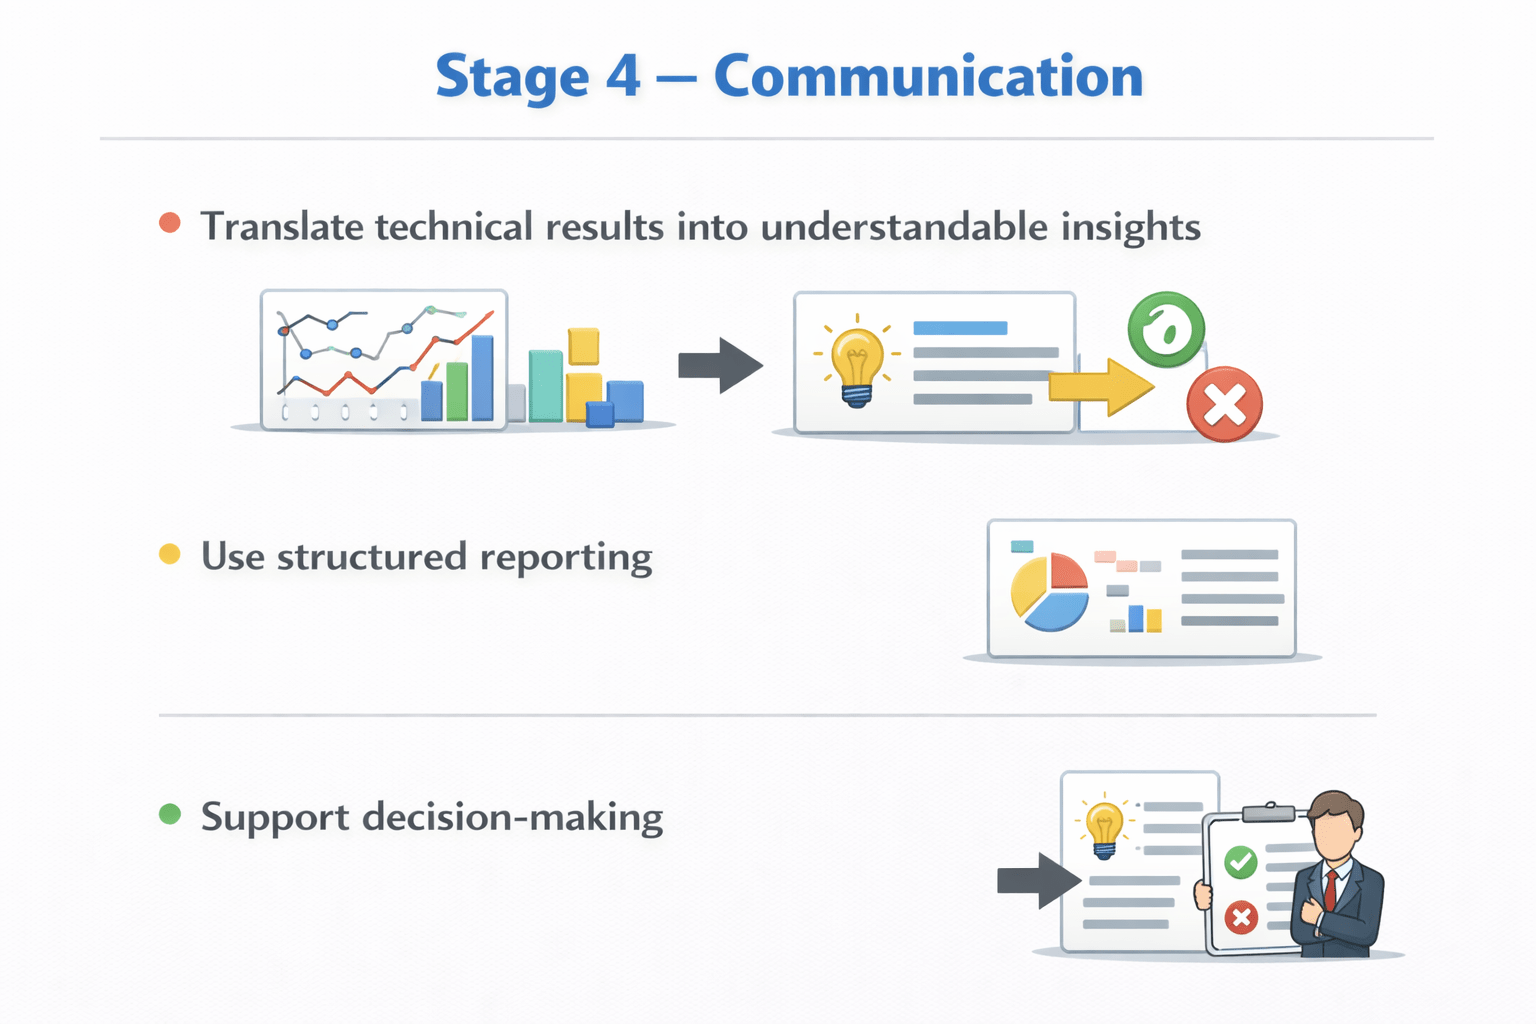
Stage 4 – Communication
Translate technical results into understandable insights
Use structured reporting
Support decision-making
Iterative Nature
New findings may:
Refine the original problem
Require new data
Adjust modeling approach
The lifecycle is not linear.
Iteration improves precision and reliability.
Summary
5
The Data Science Lifecycle is iterative and goal-driven
4
Data structures impact storage and processing
3
Quantitative and qualitative data require different methods
2
Data classification determines valid analysis techniques
1
Data is raw observation; information is contextual meaning
Quiz
Which classification determines whether mathematical ratios are meaningful?
A. Nominal
B. Ordinal
C. Interval
D. Ratio
Which classification determines whether mathematical ratios are meaningful?
A. Nominal
B. Ordinal
C. Interval
D. Ratio
Quiz-Answer
By Content ITV


