


Content ITV PRO
This is Itvedant Content department
Prometheus Overview, Benefits, Use Cases, Setup, Architecture, Server,
Scraping & Storage
Learning Outcome
5
Perform basic setup and understand metric collection
4
Understand Prometheus architecture and components
3
Identify real-world use cases
2
Explain why Prometheus is used in DevOps
1
Define what Prometheus is
Earlier, we learned
Monitoring means continuous observation of system health
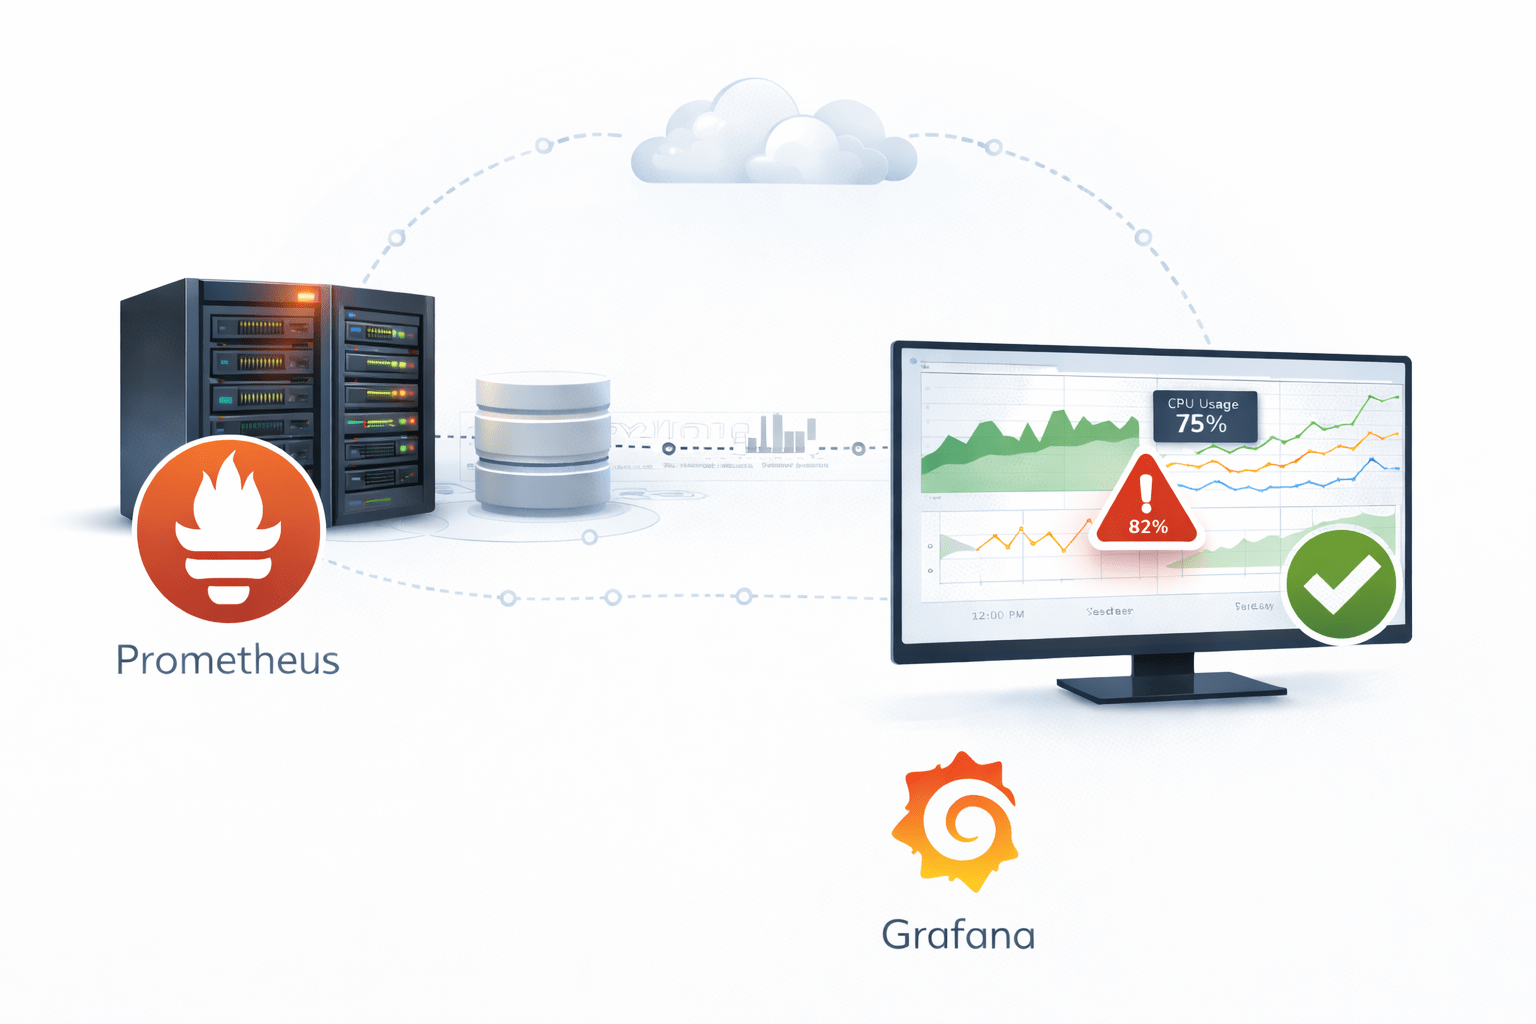
Grafana visualizes data collected by Prometheus
Prometheus collects and stores metrics
Understanding the Concept
that checks machines every few seconds and records readings with time
Imagine a temperature sensor in a factory
Prometheus works similarly
It continuously collects system data and records it with timestamps
What is Prometheus?
Prometheus is an open-source monitoring and alerting tool
designed for
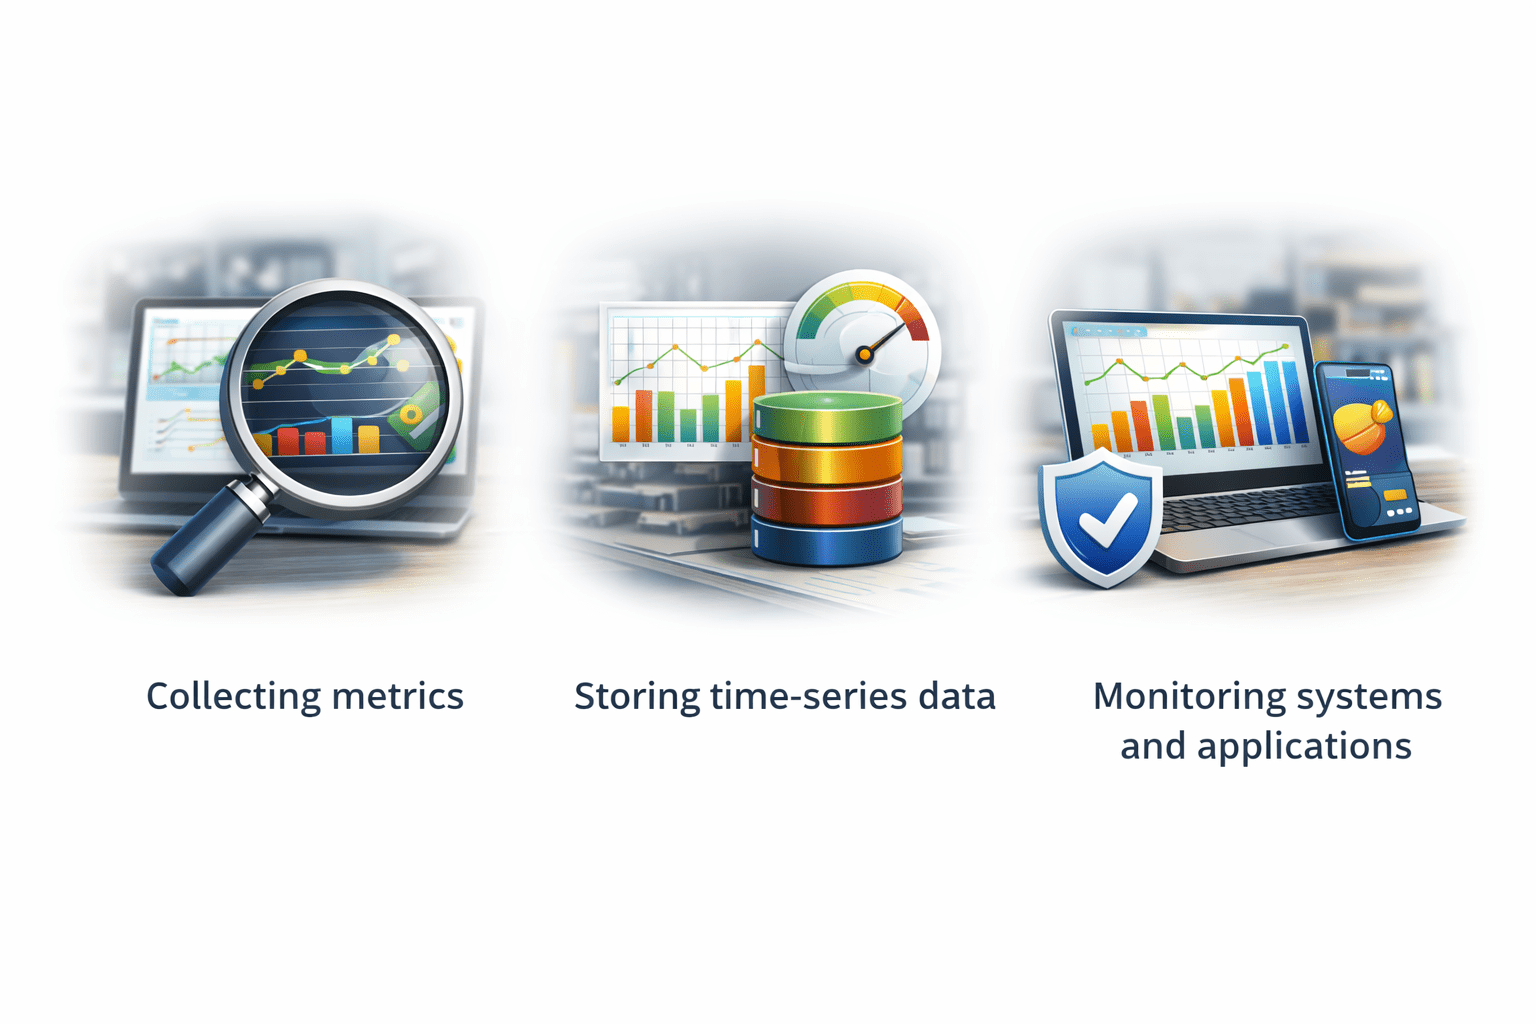
Monitoring systems & applications
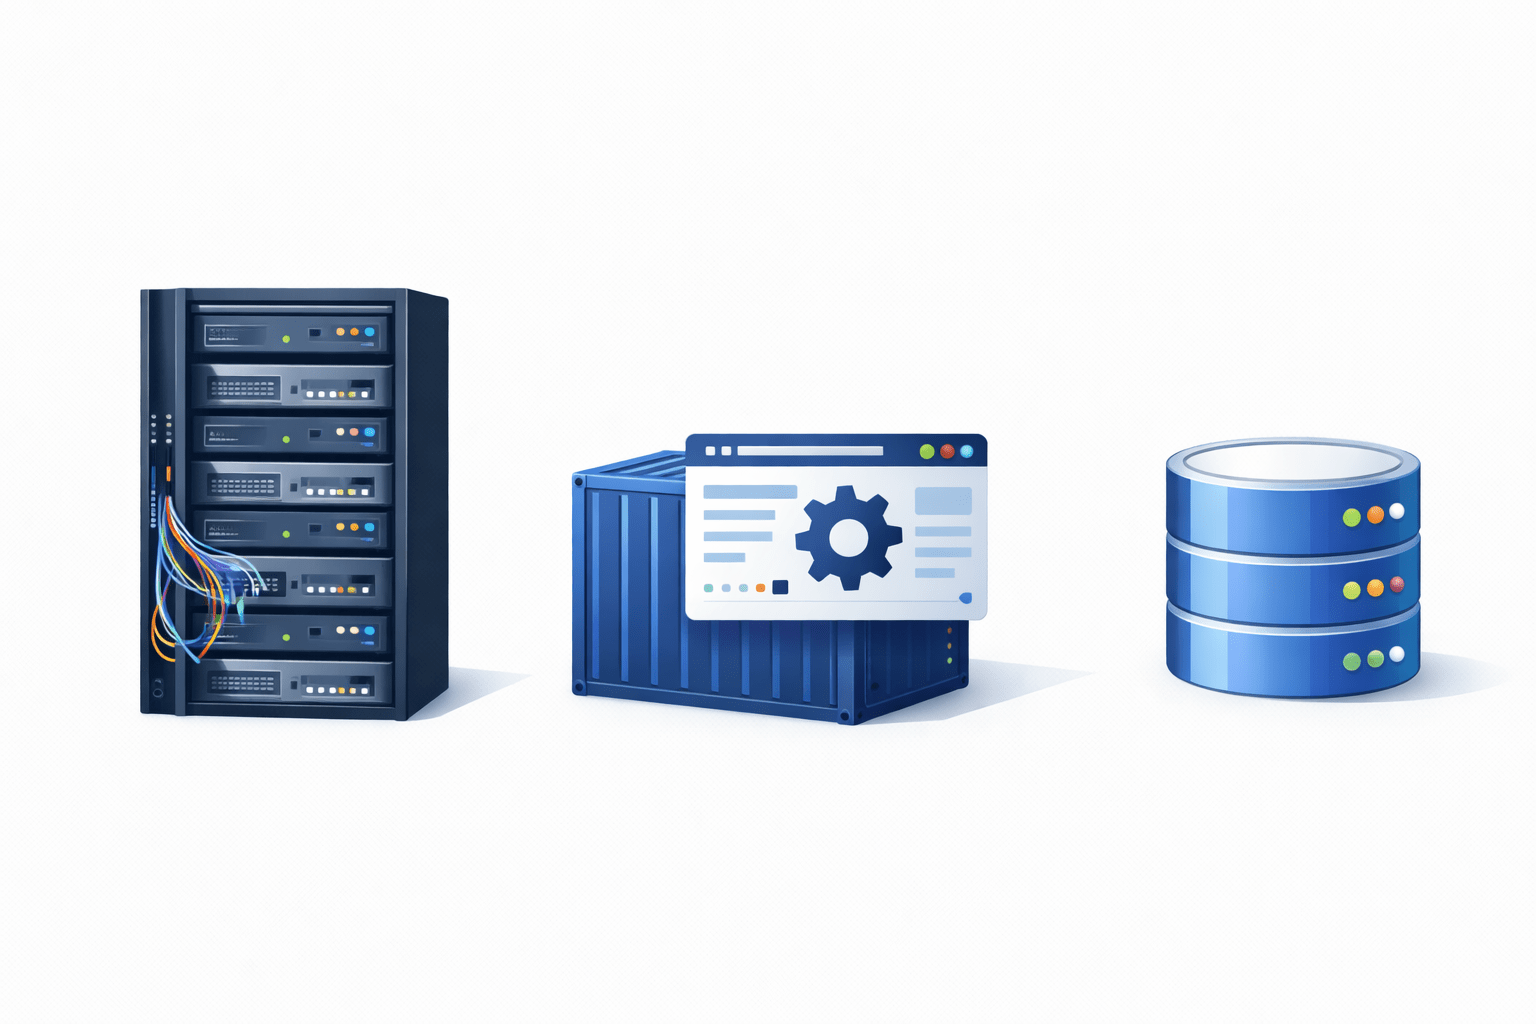
It is widely used in
DevOps pipelines
Cloud environments
Containerized applications
Collecting metrics
Storing time-series data
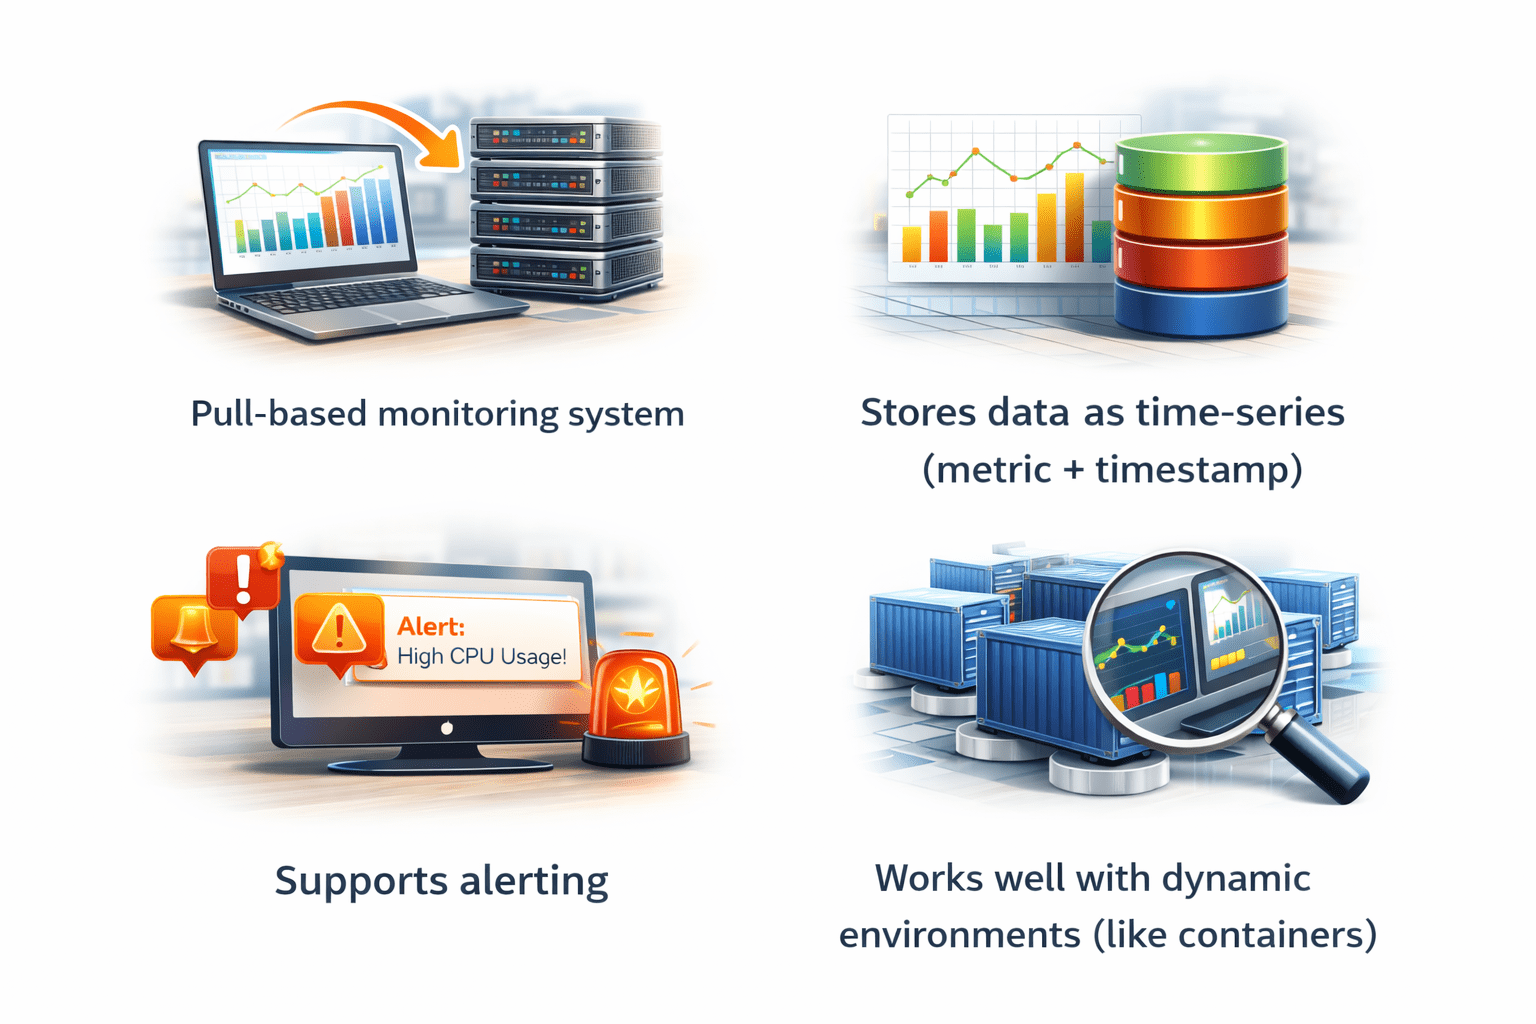
Key Characteristics
Supports alerting
Pull-based monitoring system
Stores data as time-series (metric + timestamp)
Works well with dynamic environments (like containers)
Why Prometheus?
Prometheus is used because
Reliable Alerting
Triggers alerts automatically when thresholds are crossed
Real-Time Monitoring
Collects metrics continuously at regular intervals
Time-Series Storage
Stores metrics with timestamps to analyze trends over time
Powerful Querying (PromQL)
Allows flexible querying and analysis of metrics
Use Cases of Prometheus
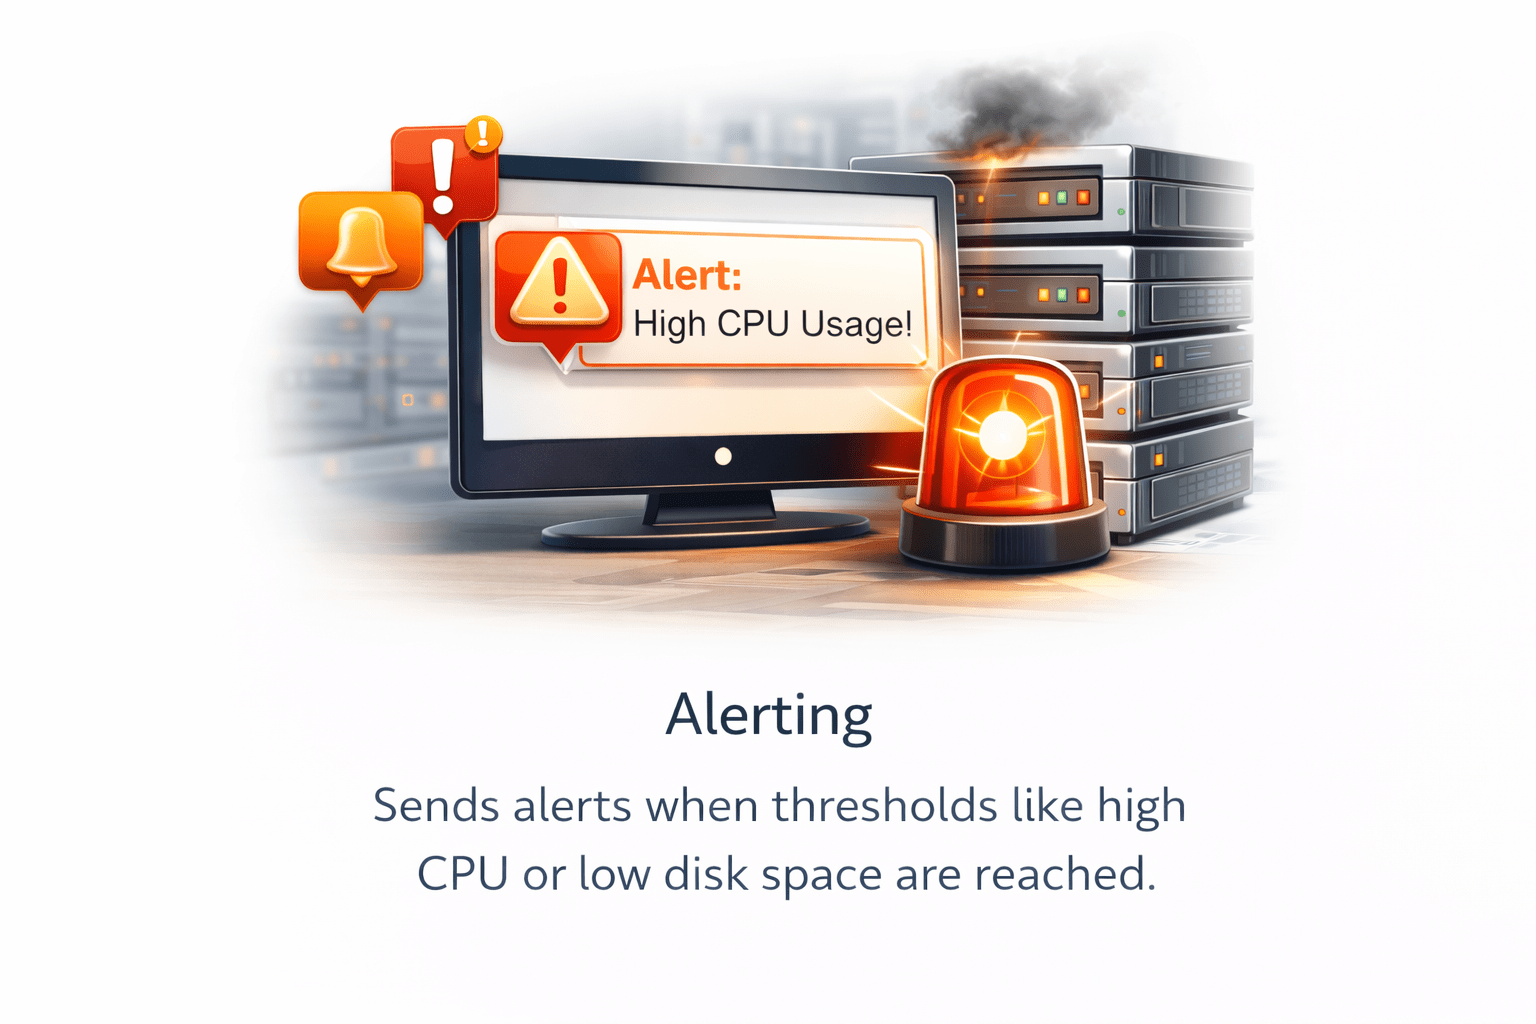
Alerting
Sends alerts when thresholds like high CPU or low disk space are reached
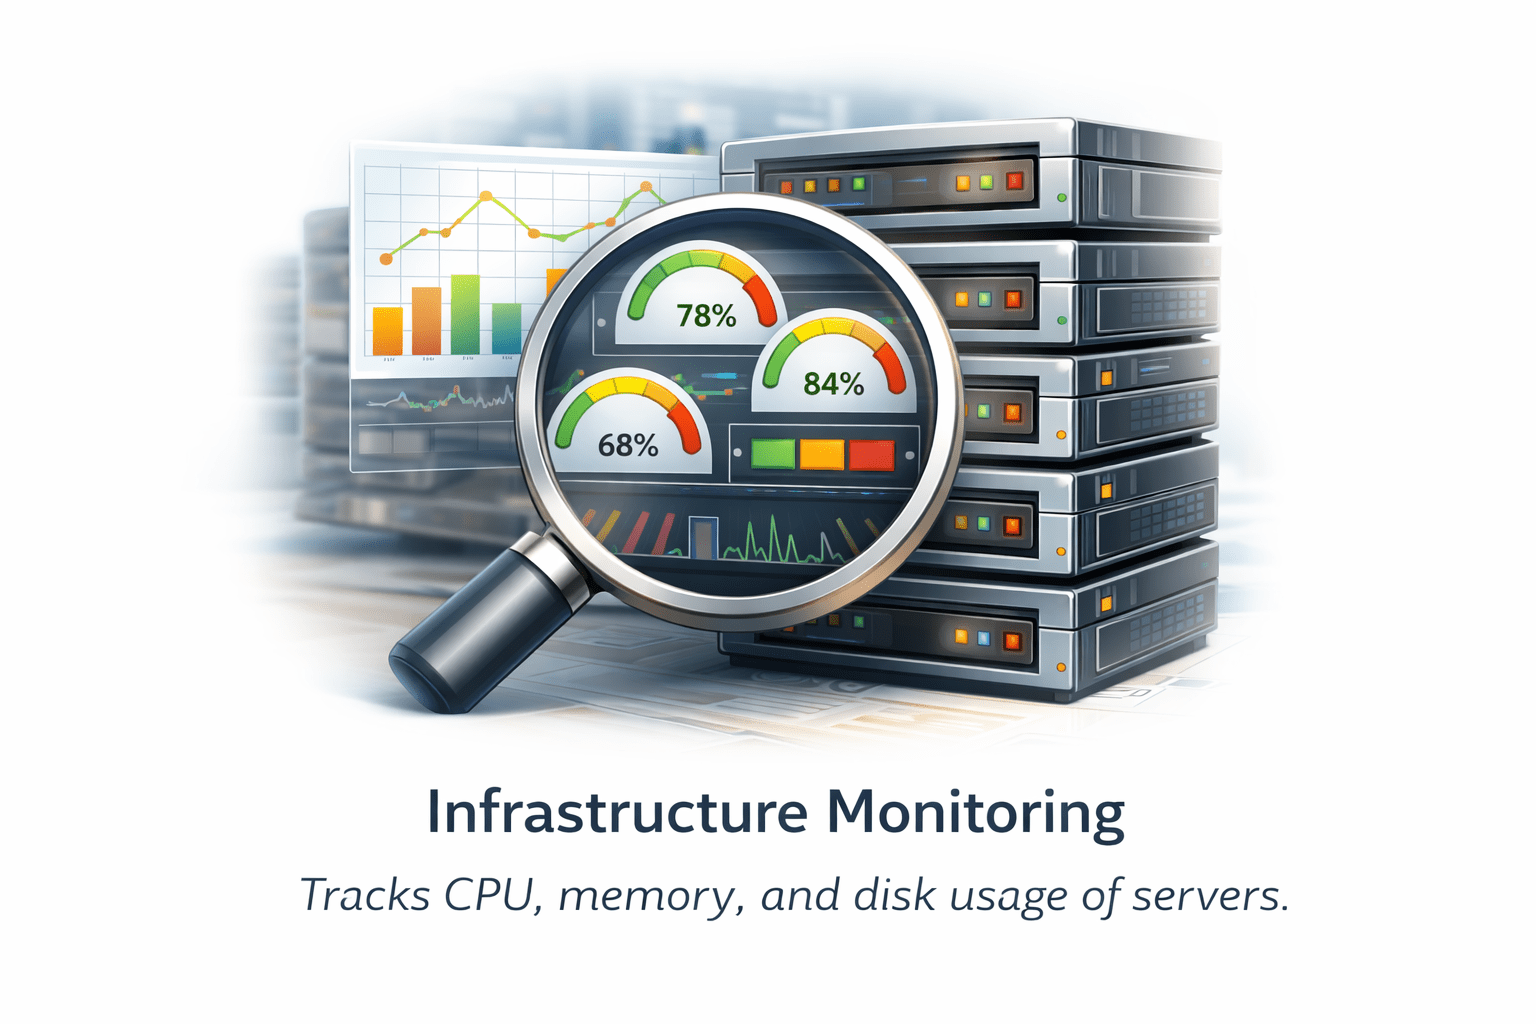
Infrastructure Monitoring
Tracks CPU, memory, and disk usage of servers
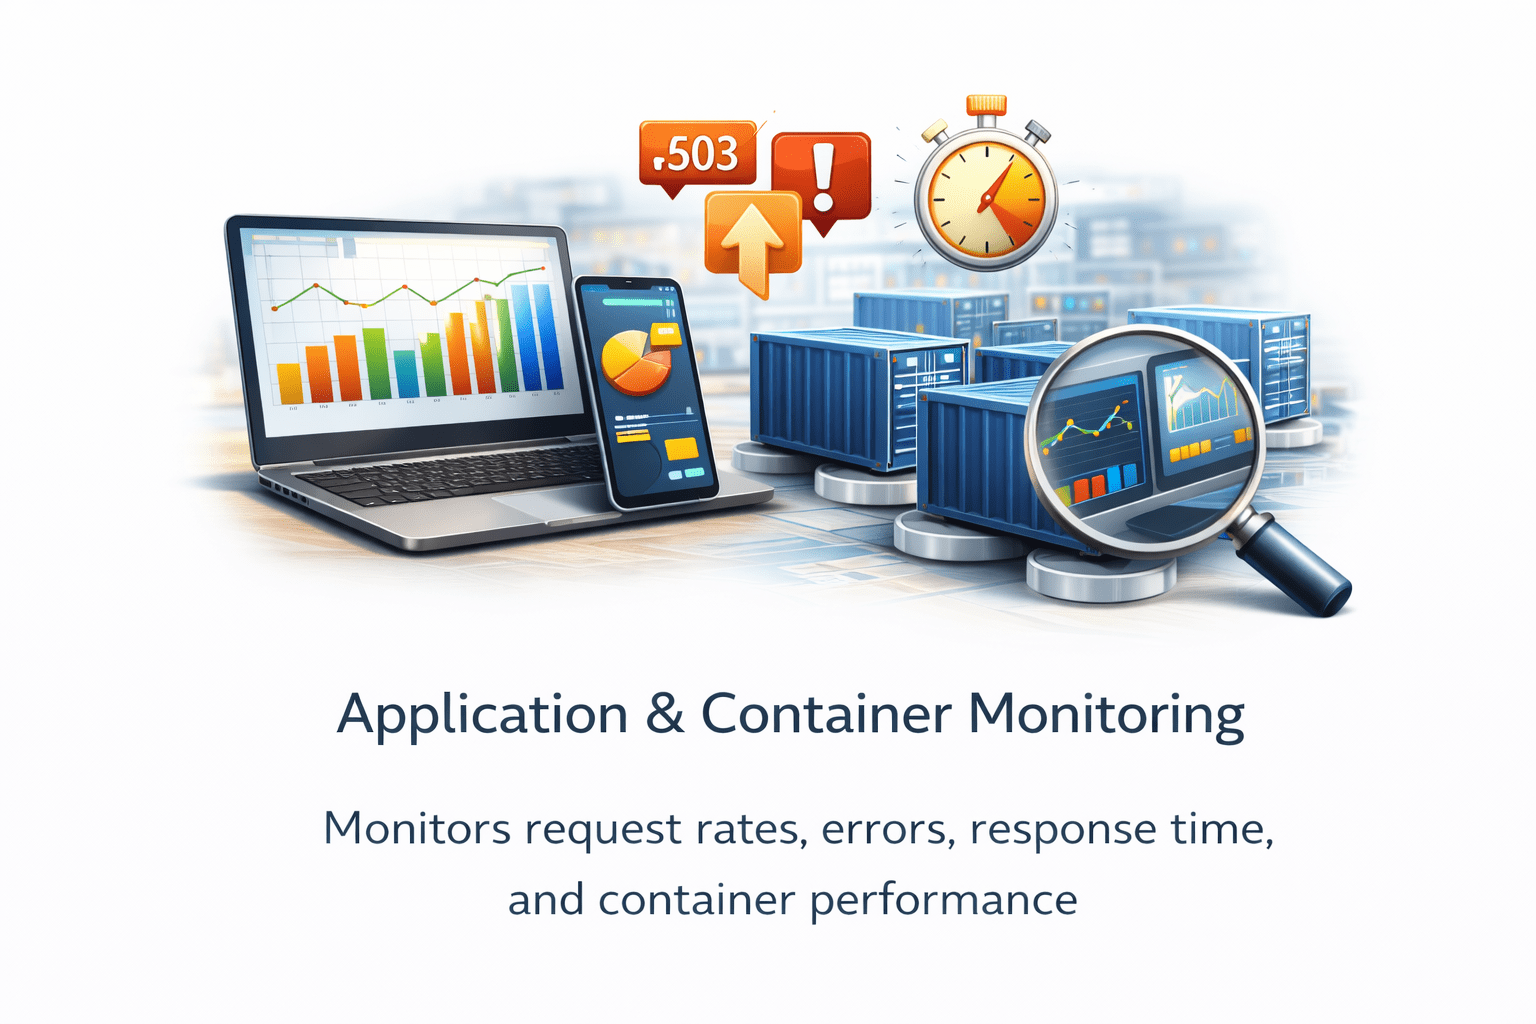
Application & Container Monitoring
Monitors request rates, errors, response time, and container performance
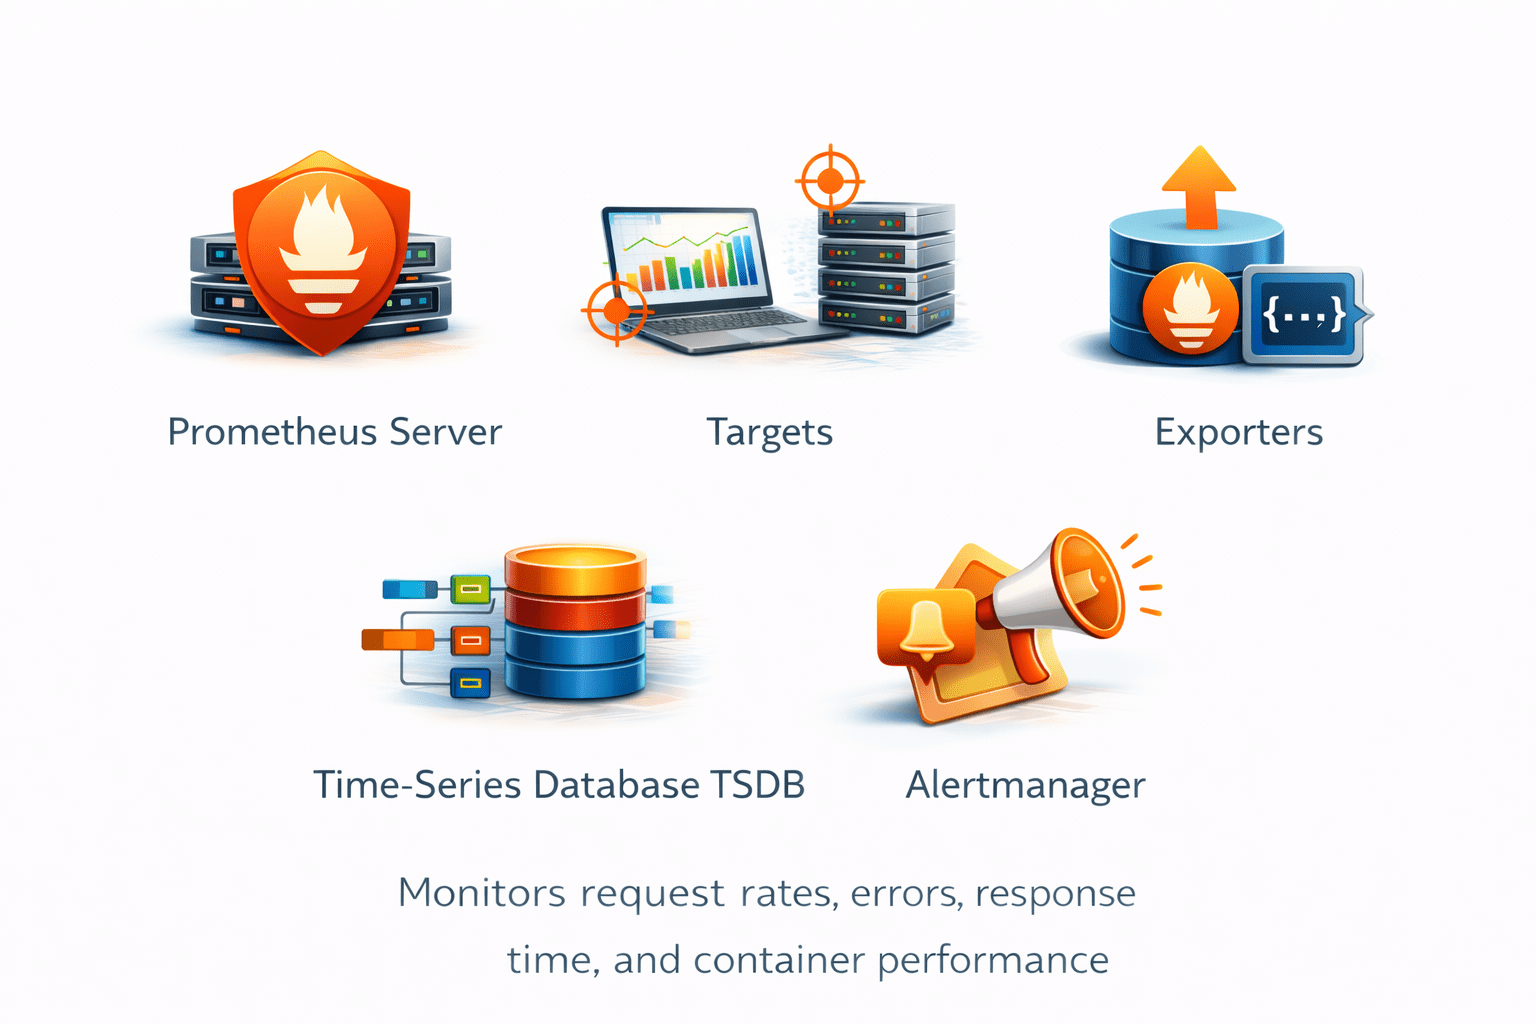
Architecture of Prometheus
Prometheus architecture is simple but powerful
Main Components
Alertmanager
Manages and sends alert notifications
Prometheus Server
Scrapes, stores, and queries metrics
Targets
Systems or applications being monitored
Exporters
Expose metrics in Prometheus format
Time-Series Database TSDB
Stores metrics with labels and timestamps
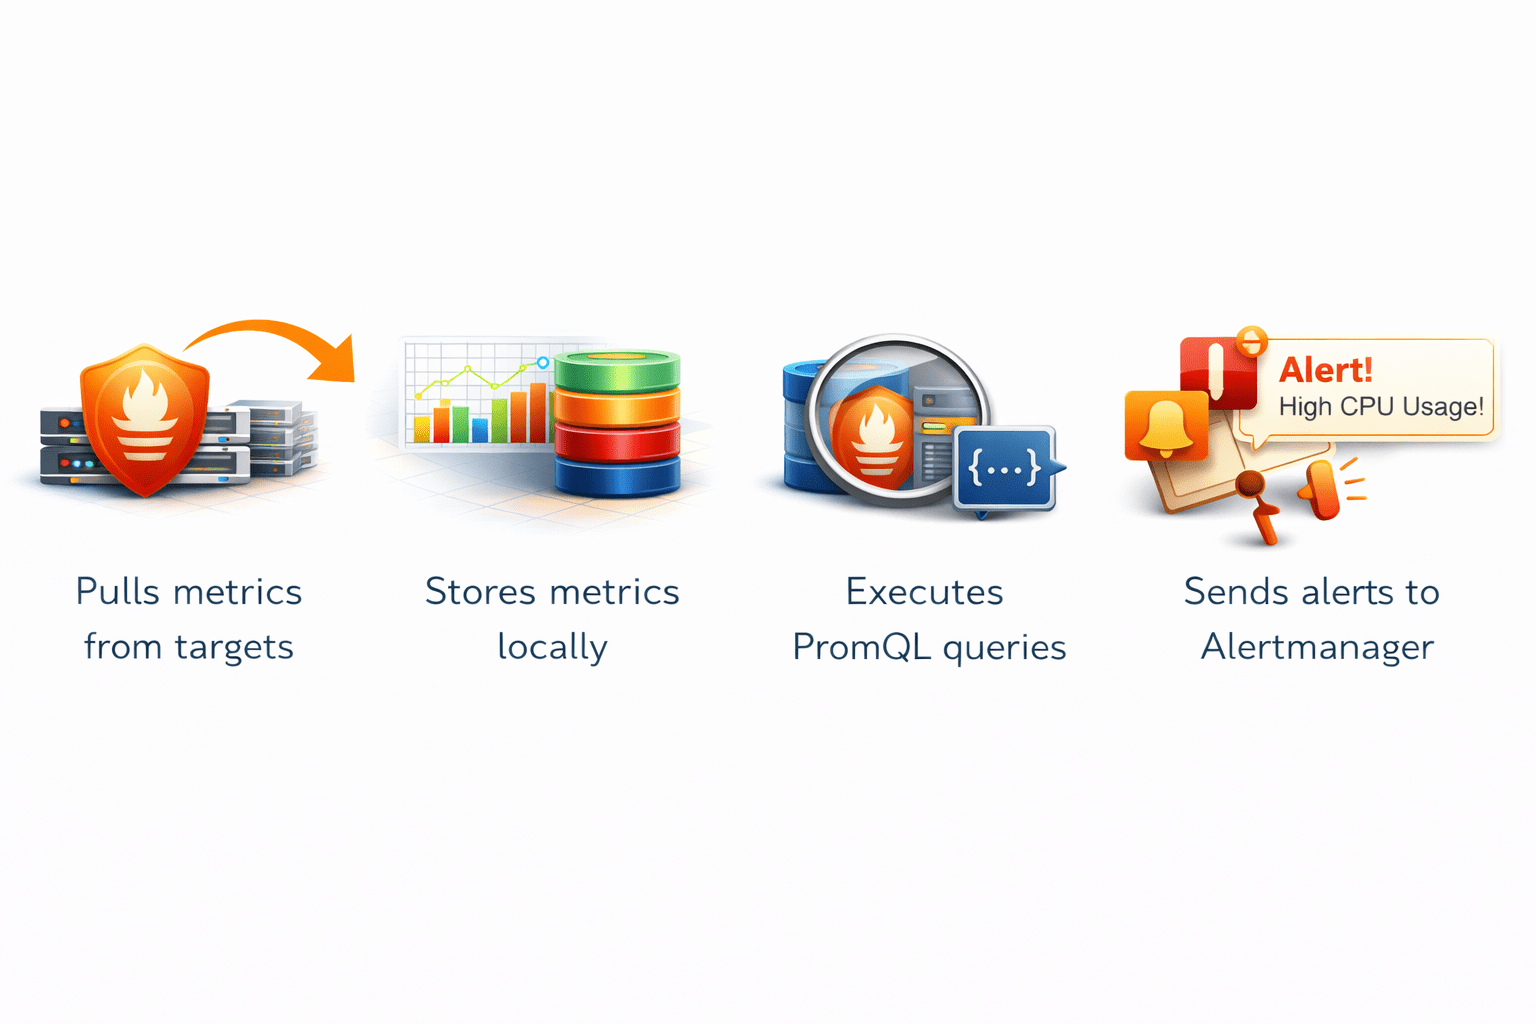
Prometheus Server
Sends alerts to Alertmanager
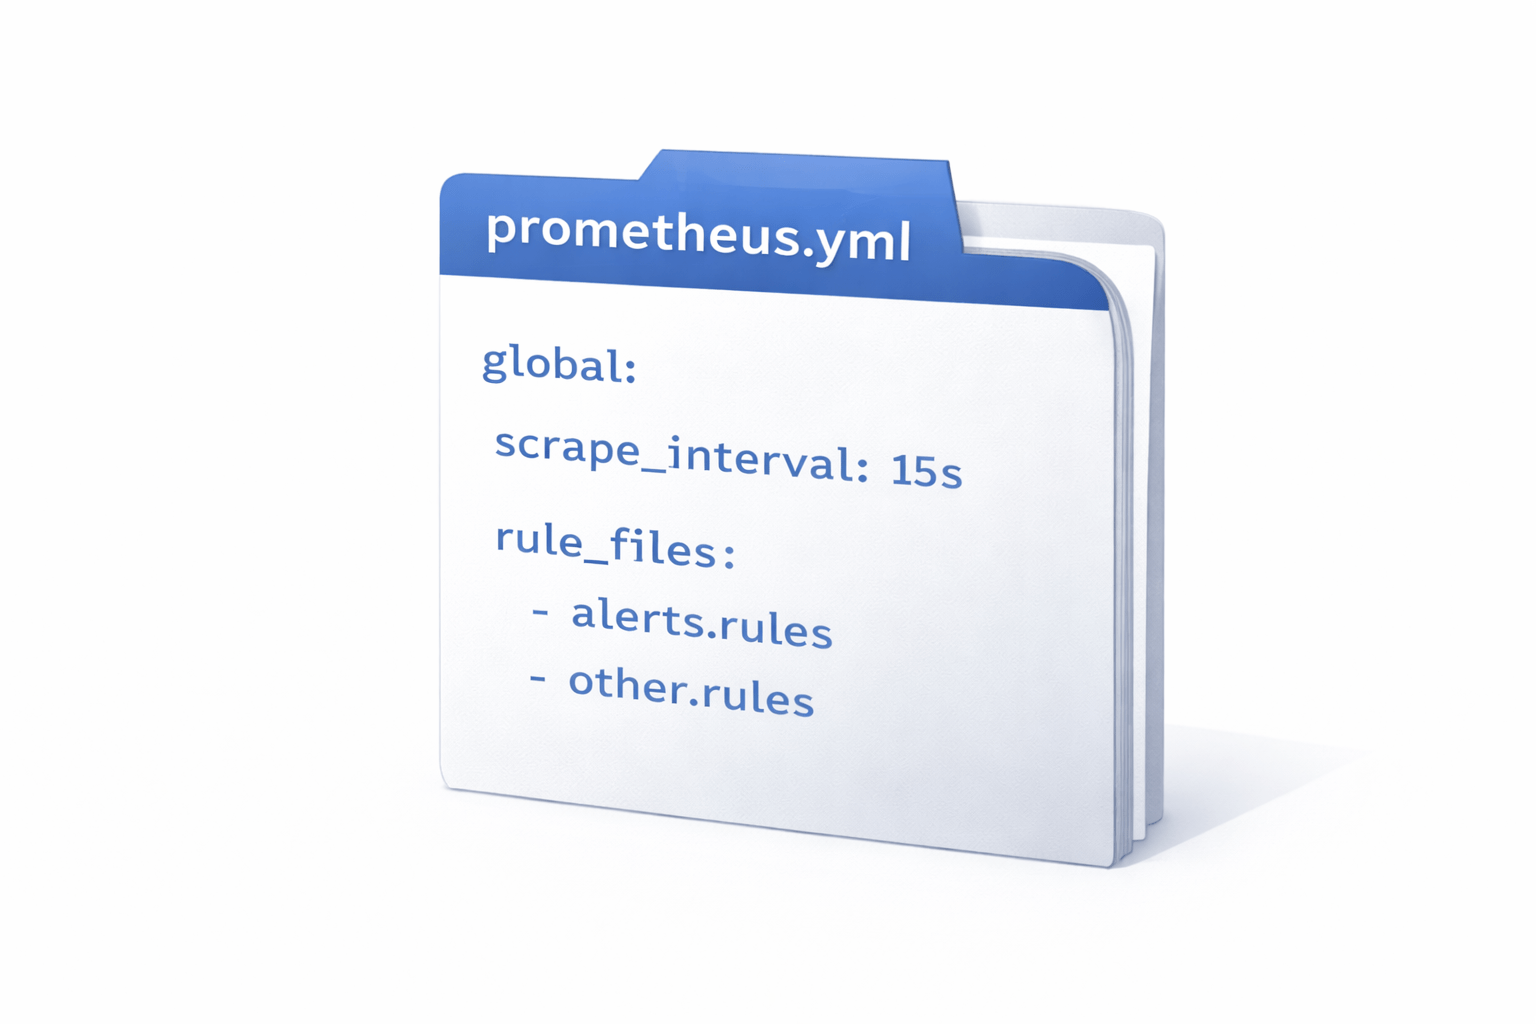
It reads configuration from
prometheus.yml
Alert rules
Pulls metrics from targets
Stores metrics locally
Executes PromQL queries
This file defines
Targets
Scrape interval
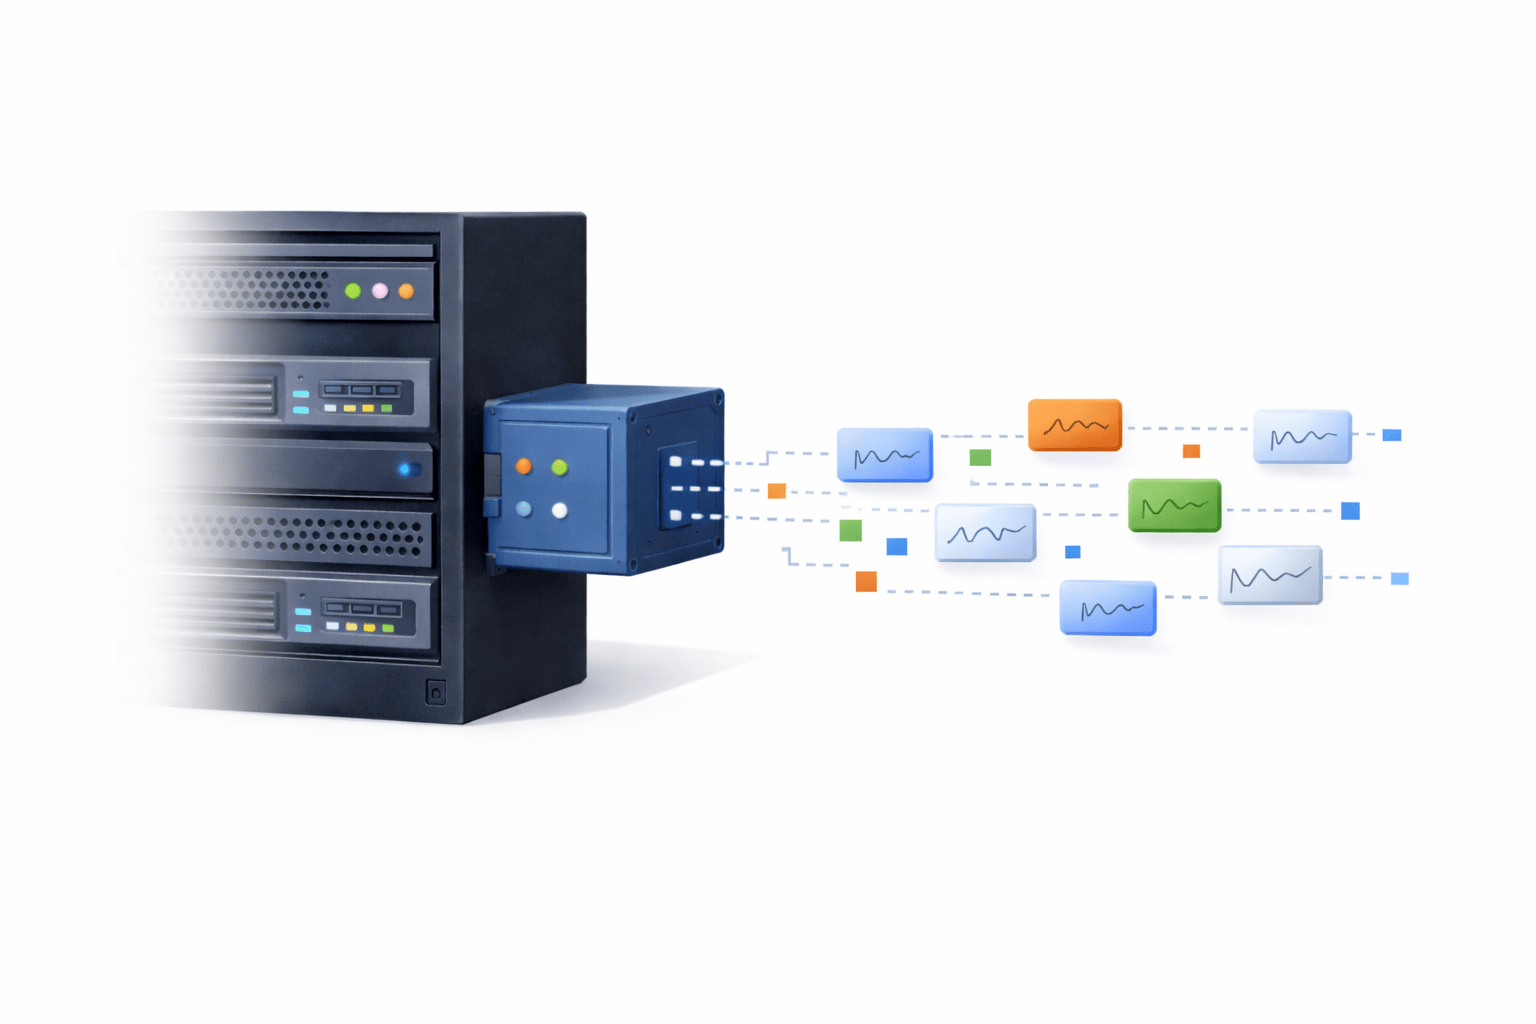
Scraping Metrics
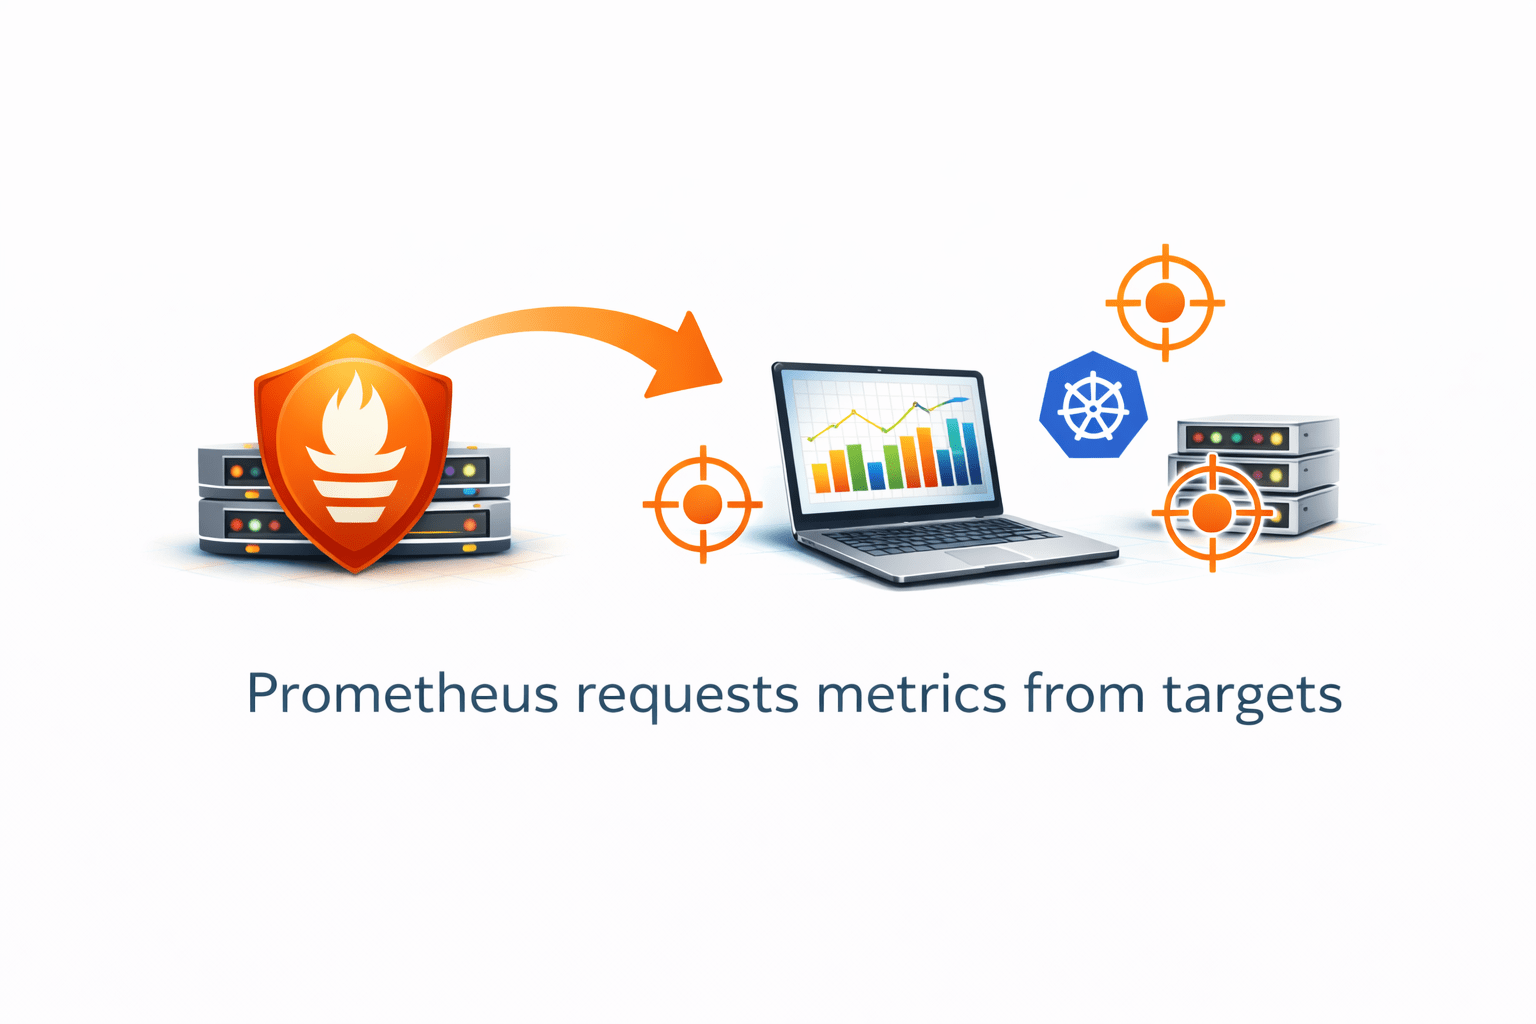
Prometheus follows a pull model
This means
Prometheus requests metrics from targets
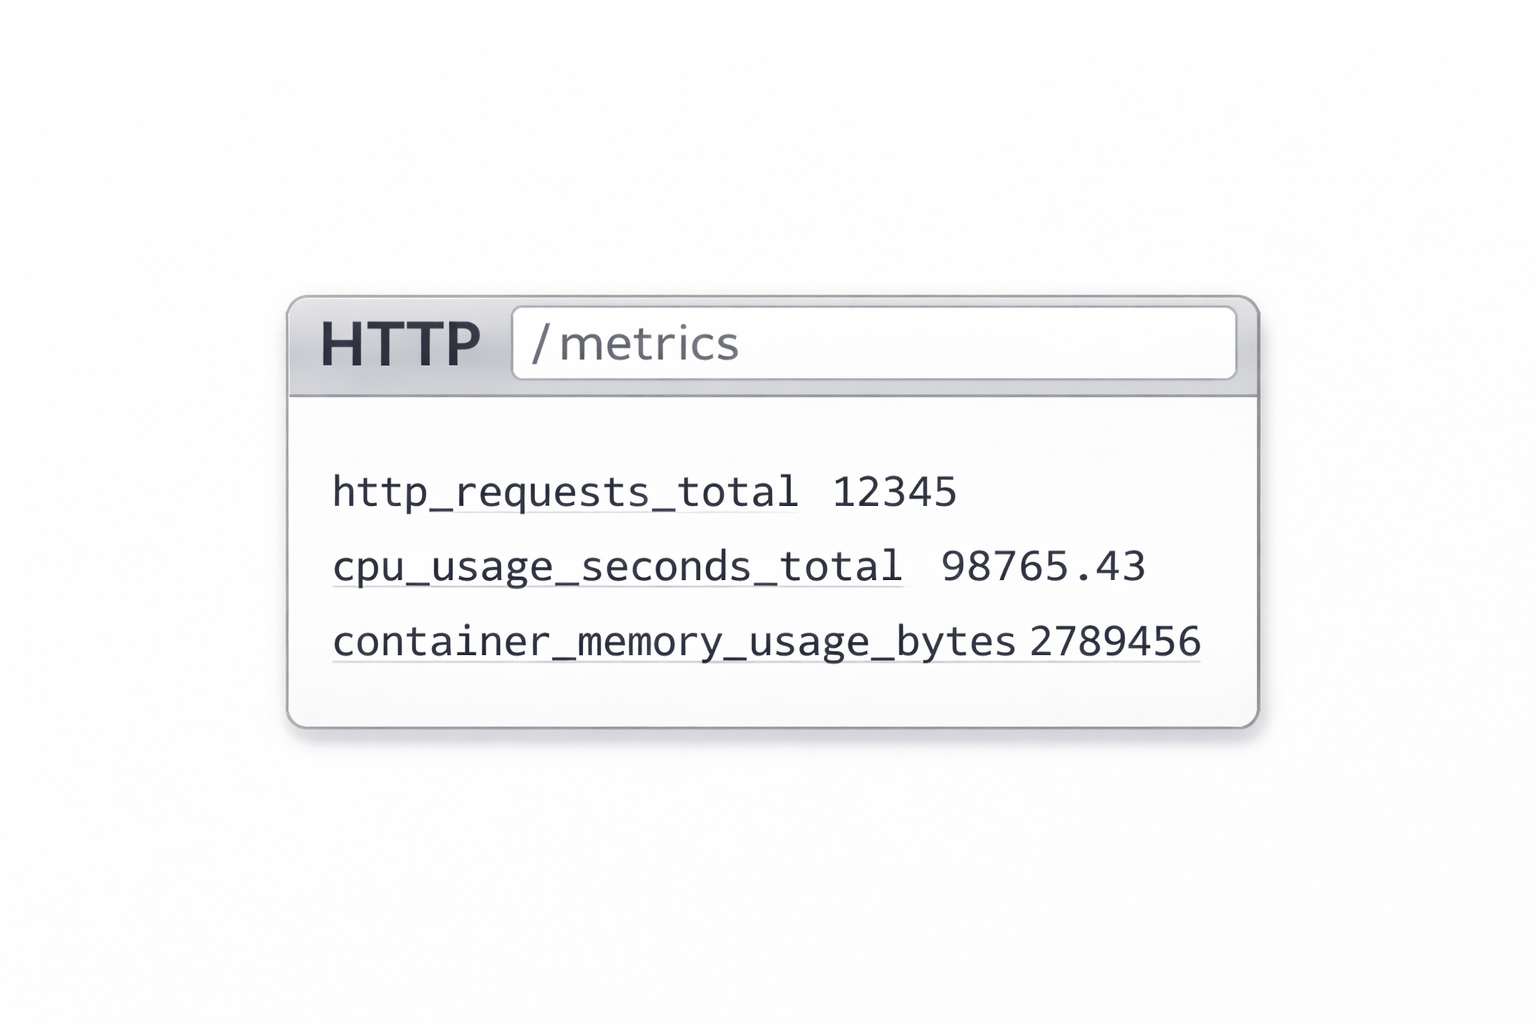
Targets expose metrics on HTTP endpoint (usually /metrics)
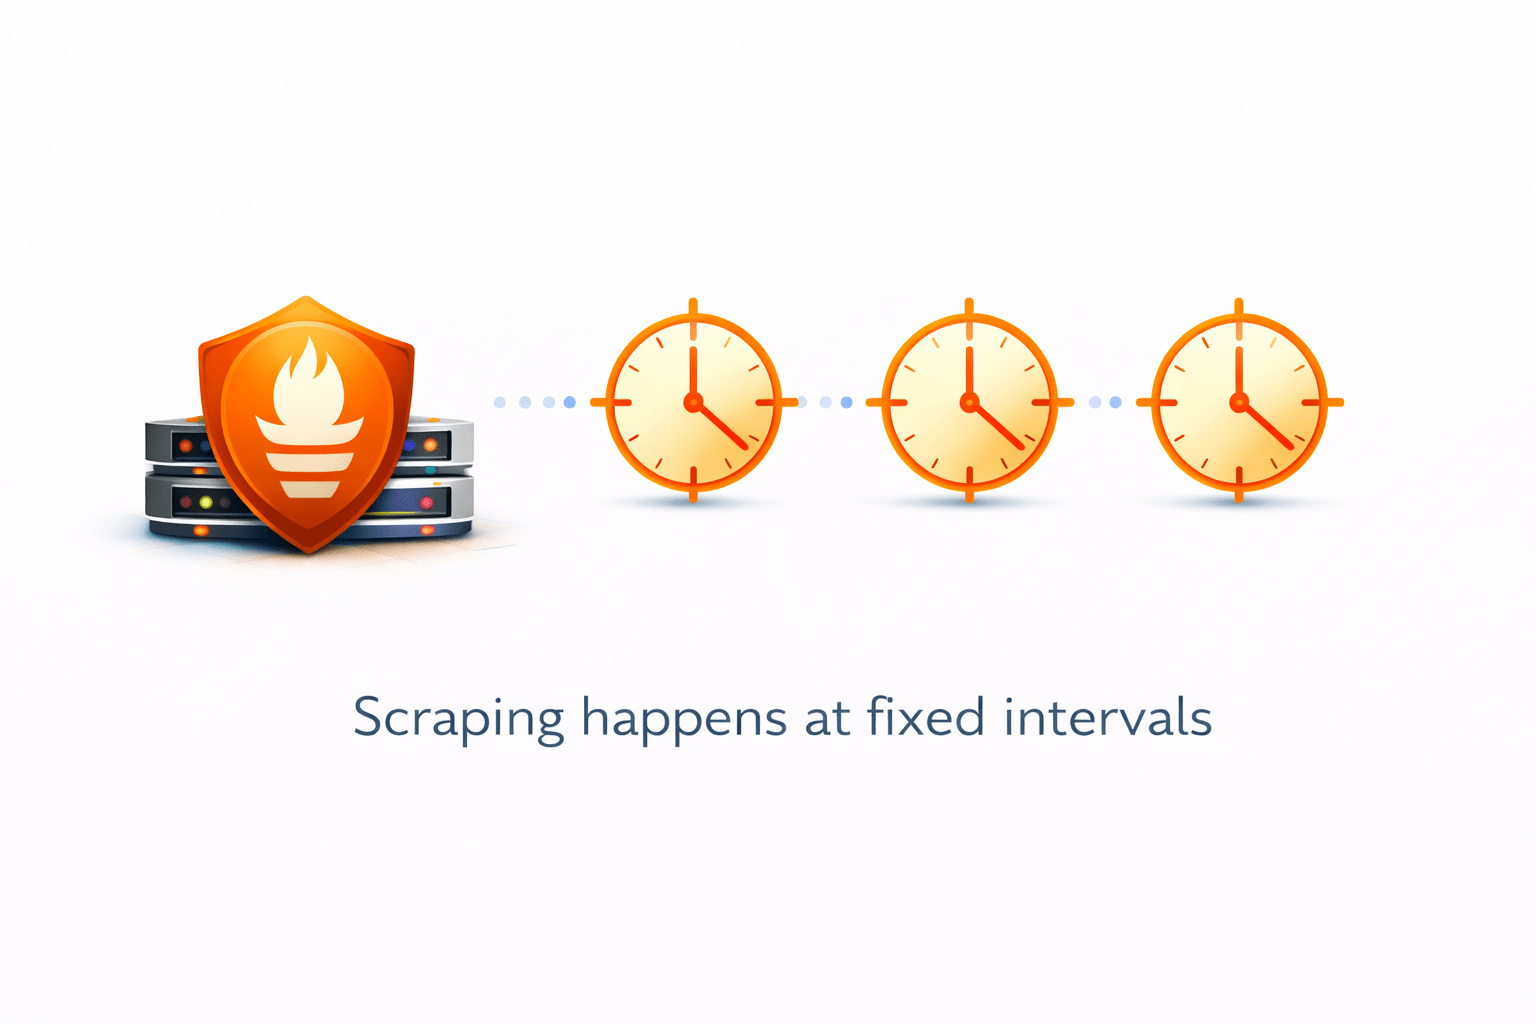
Scraping happens at fixed intervals
Why Pull Model?
More reliable
Better control
Easier service discovery
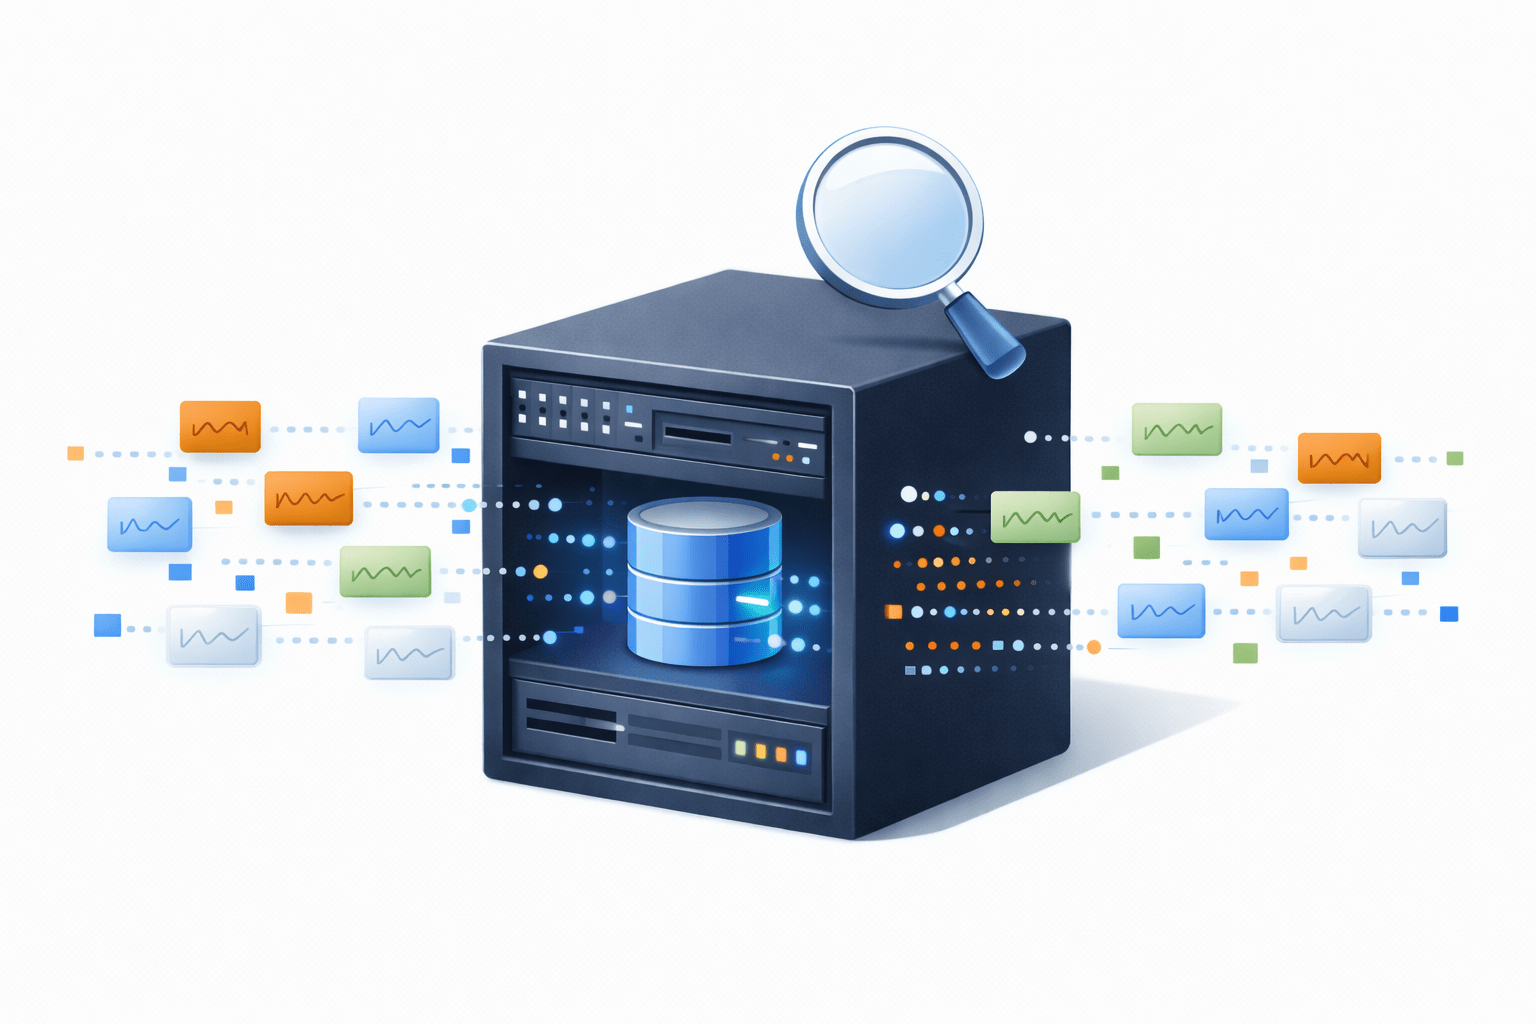
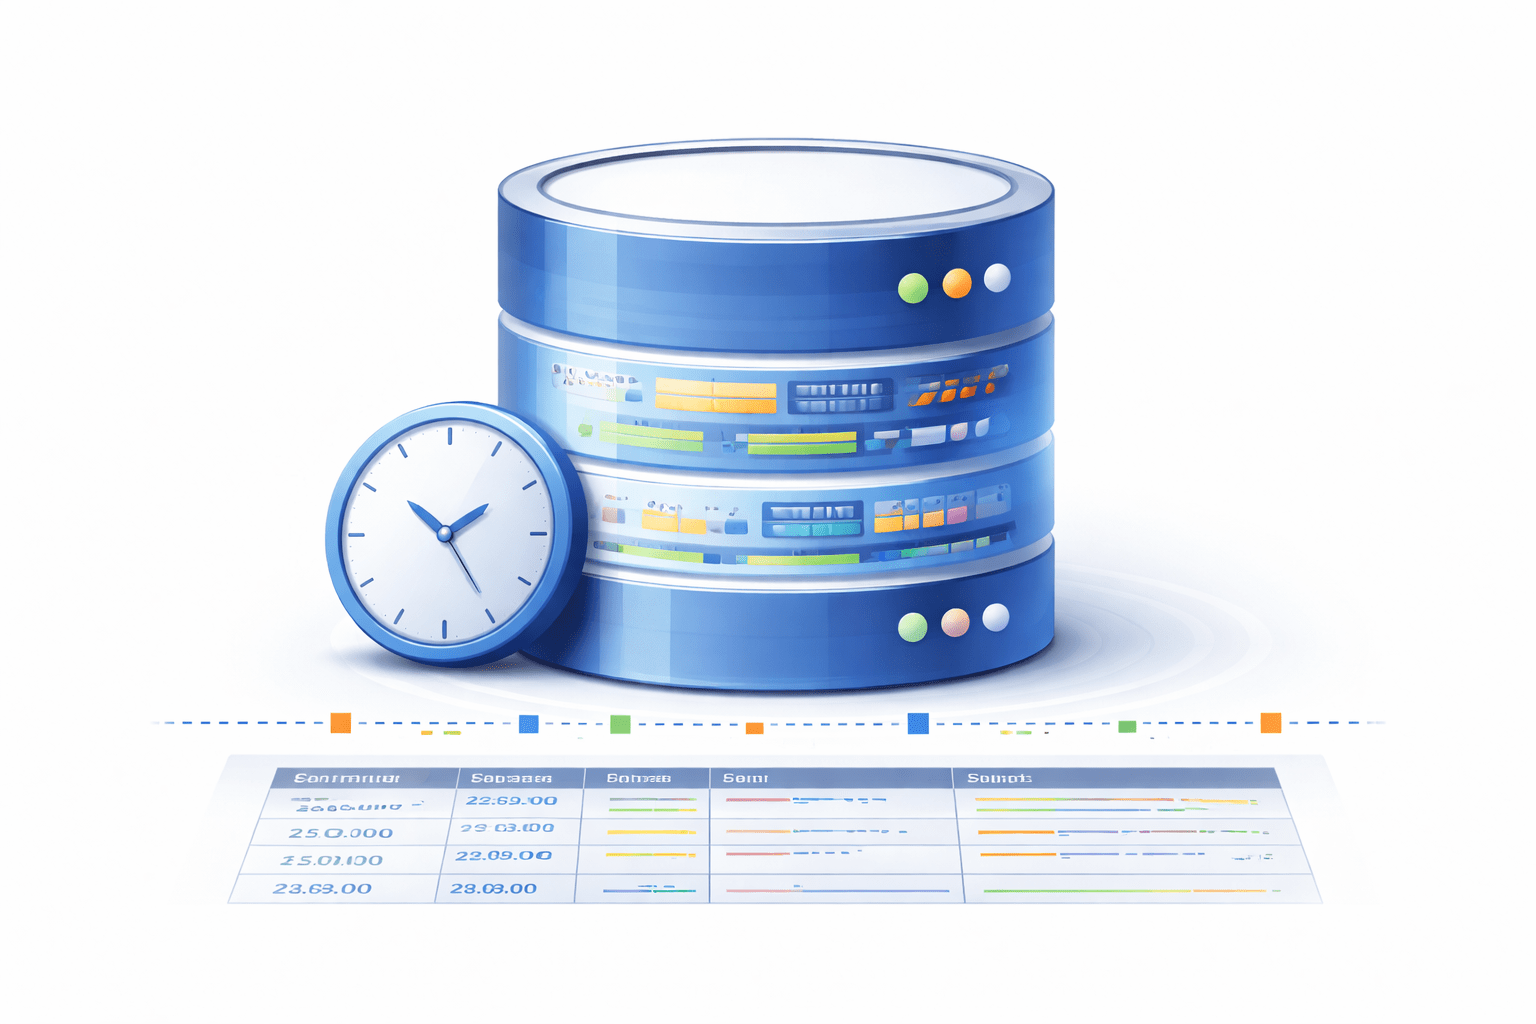
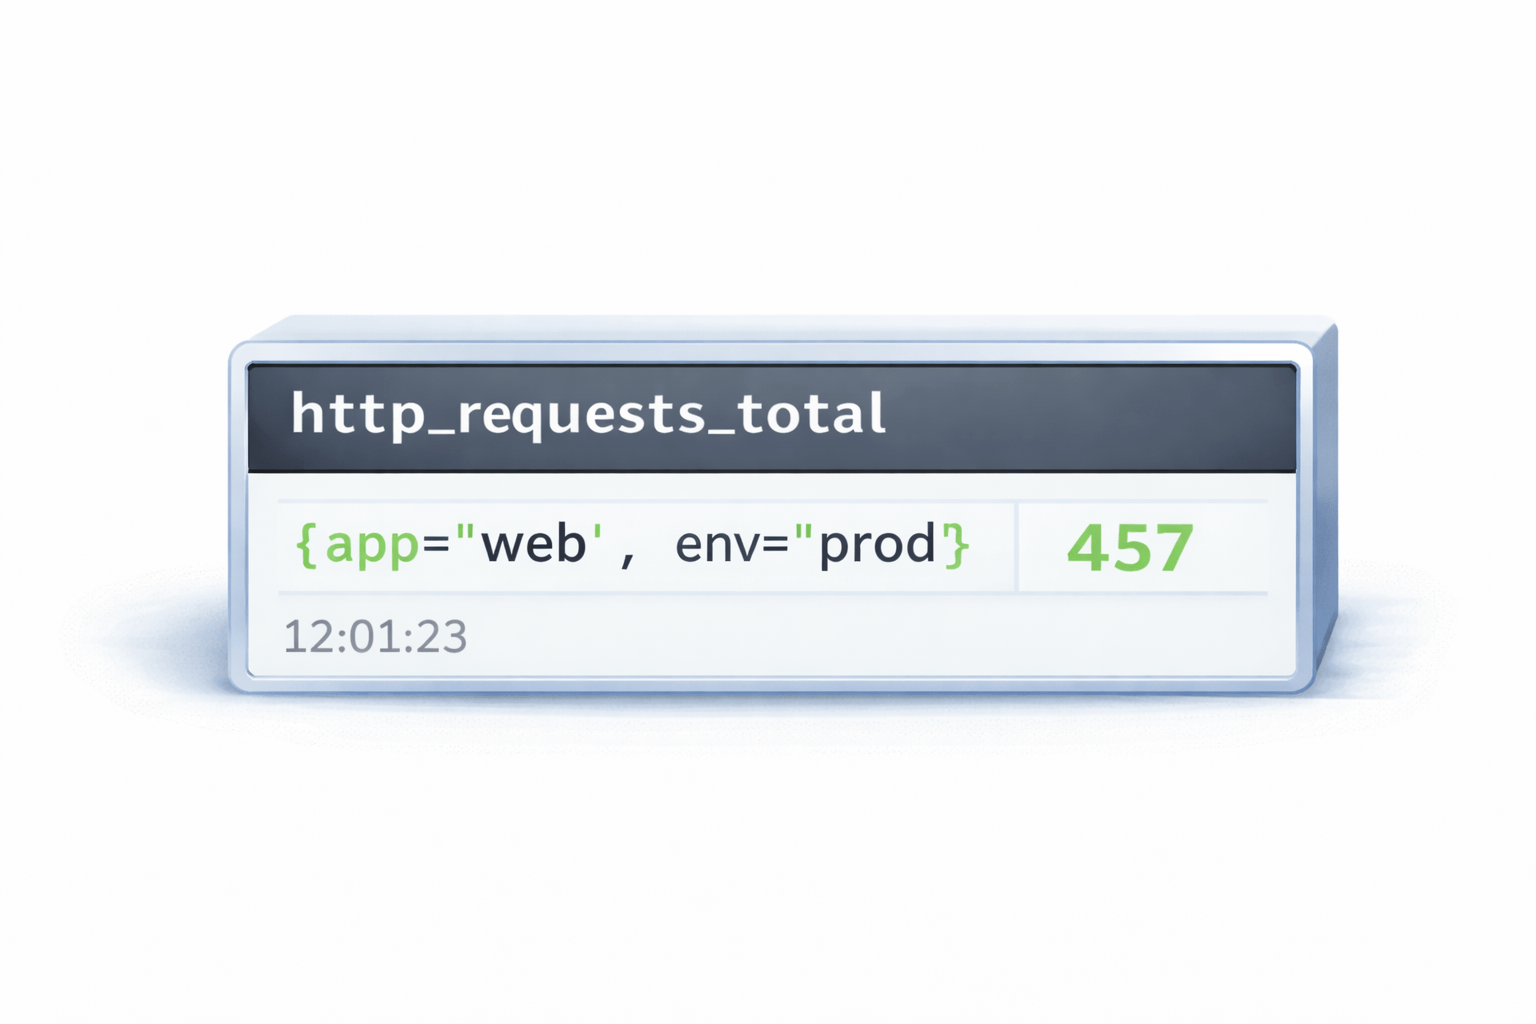
Storing Metrics
Prometheus stores data in Time-Series Database (TSDB)
Each metric includes:
Example format:
cpu_usage{instance="server1"} 75
Metric name
Labels (key-value pairs)
Timestamp
Value
Data is stored locally on disk
Important Points
High write performance
Efficient compression
Data retention configurable
Setting Up Prometheus
Default Port:
wget https://prometheus.io/download/http://localhost:9090tar -xvf prometheus.tar.gz
./prometheus --config.file=prometheus.ymlStep 1: Download Prometheus
Step 2: Extract Files
Step 3: Run Prometheus
Common flags
web.listen-address
Port where Prometheus runs
config.file
Path of config file
storage.tsdb.path
Location to store data
Important Concepts
Pull-based scraping
Configuration via prometheus.yml
PromQL querying
Time-series storage
Summary
5
Widely used in DevOps and cloud monitoring
4
Architecture includes server, targets, exporters, and TSDB
3
Target the right audience
2
It collects, stores, and queries time-series metrics
1
Prometheus is an open-source monitoring tool
Quiz
What type of tool is Prometheus?
A. Visualization tool
B. Log management tool
C. Monitoring and alerting tool
D. Deployment tool
Answer
What type of tool is Prometheus?
A. Visualization tool
B. Log management tool
C. Monitoring and alerting tool
D. Deployment tool
By Content ITV


