HARNESSING THE DATA REVOLUTION FOR FOOD SECURITY AND POVERTY MAPPING
Synergies between Mobile Phone data, Earth Observation and Official Statistics in Senegal
Damien Jacques
Ph.D. Thesis
May 2018

DATA
KNOWLEDGE
DECISION
ACTION
KNOWLEDGE
ASSESSMENT
DATA
767 000 000

815 000 000

OUTDATED
UNRELIABLE
INCOMPLETE
~350M might be missing
(Carr-Hill, 2013)


16M omitted
Lebanon: 1932
Afghanistan: 1979 (coverage: 67%)
R. D. of Congo: 1984
Somalia: 1986 (never released)
SOME
DATA
A LOT MORE
NOW
DATA EXPLOSION / FLOOD / BOOM / TSUNAMI...
BEFORE
DIGITAL FOOTPRINT


source: https://bit.ly/2kvBBUJ
MOBILE PHONE DATA
CALL DATA RECORD

Who ? When ? Where ?
What ?
source: https://bit.ly/2kvBBUJ
MOBILE PHONE DATA
9 000 000 users
1 year
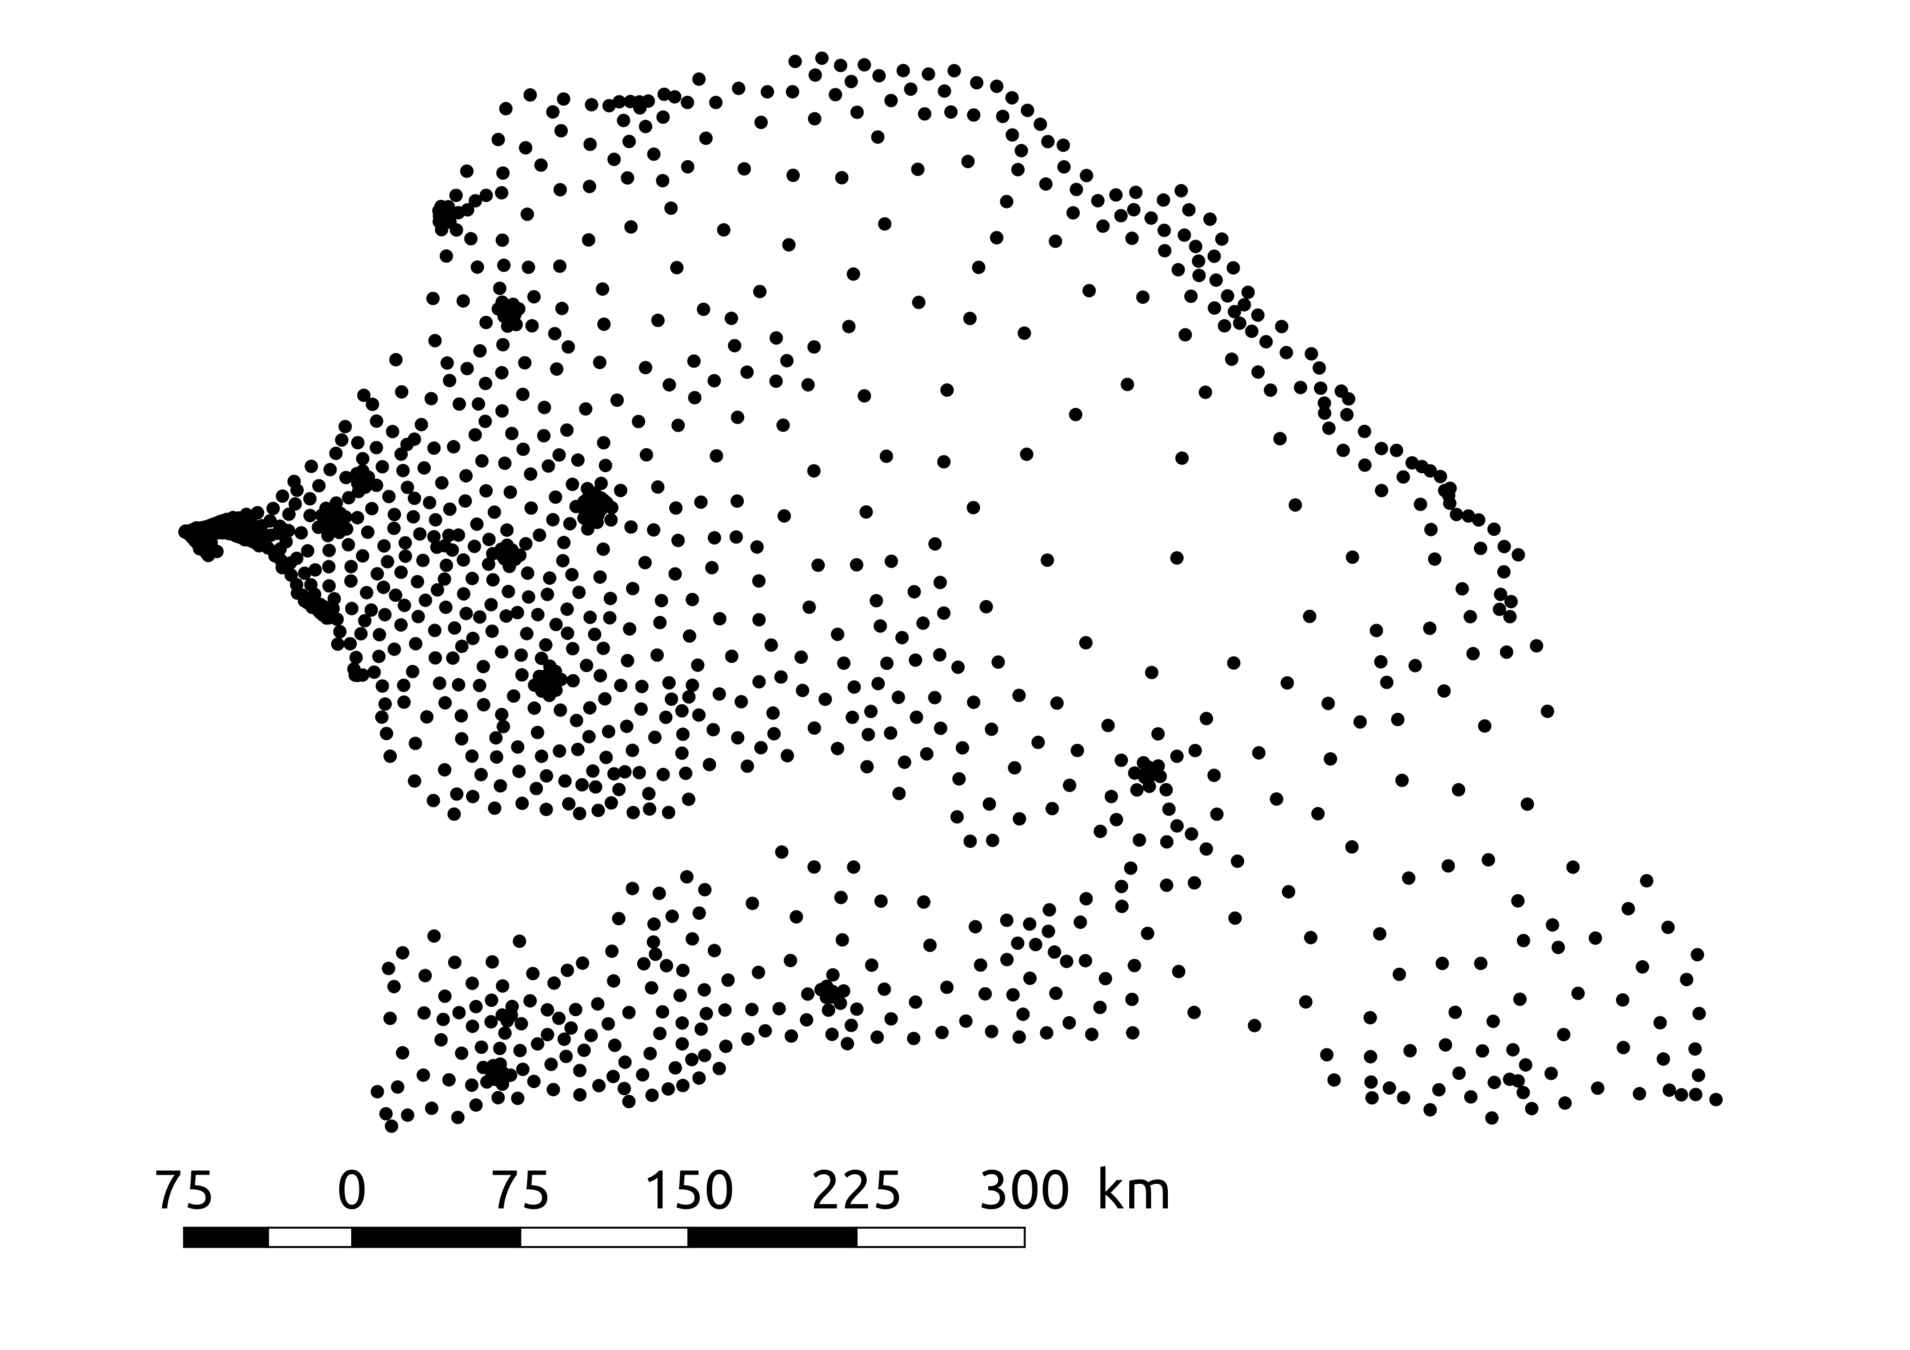
1666 antennas
Billion of interactions

EARTH OBSERVATION
source: https://bit.ly/2s3sBJP
Sentinel-2 (10 m)
FALSE-COLOR IMAGE
R:IR, G:R, B:G

Avezanno, Italy
NIGHTTIME LIGHTS

DATA REVOLUTION
FOR SUSTAINABLE
DEVELOPMENT
“The integration of the new data with traditional data to produce high-quality information that is more detailed, timely and relevant for many purposes and users, especially to foster and monitor sustainable development
The increase in the usefulness of data through a much greater degree of openness and transparency, avoiding invasion of privacy and abuse of human rights from misuse of data on individuals and groups, and minimising inequality in production, access to and use of data
Ultimately, more empowered people, better policies, better decisions and greater participation and accountability, leading to better outcomes for people and the planet.”
(UN, 2014)
HARNESSING THE UNIQUE FEATURES OF EARTH OBSERVATION AND MOBILE PHONE DATA TO DEVELOP AND TEST NEW METHODS CONTRIBUTING TO BRIDGE THE KNOWLEDGE GAP IN FOOD SECURITY AND POVERTY MAPPING IN AFRICA.
HDI: 162/188
Statistical capacity score:
3rd in sub-Sarahan Africa
Mobile phone subscription: ~100%
...
SENEGAL
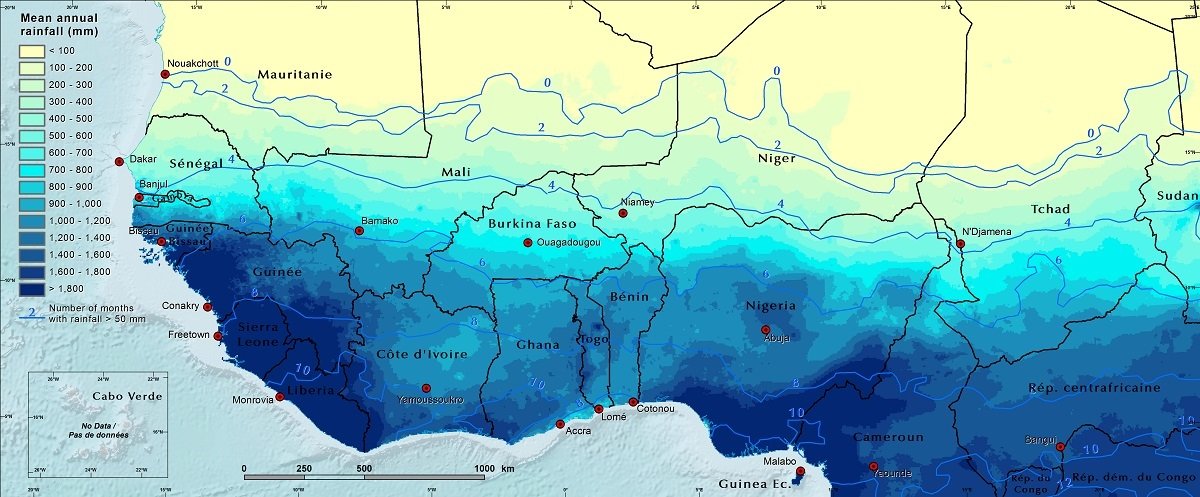
source: https://eros.usgs.gov/westafrica/node/157
source: http://www.mdpi.com/2077-0472/7/7/59

IMPROVED POVERTY PREDICTION
AND MAPPING
1
_
Present a computational framework that integrates
disparate data source (mobile phone and environmental data)
to accurately predict poverty and its dimensions,
at finest level of spatial granularity.
OBJECTIVE
WHAT IS POVERTY?
> 150 definitions (1970-2000)
POVERTY IS MULTIDIMENSIONAL
MPI
HEALTH
EDUCATION
LIVING STANDARDS

WHAT DID WE ACHIEVE?
Before / After
Accurate poverty map and its dimension at the finest administrative unit.
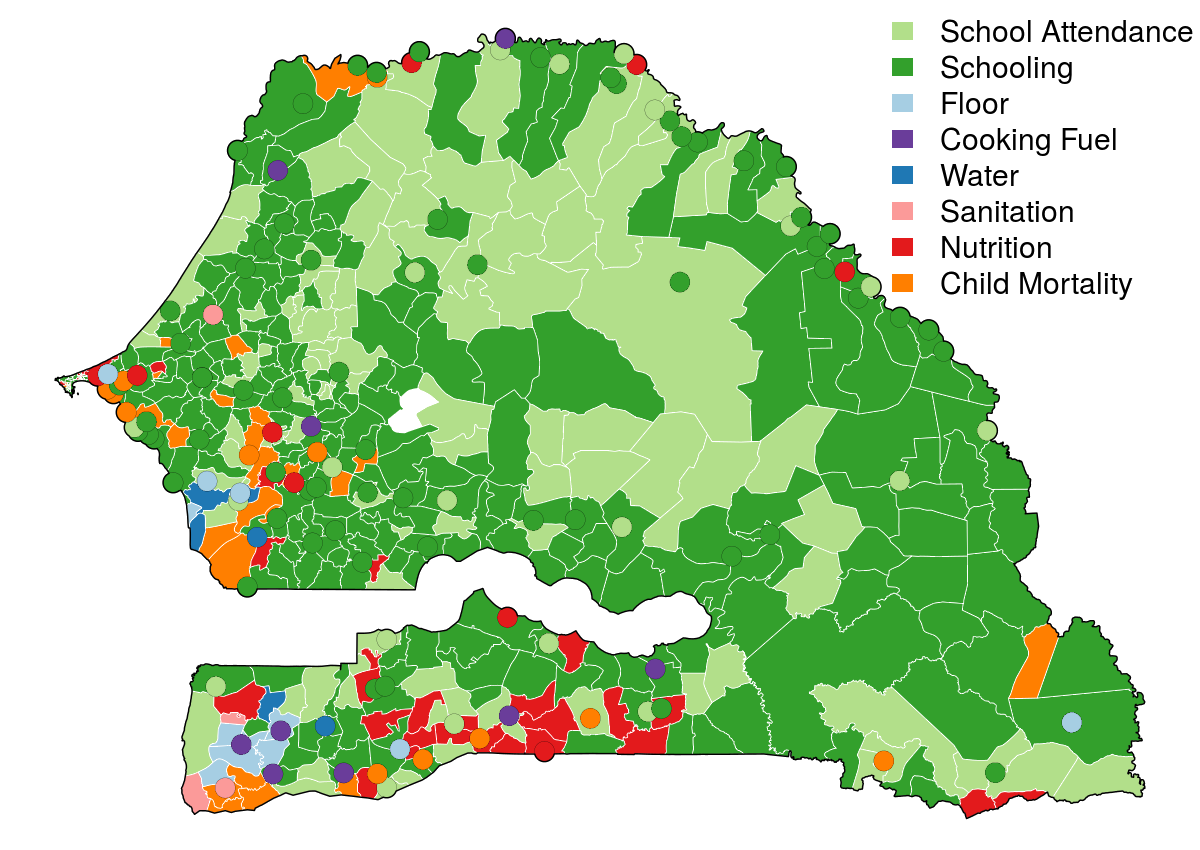
Correlation = 0.91
MULTI-VIEW APPROACH
MOBILE PHONE DATA
ENVIRONMENTAL DATA
EO OBSERVATION (NDVI, NIGHTTIME LIGHTS)
ROAD DENSITY
PROXIMITY TO FACILITIES
CLIMATE
... TOTAL = 81
NUMBER OF CONTACTS
RATIO SMS/CALL
ACTIVITY
RADIUS OF GYRATION
.... TOTAL = 43 x12 = 516

2015
2017
2016
SENSITIVE DATA


REGULAR DATA
COMBINE OUTPUTS
Mobile Phone Data
Environment data
1) Gaussian process regression, regularization and spatial cross-validation
METHOD
VALIDATION
Census Data (431 communes + 121 urban centers)
RELATIONSHIP BETWEEN POVERTY AND VARIABLES
?
GAUSSIAN PROCESS REGRESSION
GP(m(\bold{\text{x}}), k(\bold{\text{x}},\bold{\text{x}}'))
covariance
mean
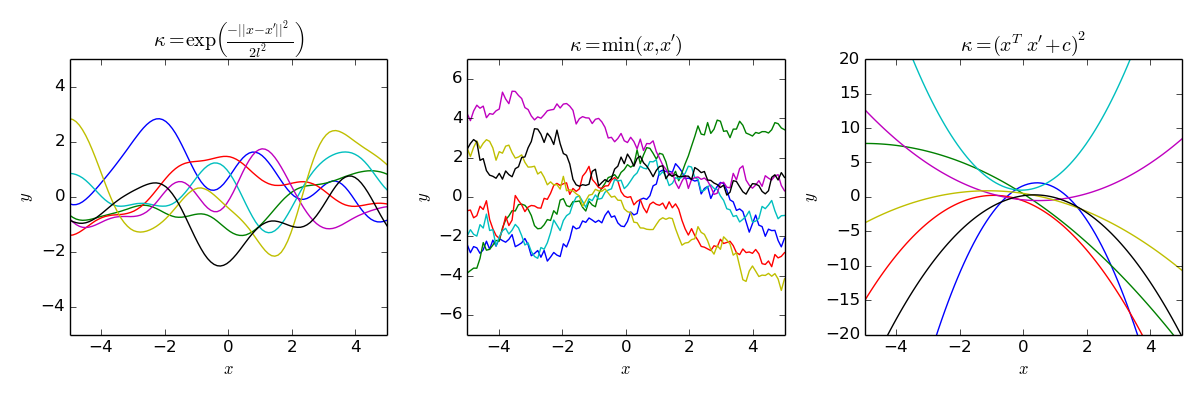
author: Cdipaolo96
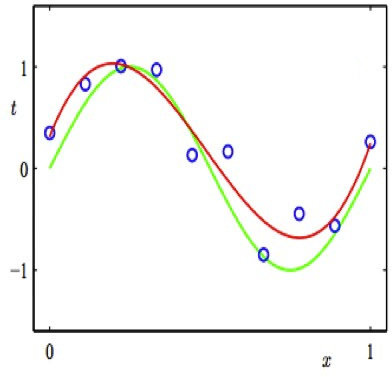
PRIOR:
GAUSSIAN PROCESS REGRESSION
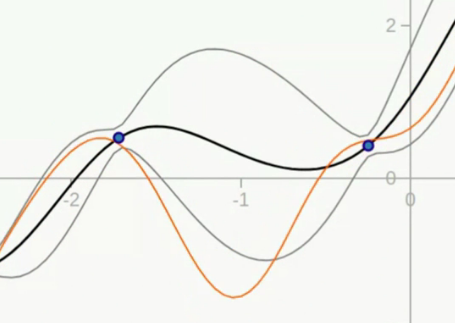
POSTERIOR = PRIOR + OBSERVATIONS
TRUE MODEL
PREDICTED MODEL
OBSERVATION (with noise)
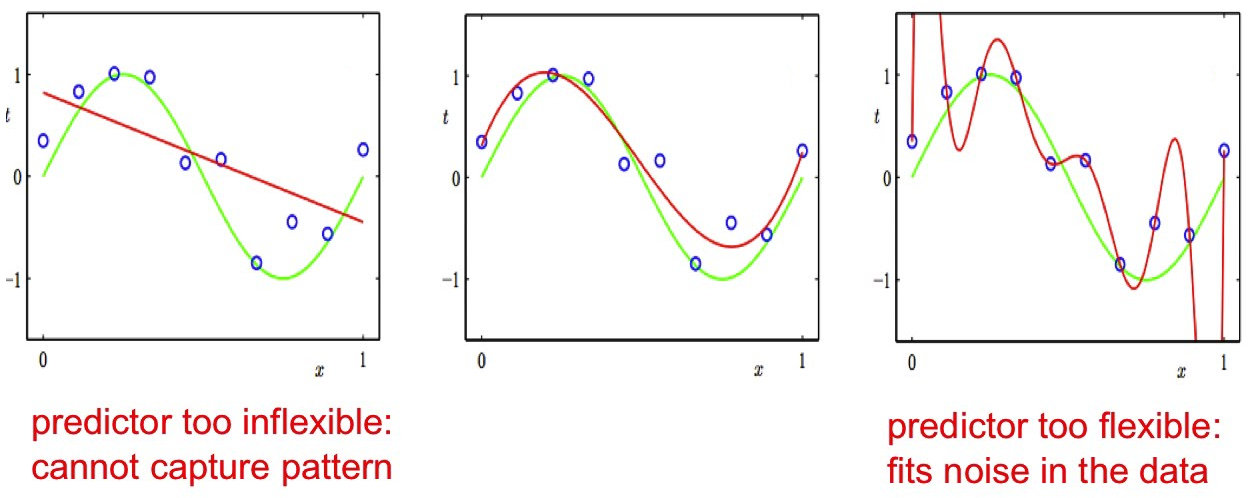
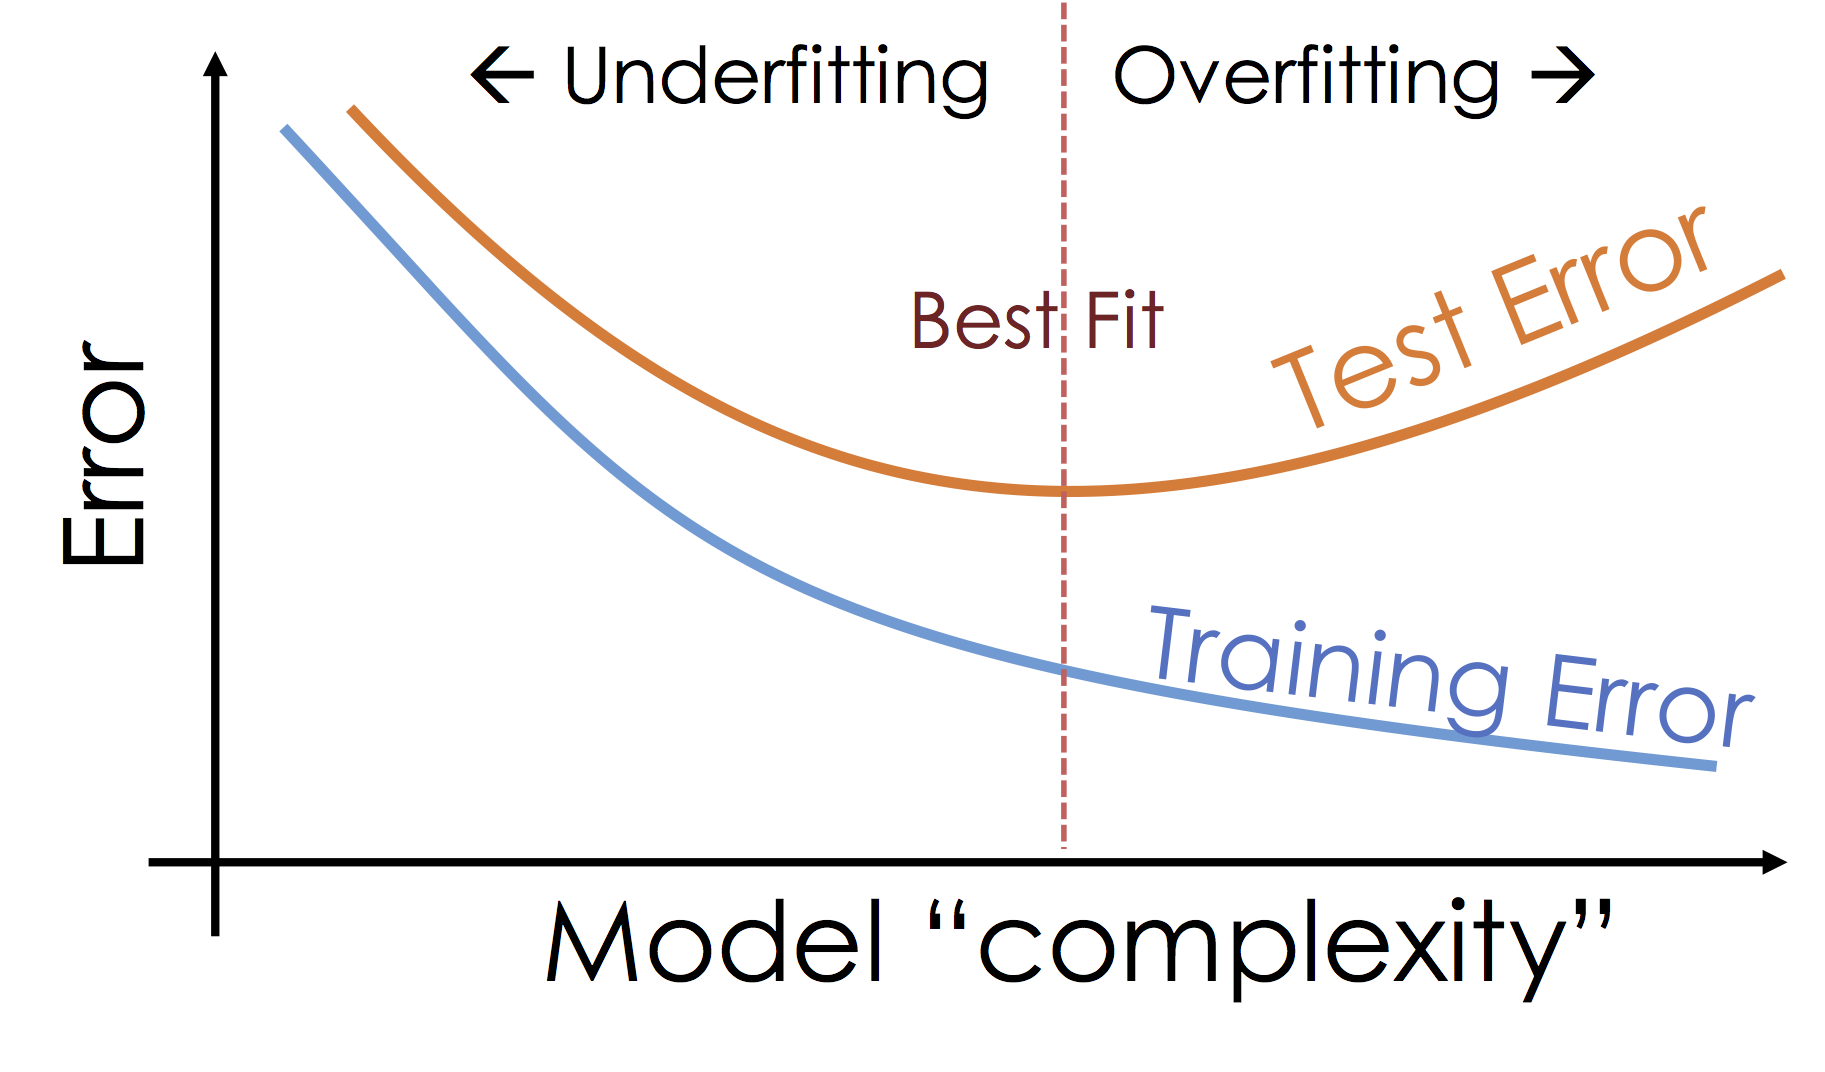
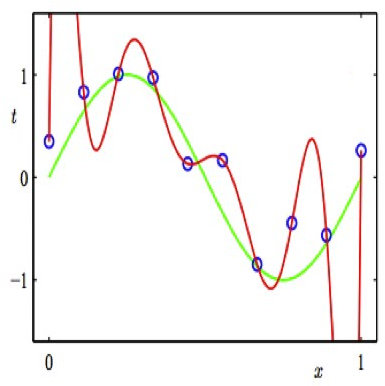
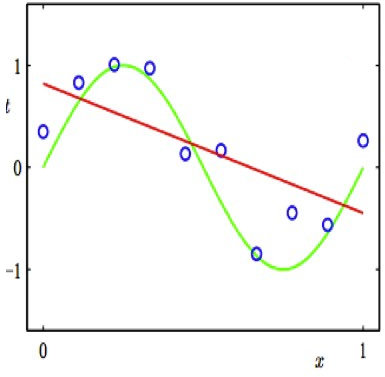
OVERFITTING
REGULARIZATION & SPATIAL CROSS-VALIDATION
MODEL COMPLEXITY
UNDERFITTING
OVERFITTING
BEST MODEL
CROSS-VALIDATION

TRAINING
TEST
SPLIT THE DATA IN TEST AND TRAINING SET
TEST
TRAINING
DATA

SPATIAL
1) Gaussian process regression, regularization and spatial cross-validation
METHOD
2) Mixture distribution of model outputs
VALIDATION
Census Data (431 communes + 121 urban centers)
Outputs combinations
based on the uncertainy of the GP
Outputs combinations
based on the uncertainy of the GP
MP DATA
ENV DATA
Weighted mean based on uncertainty
Disparate data sources can be efficiently combine to provide accurate predictions of poverty and its individual dimensions to finest spatial microregions.
Sensitive data (mobile phone data) can remain safely stored behind the firewall of data providers.
CONCLUSIONS
SOCIAL CAPITAL AND TRANSACTION COST IN MILLET MARKETS
2
_
Assess the effect of transaction costs
generated by social capital
on millet retail prices in Senegalese food markets
for 3 contrasted years.
OBJECTIVE
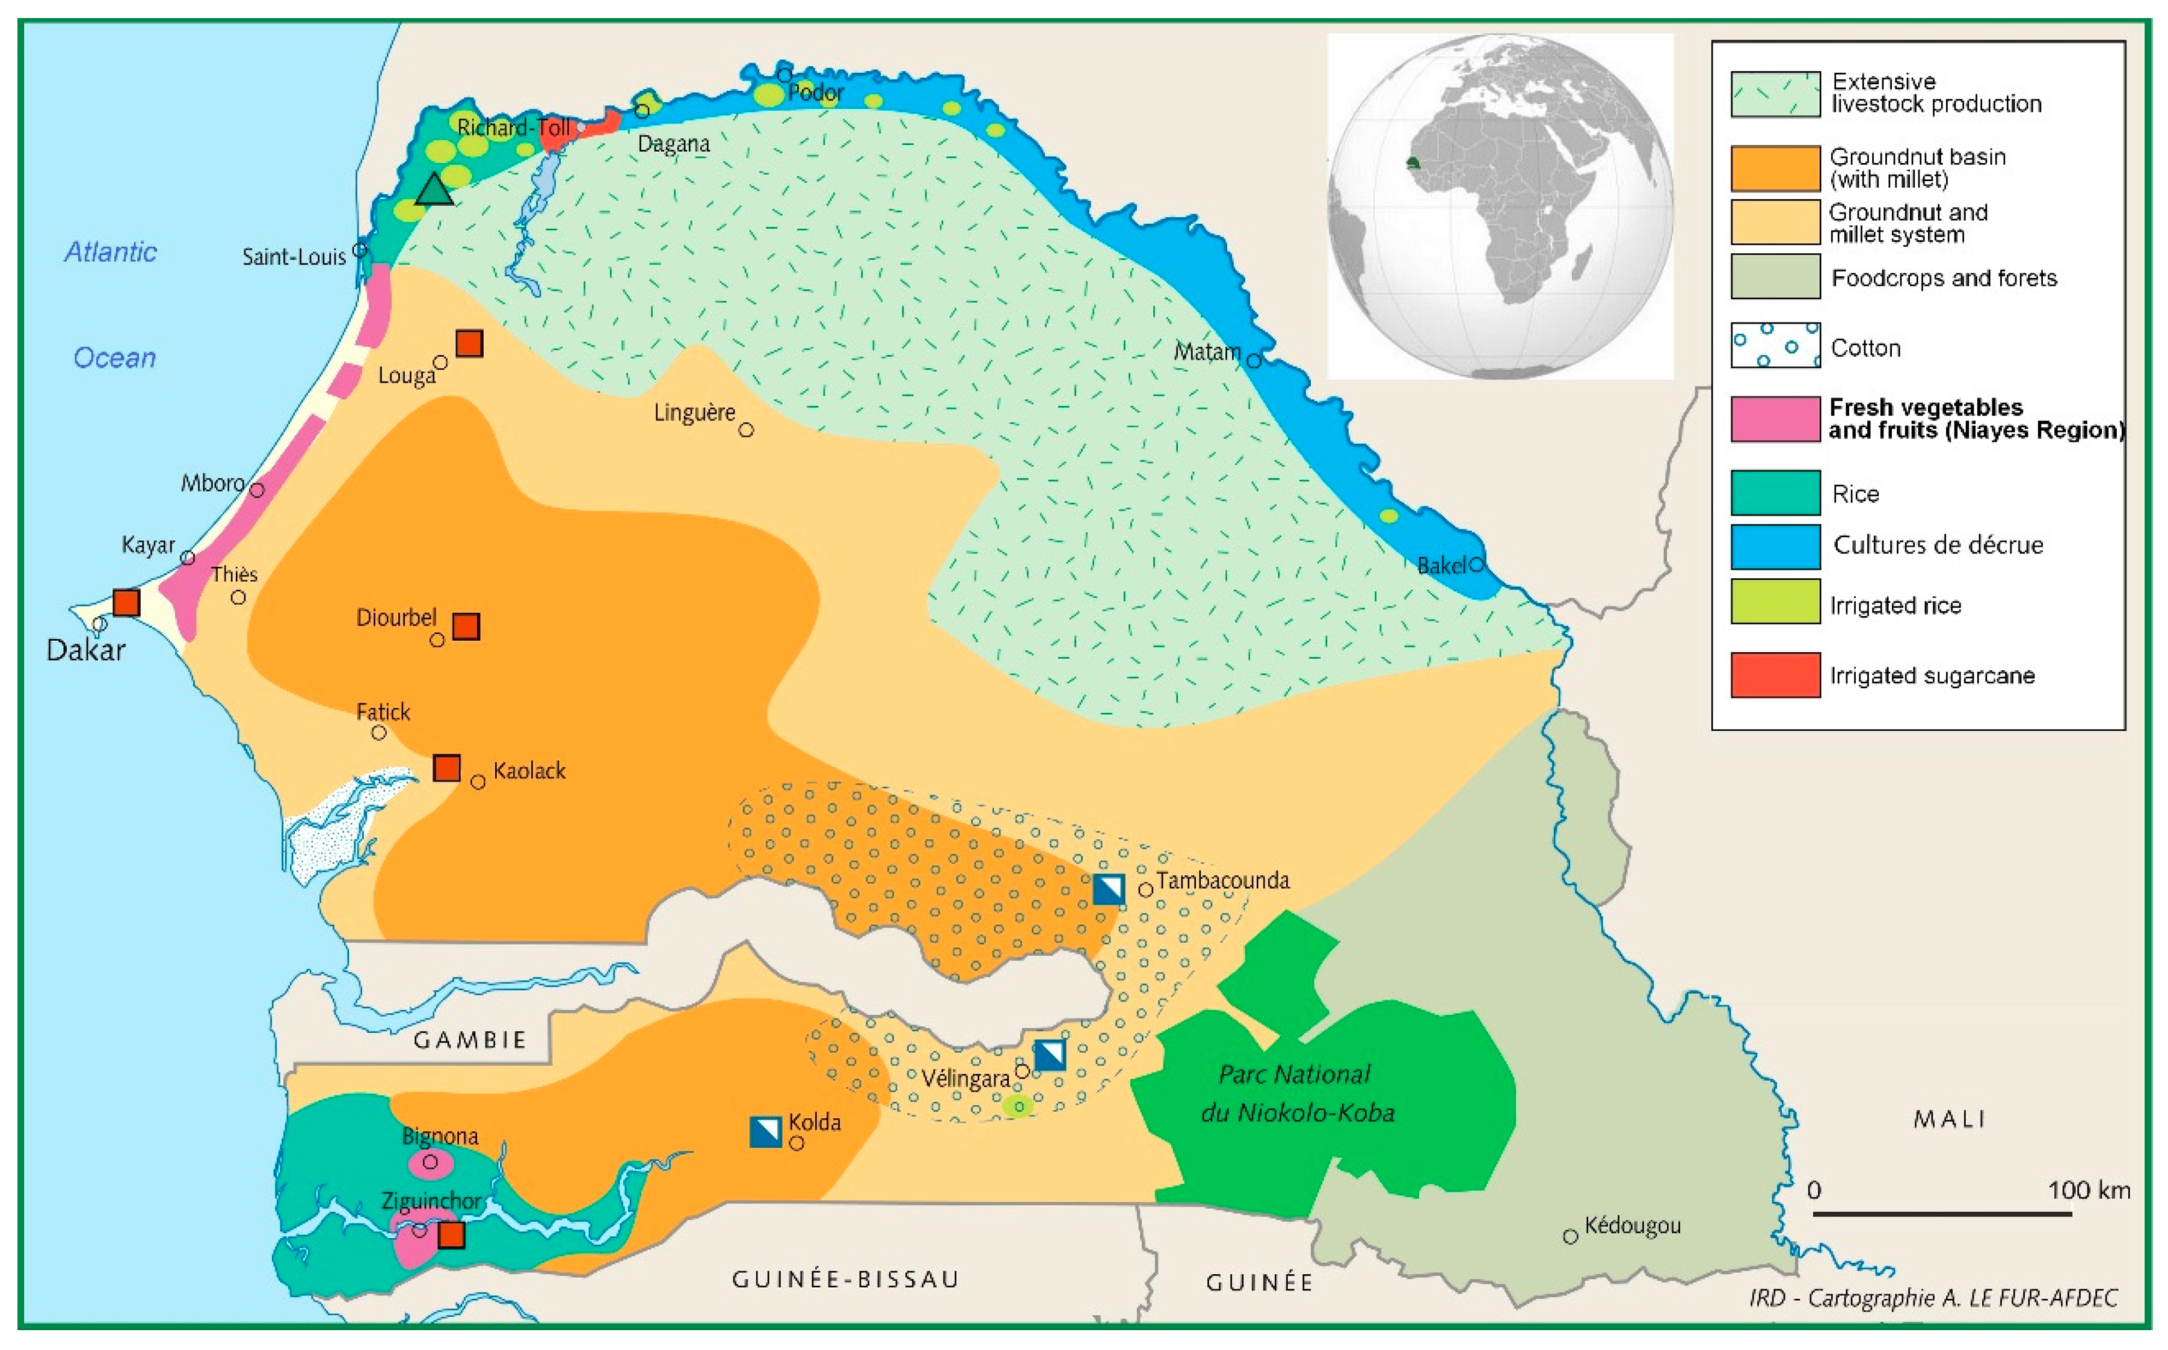
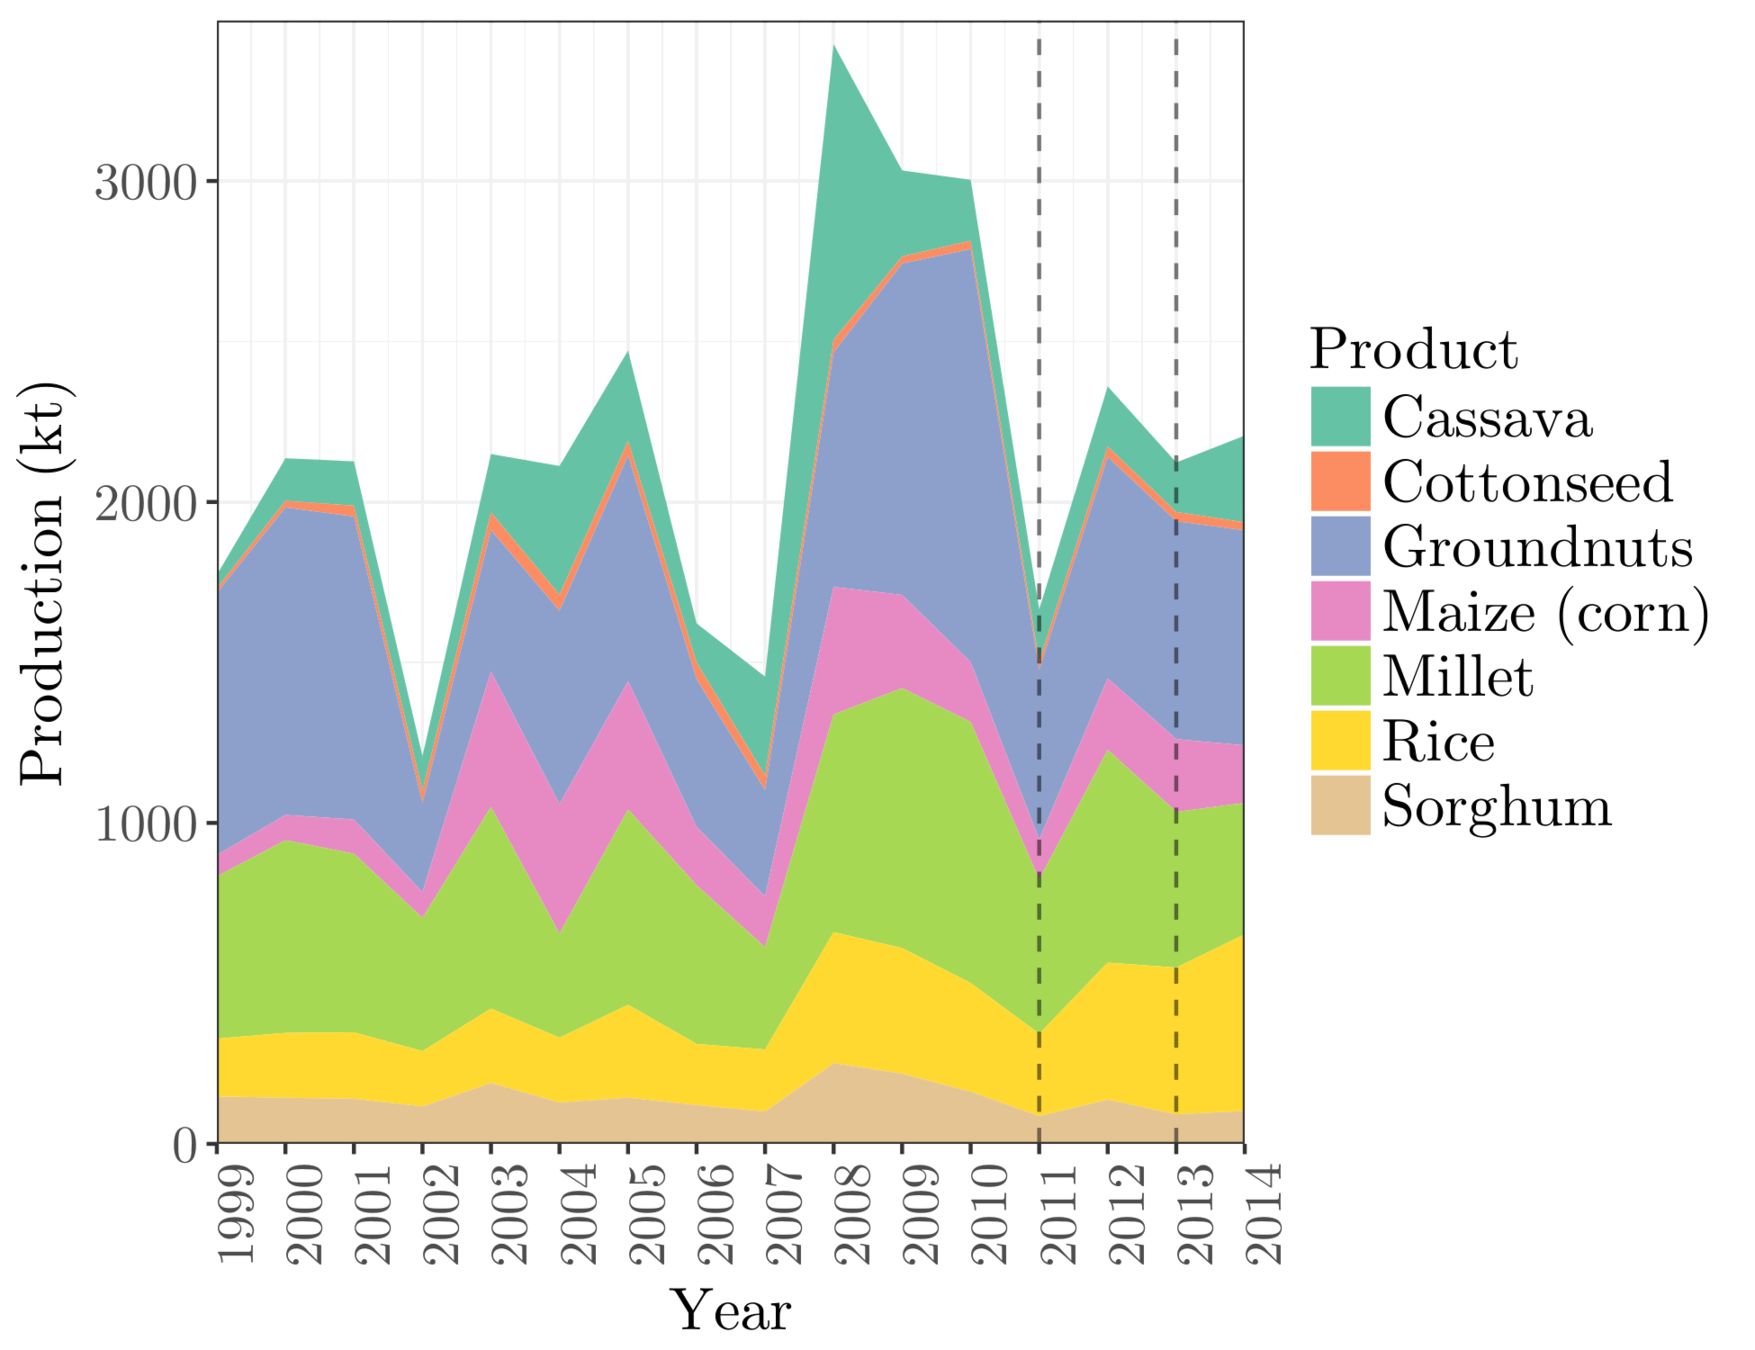
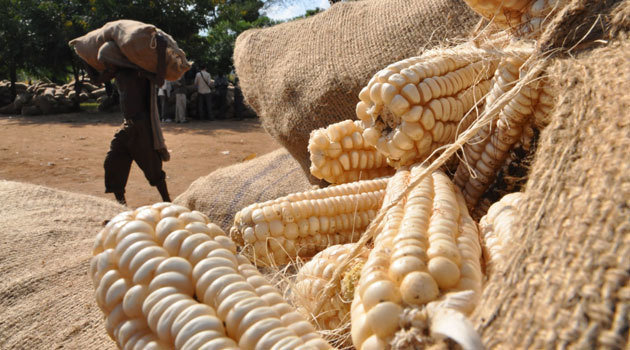
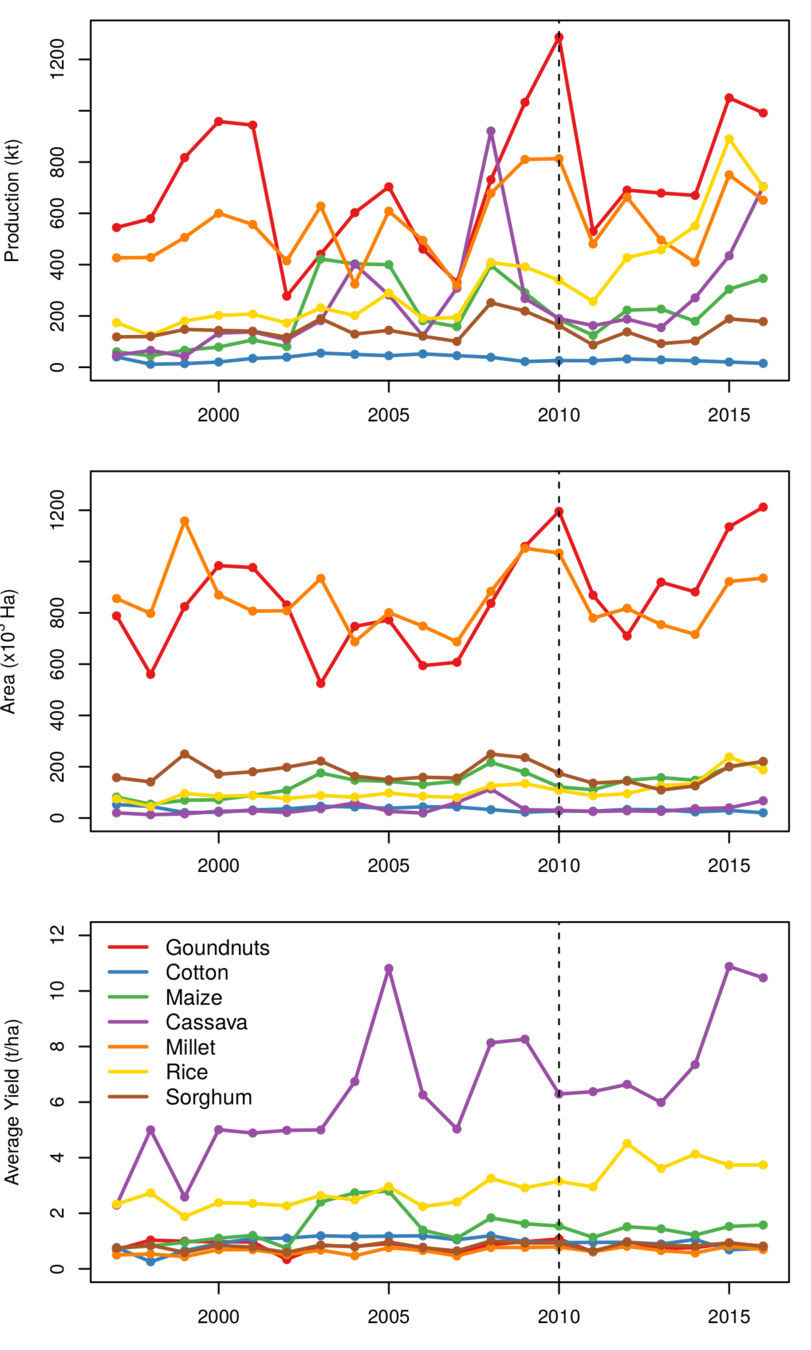
MILLET IS THE SECOND HIGHEST CROP PRODUCTION IN SENEGAL


TEMPORAL VARIABILITY
SPATIAL VARIABILITY
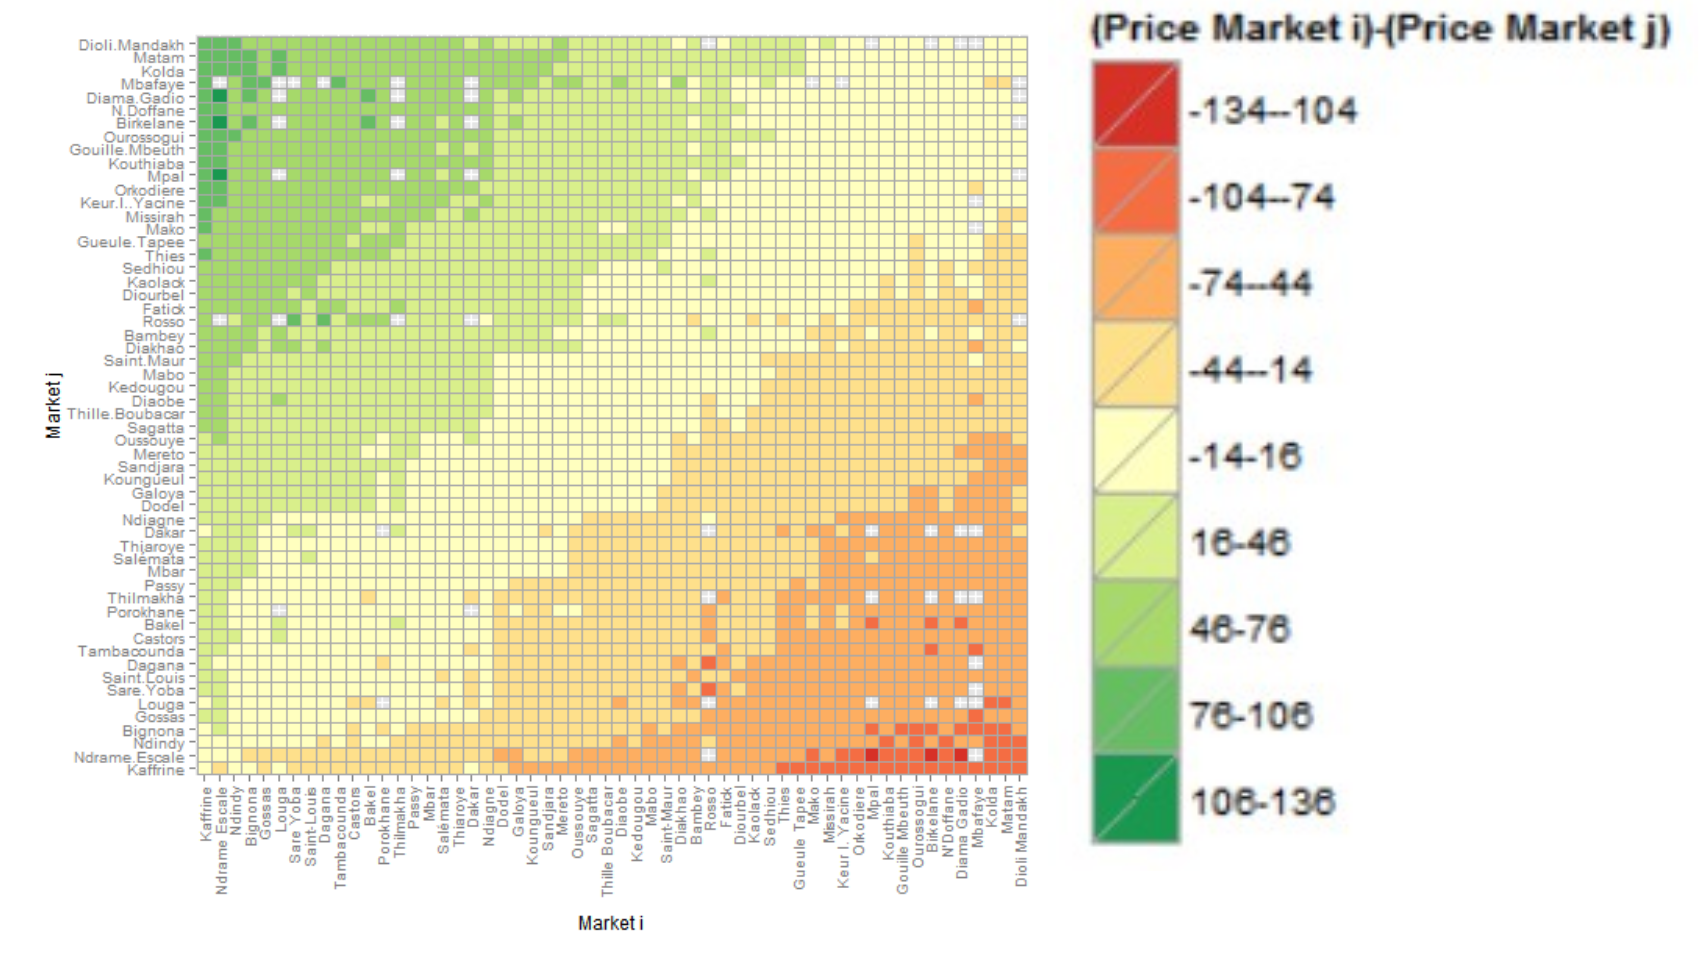
Market i
Market j
Price i - Price j
Compared scenario w/ and w/o transaction costs
using a spatial equilibrium model
consisting of a network
with markets located at network nodes and
network links that serve for commodity transportation flows.
METHOD
LAW OF PRICE AND DEMAND

SUPPLY DEMAND MARKET AREA

Crop Stats+NDVI Worldpop Road Network


A
B
transportation cost = 2$
2$
5$
A - B = 3$ > 2$
trade opportunity

SCENARIO I
A
B
transportation cost = 2$
3$
4$
A - B = 1$ < 2$
trade opportunity
SCENARIO I
A
B
transportation cost = 2$
2$
5$


TRANSACTION COST
(SOCIAL CAPITAL)
A - B = 3$ < 2$ + ∞
trade opportunity
SCENARIO II
SCENARIO II
SCENARIO I
DOES
EXPLAIN MORE THE
PRICE VARIANCE THAN
?
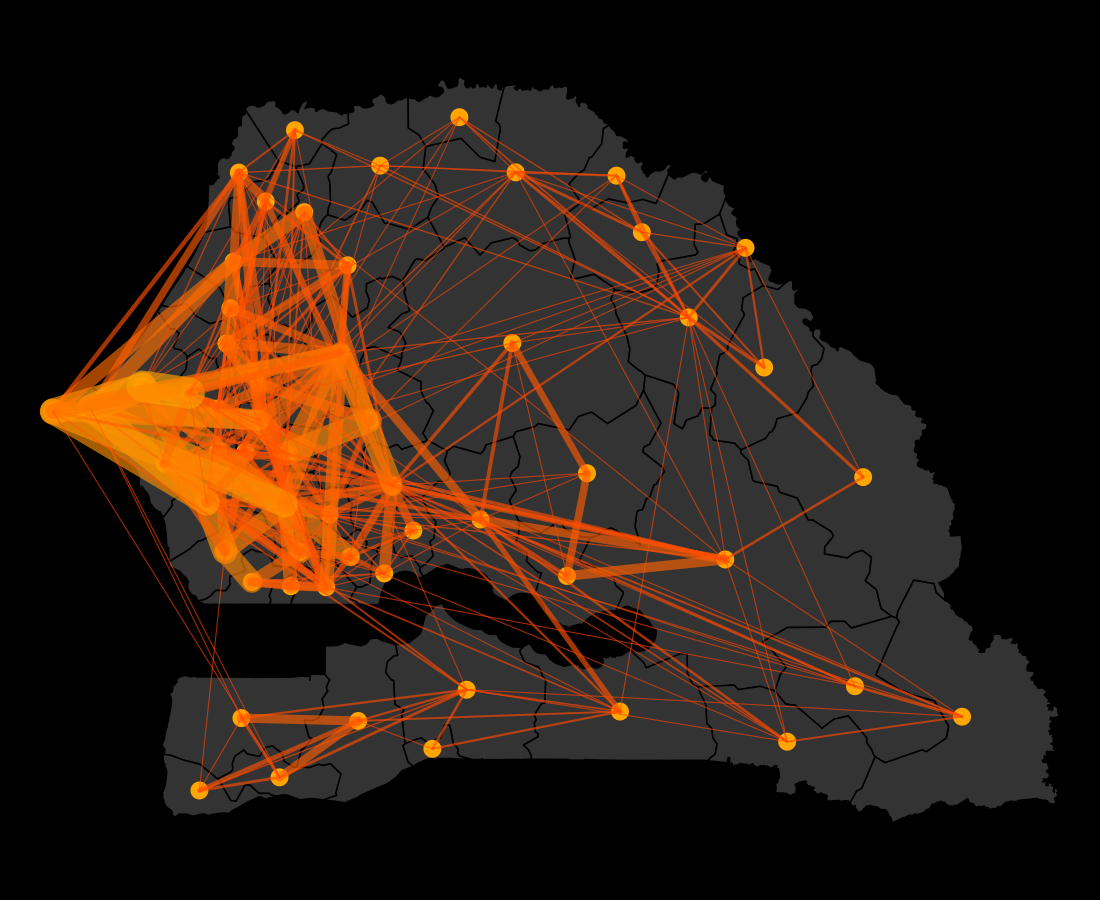
TRADE FLOWS
RESULTS
SCENARIO II
SCENARIO I
Transaction costs
2012
2013
2014
Year
55%
57%
66%
+6%
+9%
+1%
high
high
low
ATTEMPT AT INTERPRETATION
POOR YEAR
AVERAGE YEAR
Accounting for the impact of social capital on transaction costs explains between 1 and 9% of the price variance depending on the year.
The year-specific effect remains challenging to assess but could be related to a strenghtening of risk aversion following a poor harvest.
Further insights can be expected from expanding the model to other countries, commodities and years.
CONCLUSIONS
ACCURACY REQUIREMENTS FOR EARLY ESTIMATORS OF CROP PRODUCTION
3
_
Develop a methodological framework
to define the accuracy requirements
for early estimators of production components: crop area (+ cropland area) and crop yield.
OBJECTIVE

EARLY WARNING SYSTEMS FOR FOOD SECURITY RELY ON TIMELY AND ACCURATE ESTIMATION OF CROP PRODUCTION
EARTH OBSERVATION DATA CAN BE USED TO GET CROP PRODUCTION ESTIMATION
CROPLAND
CROP TYPE
PIXEL COUNTING -> CROP AREA
ACCURACY ?

CROP YIELD
ACCURACY ?
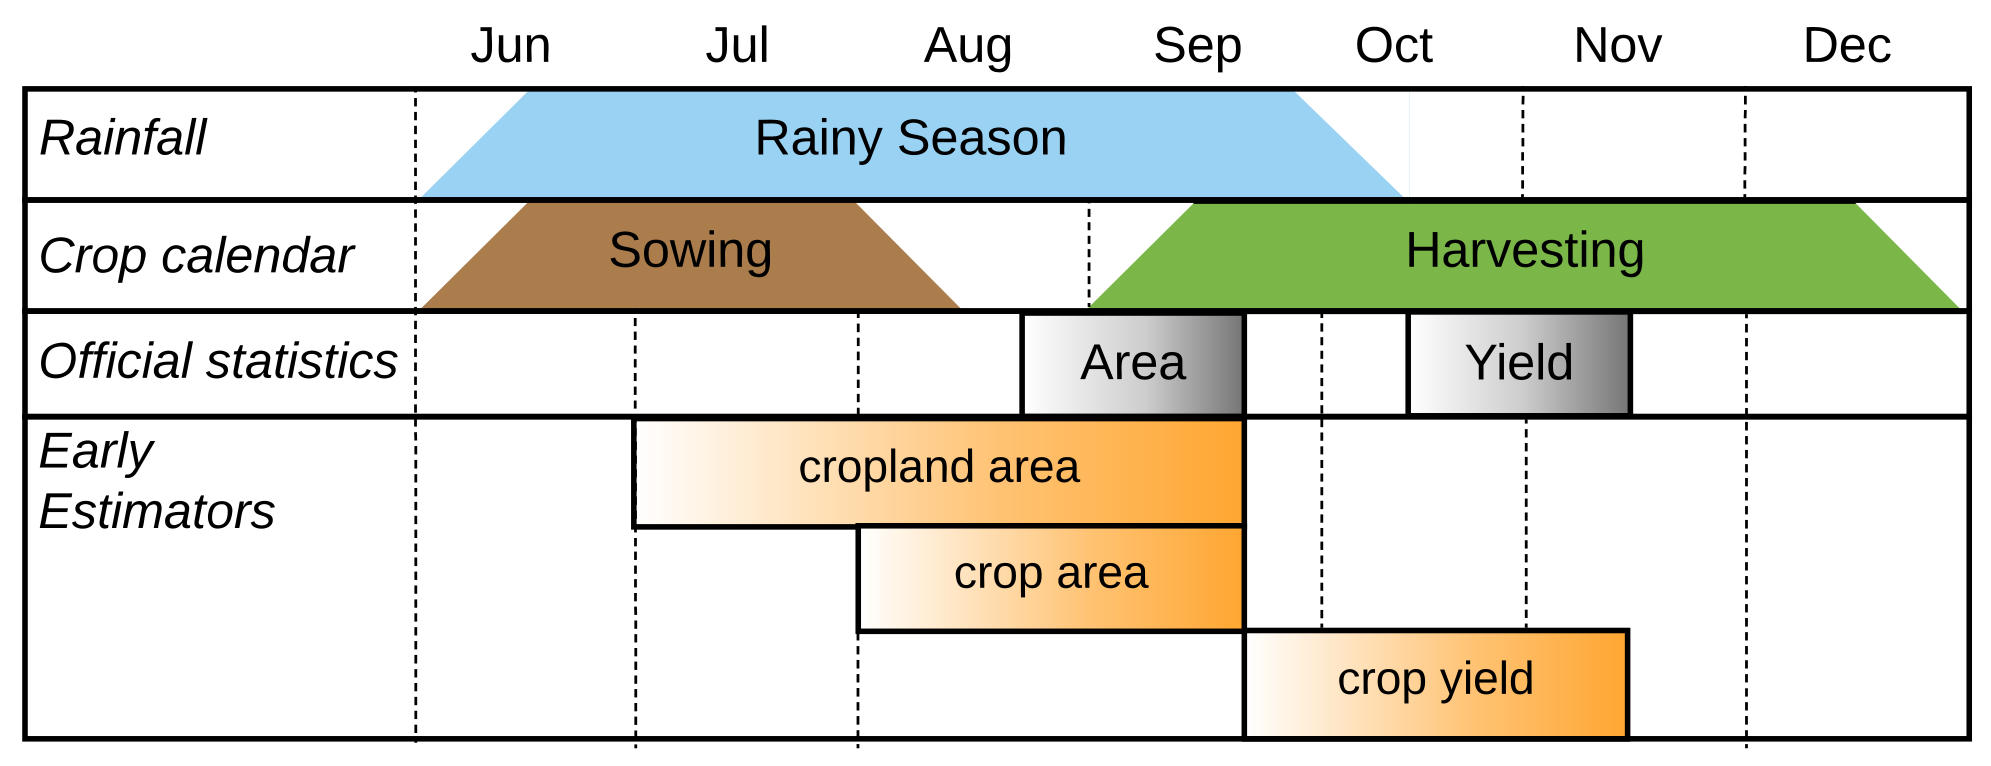
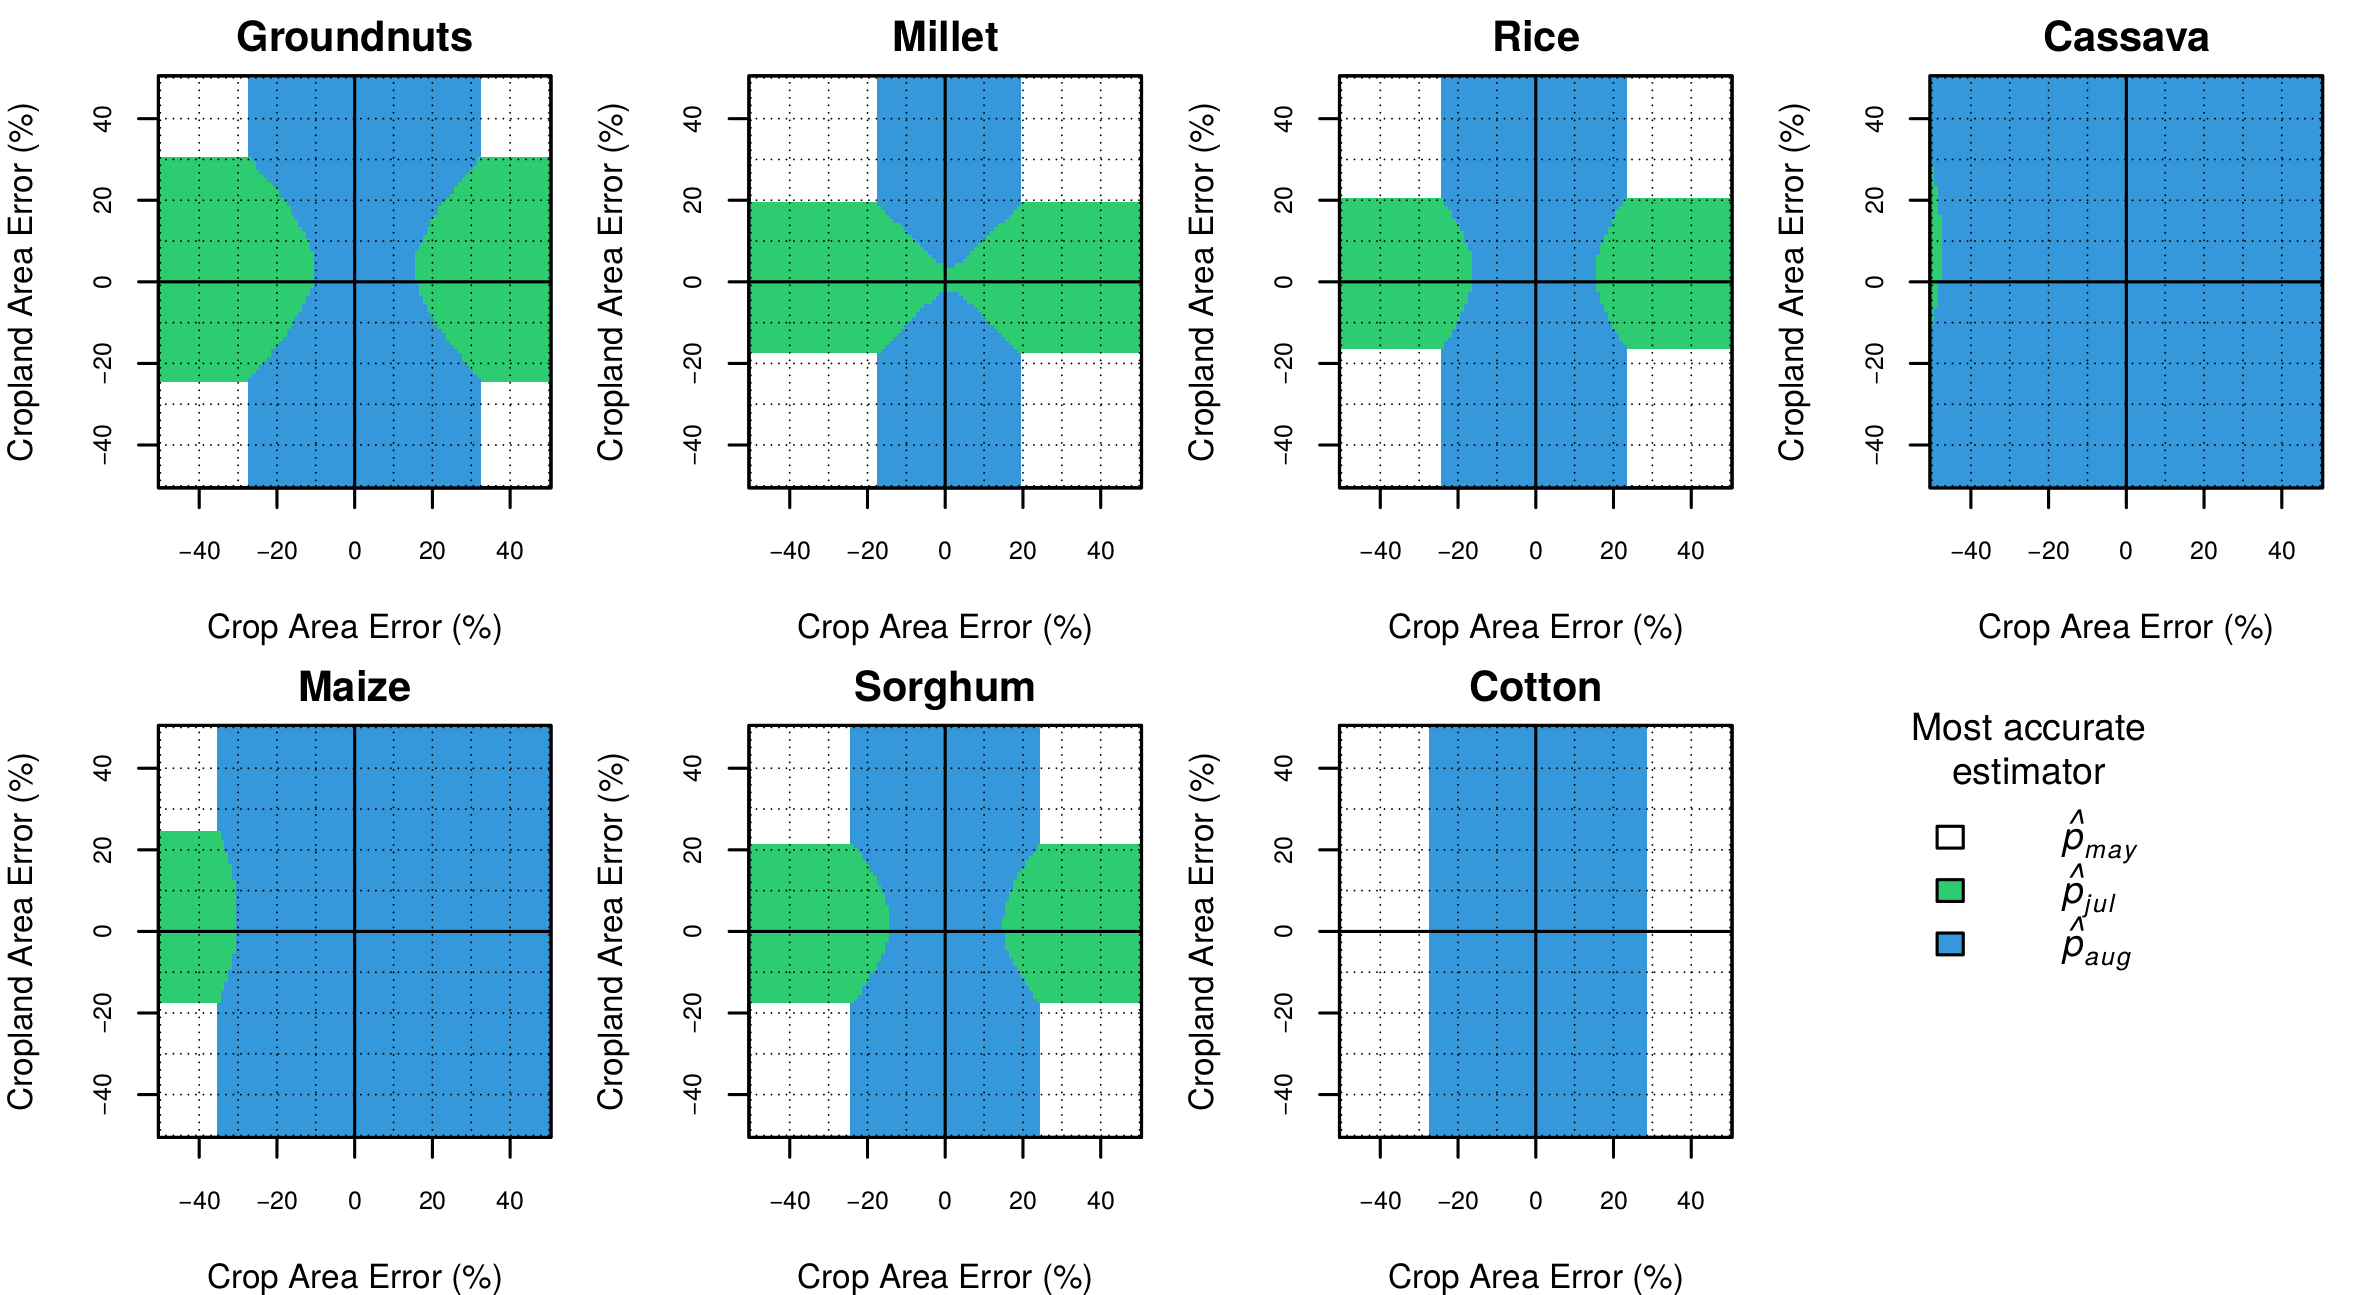
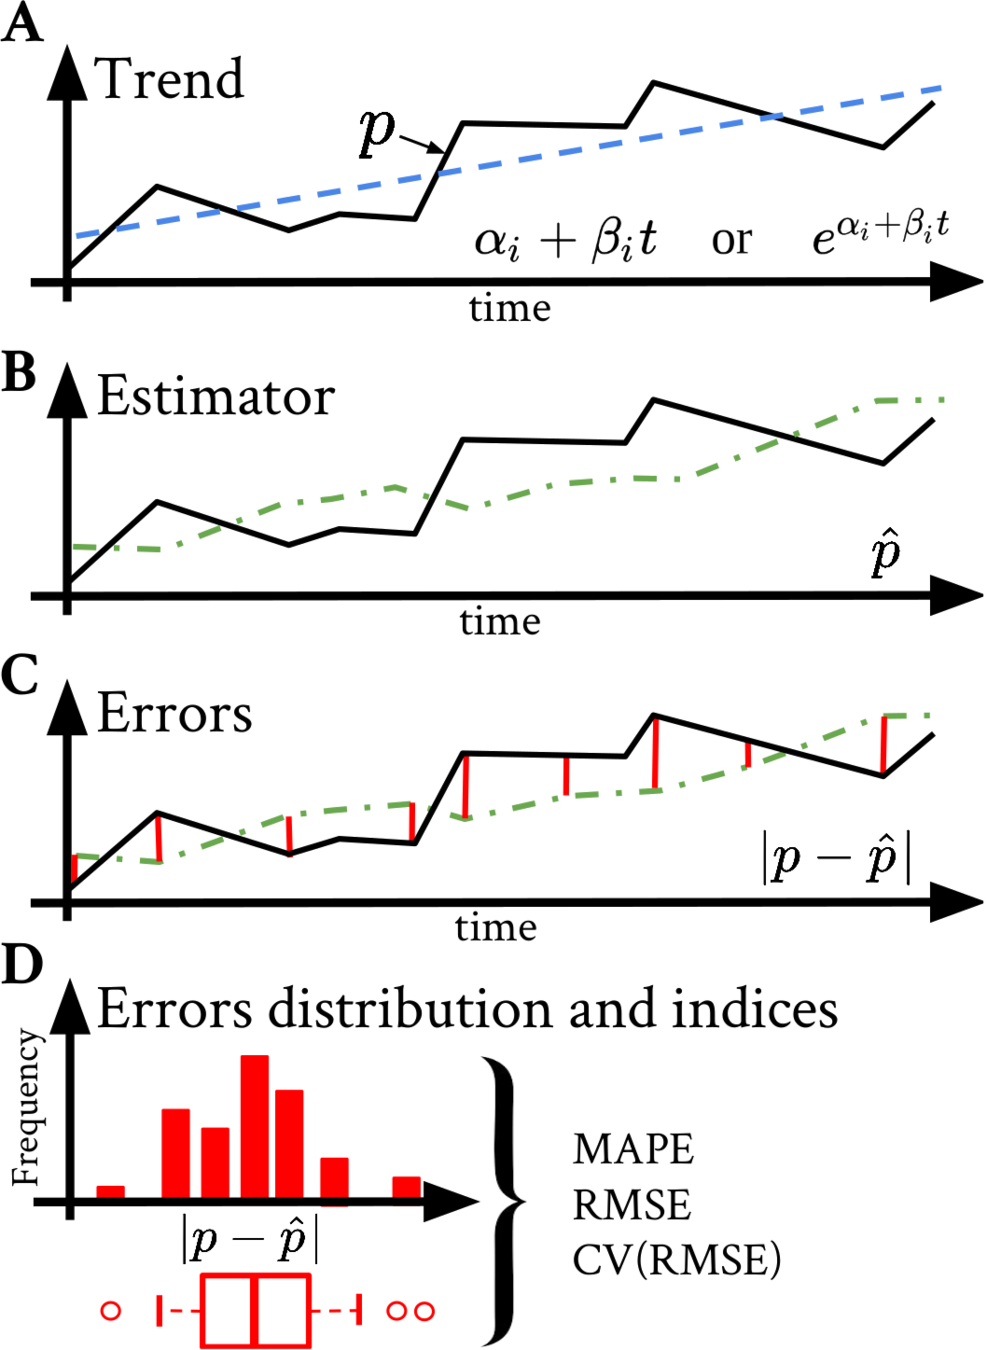
PRODUCTION CAN BE ESTIMATED BY PAST MEAN & TREND IN JUNE.
AREA IS KNOWN IN SEPT.
YIELD (and therefore PRODUCTION) IS KNOWN IN NOV.
YIELD CAN HARDLY BE ESTIMATED BEFORE SEPT.
CROPLAND IS EASIER TO ESTIMATE THAN CROP AREA.
METHOD
JUNE
JULY
AUG.
SEP.
OCT.
NOV.
PROD = AREAEO-cropland x YIELDpast
PROD = AREAEO-croptype x YIELDpast
PROD = AREA x YIELDpast
PROD = AREA x YIELDEO
PROD = PRODpast
PROD = AREA x YIELD
BEST ESTIMATOR OF PRODUCTION ALONG THE SEASON
PRE-HARVEST
POST-HARVEST
ERROR
ERROR
ERROR
ERROR
ERROR
0
>
>
>
>
>
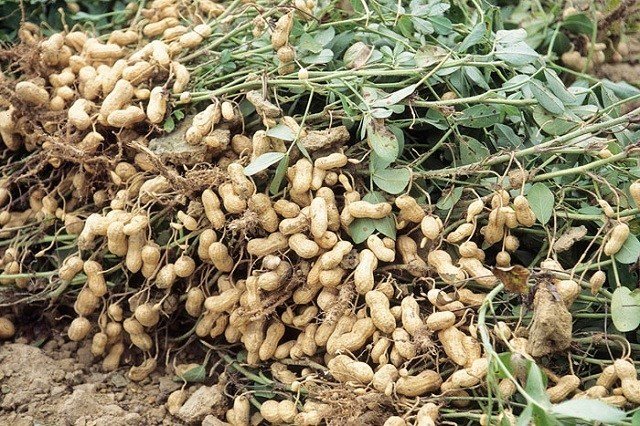
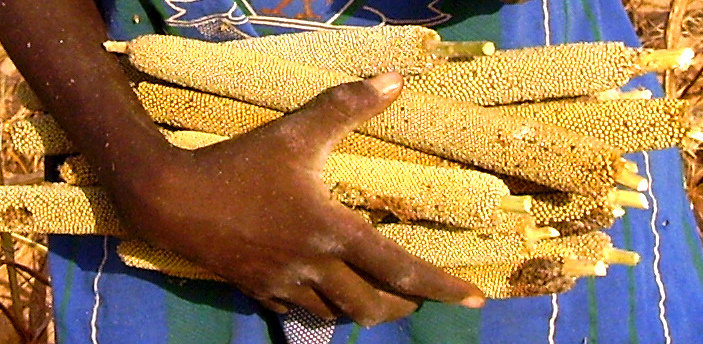
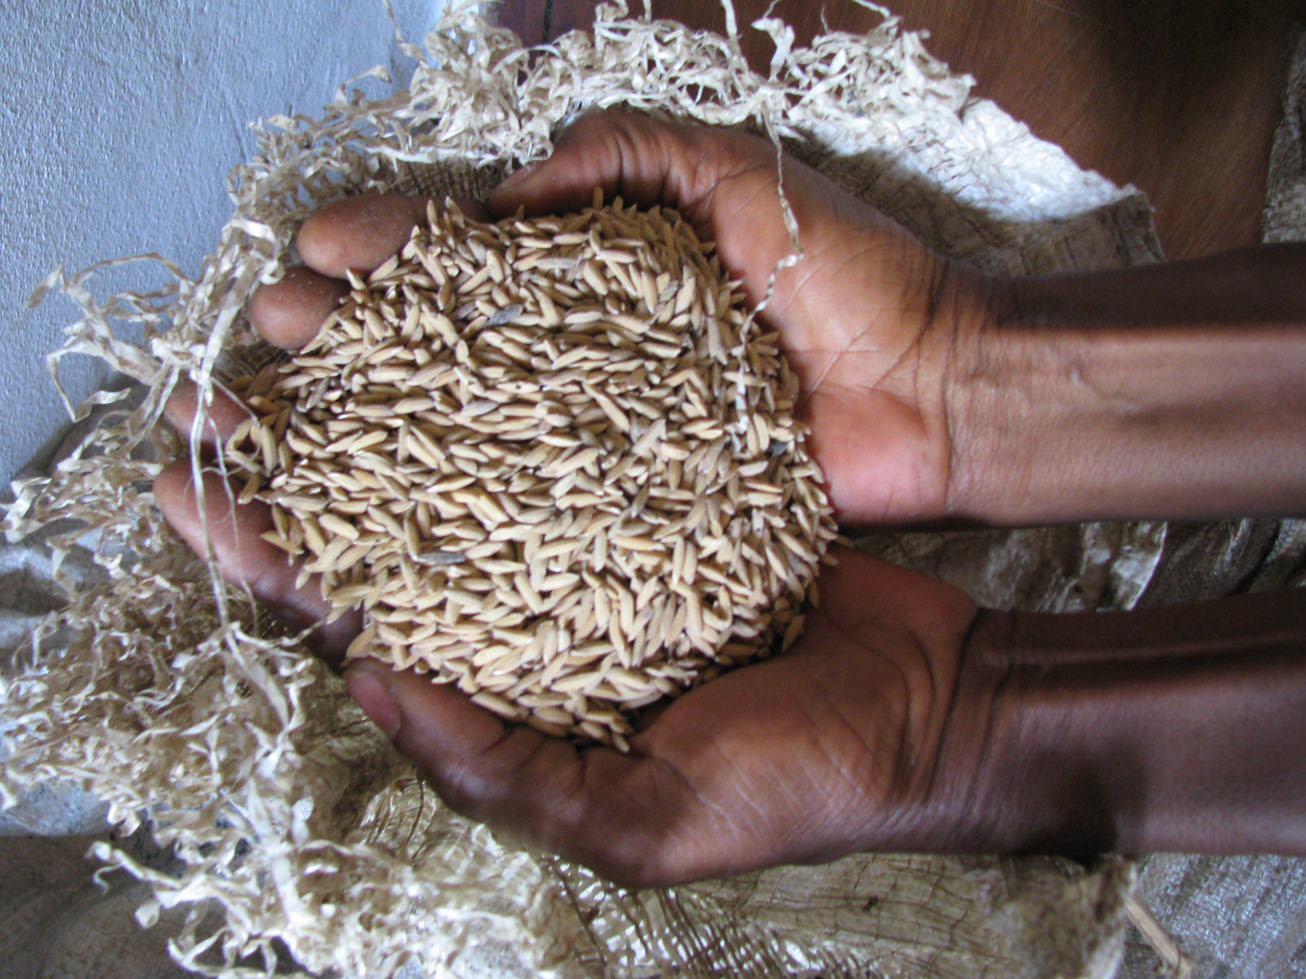
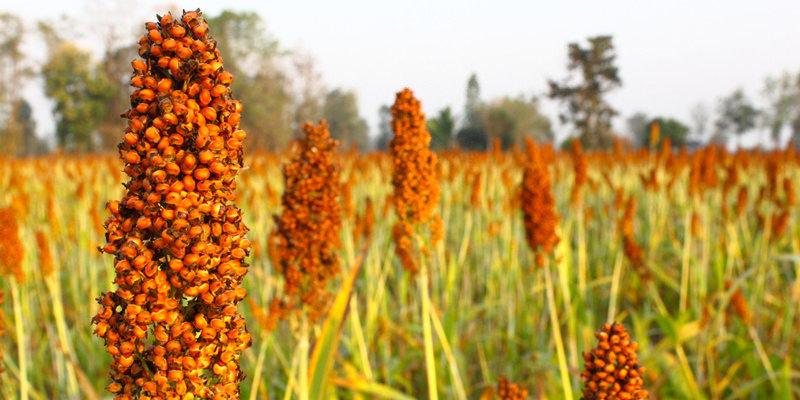

MILLET
CASSAVA
MAIZE
SORGHUM
COTTON
GROUNDNUTS
RICE

20 YEARS OF CROP
PRODUCTION DATA
ACCURACY REQUIREMENTS FOR CROPLAND AND CROP AREA
PROD = AREAEO-cropland x YIELDpast
PROD = AREAEO-croptype x YIELDpast
PROD = PRODpast
ACCURACY REQUIREMENTS FOR CROP YIELD AND CROP AREA
PROD = PRODpast
PROD = AREA x YIELDpast
PROD. ERROR
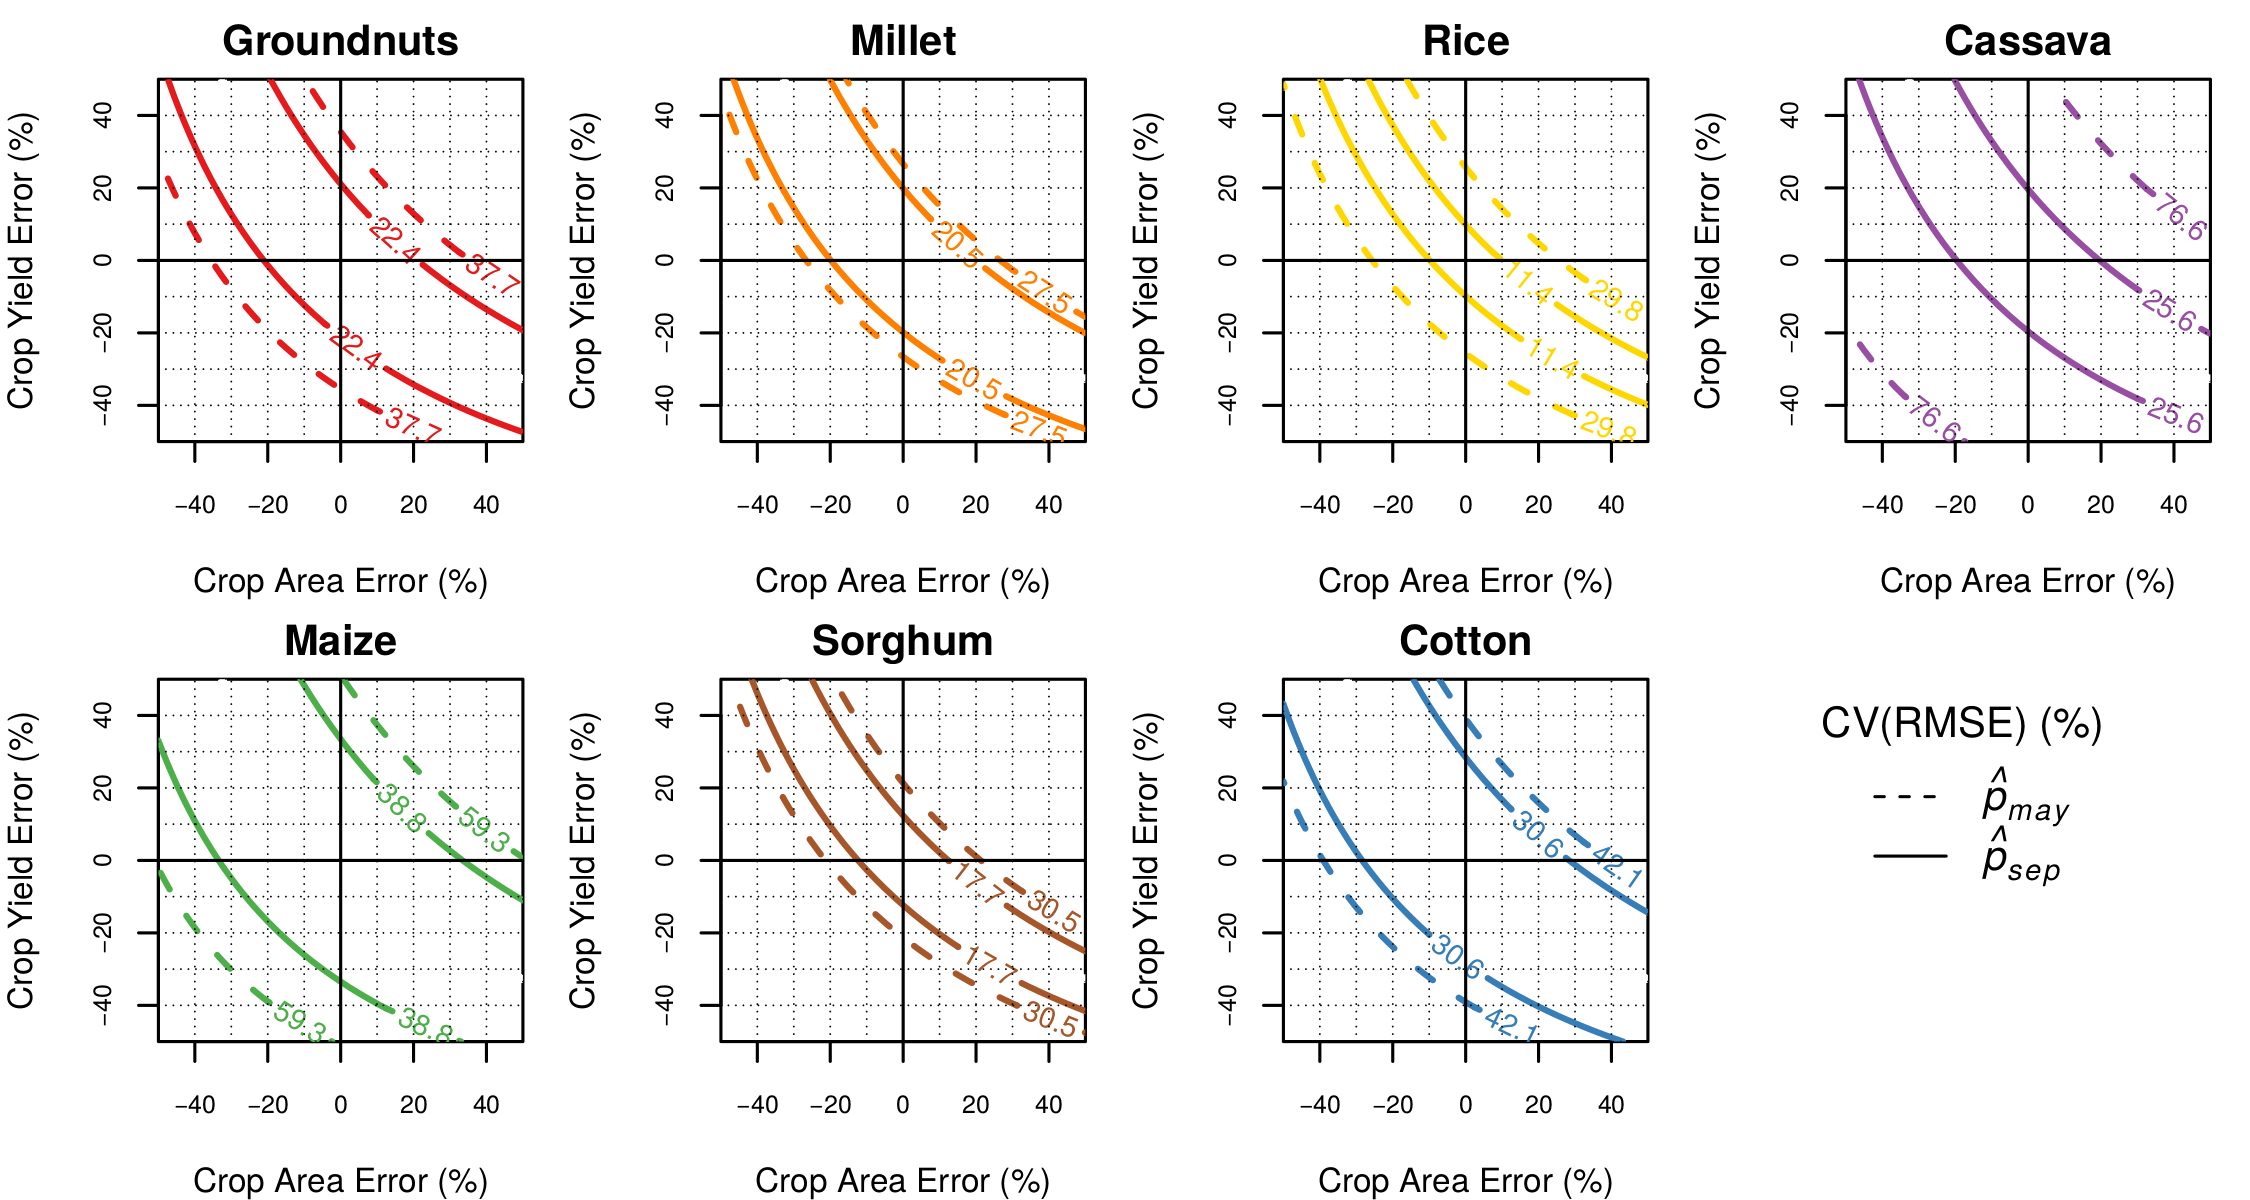
The inter-annual variability of crop yield is the main factor limiting the accuracy of pre-harvest production estimates.
Estimations of cropland area can be useful to improve production prediction of the main crops in Senegal.
Get early estimation of production might be challenging using Earth Observation data.
CONCLUSIONS
ACCURACY
RELEVANCE
TIMELINESS
ACCESS & PRIVACY
Leverage mobile phone data without jeopardizing individual and business privacy (1)
Accurate and detailled prediction of poverty (1)
Accuracy requirements are rather high for early estimator of production (3)
Mobile phone data are biased (market share, phone sharing...) (1, 2)
Mobile phone data provide precious information on socio-economics status and social network (among others) (1, 2)
EO data provide exhaustive land description and can be used as an interesting proxy of crop production and economic activity (among others) (1, 2)
Intercensal poverty map (near real time potential for mobile phone data) (1)
Early estimation of production might be challenging using EO data (3)
1: POVERTY
2: MILLET PRICE
3: CROP PRODUCTION
O C E A N
Data for REFUGEES
DATA
KNOWLEDGE
DECISION
ACTION
POLITICS
DATA
KNOWLEDGE
ASSESSMENT
THANK YOU FOR YOUR ATTENTION
Slides available at https://slides.com/damienjacques/deck/
IF
OR

POOR
NON-POOR
REALITY
OBSERVATIONS
= POOR
MODEL WITH ALL VARIABLES
= POOR
MODEL 1 WITH 50% VARIABLES
MODEL 2 WITH 50% VARIABLES
IF
OR
= POOR
IF
= POOR
CROSS VALIDATION
RELEVANT, ACCURATE & TIMELY
ACCESSIBLE
EASILY
WHILE PRESERVING INDIVIDUAL AND BUSINESS
THAN EXISTING DATA,
NEW DATA SHOULD PROVIDE INFORMATION MORE
PRIVACY
Inter-annual variability
TREND
ESTIMATOR
ERROR
CV(RMSE)
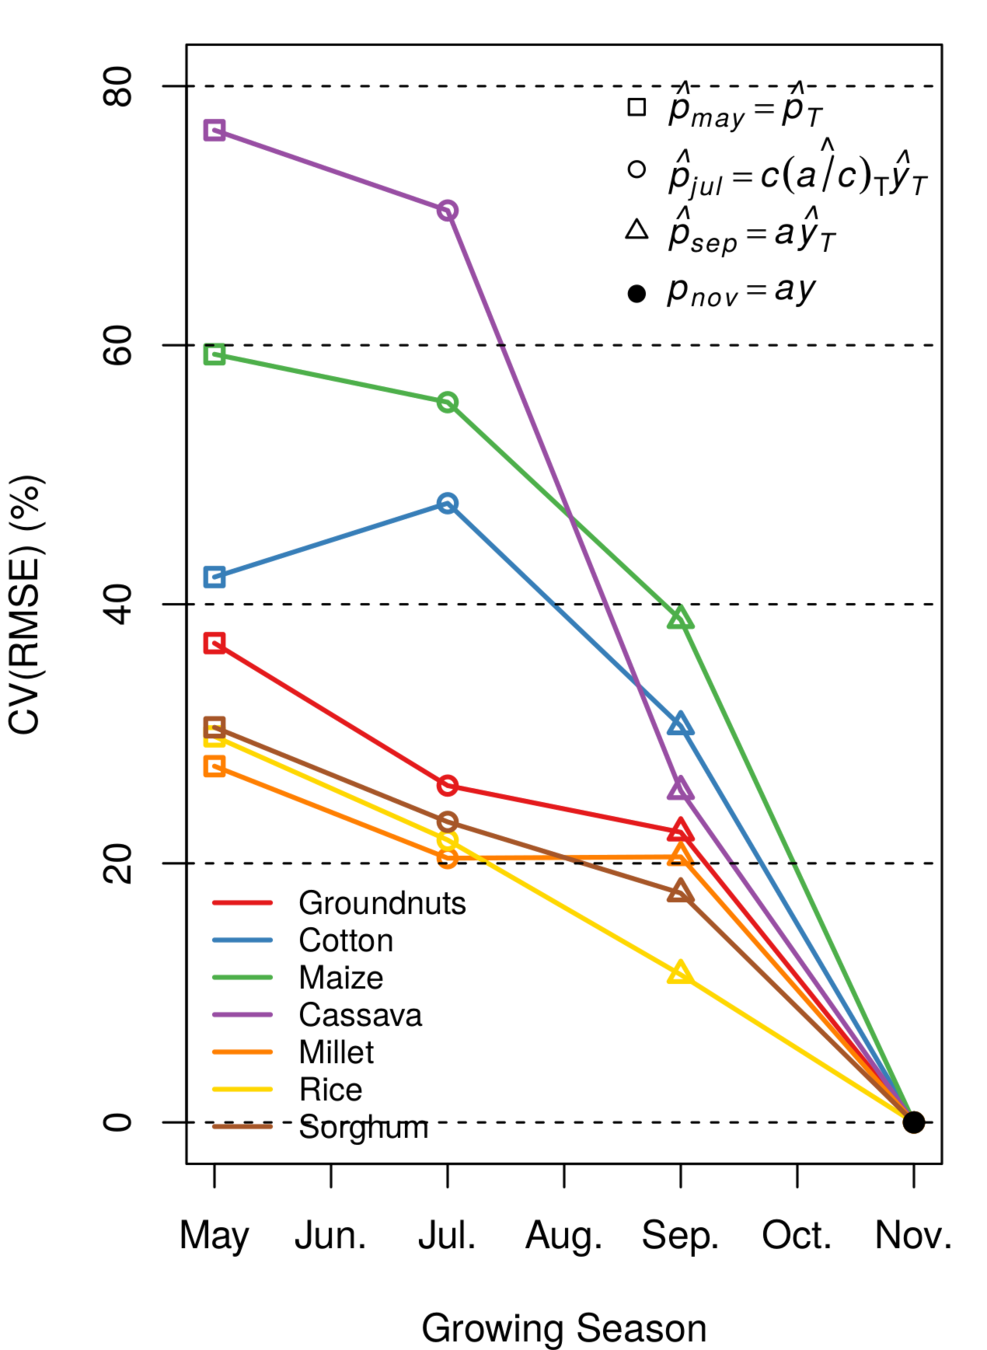
Lowest error of production estimation achievable for each crop according to the increasing data availability along the season.
CROSS-VALIDATION
Outputs combinations
based on the uncertainy of the GP
MP DATA
ENV DATA
Harnessing the Data Revolution for Food Security and Poverty Mapping
By Damien Jacques
Harnessing the Data Revolution for Food Security and Poverty Mapping
PhD Thesis Presentation