Jaeger tracing
Background
Google Cloud Trace
More later on how that went ...
Monitoring Service
Ruby Process
Stackdriver Gem approach
VM
Monitoring Service
Ruby Process
Agent approach
VM
Agent
via UDP
Agents:
- Appsignal - Rust
- Jaeger - Golang
Comparison
- Appsignal
- OpenCensus + ...
- Google: Stackdriver Trace (Trace)
- Uber: Jaeger (Jaeger)
- Google: Stackdriver Log metrics (Jaeger)
Interface: GCP
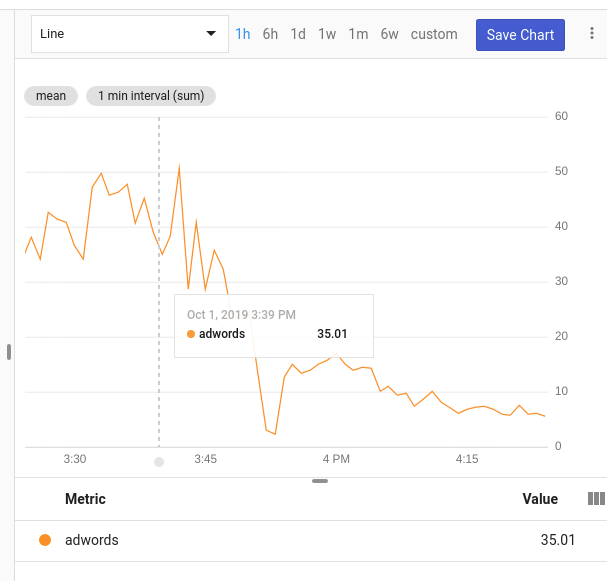
Interface: Metrics
Customization
- Jaeger & Trace: configurable with OpenCensus
- Jaeger server is Open Source
- Metrics: send anything, but graphing by Stackdriver
Observability
- Jaeger & GCP can do it
- Metrics won't
- Appsignal doesn't seem to
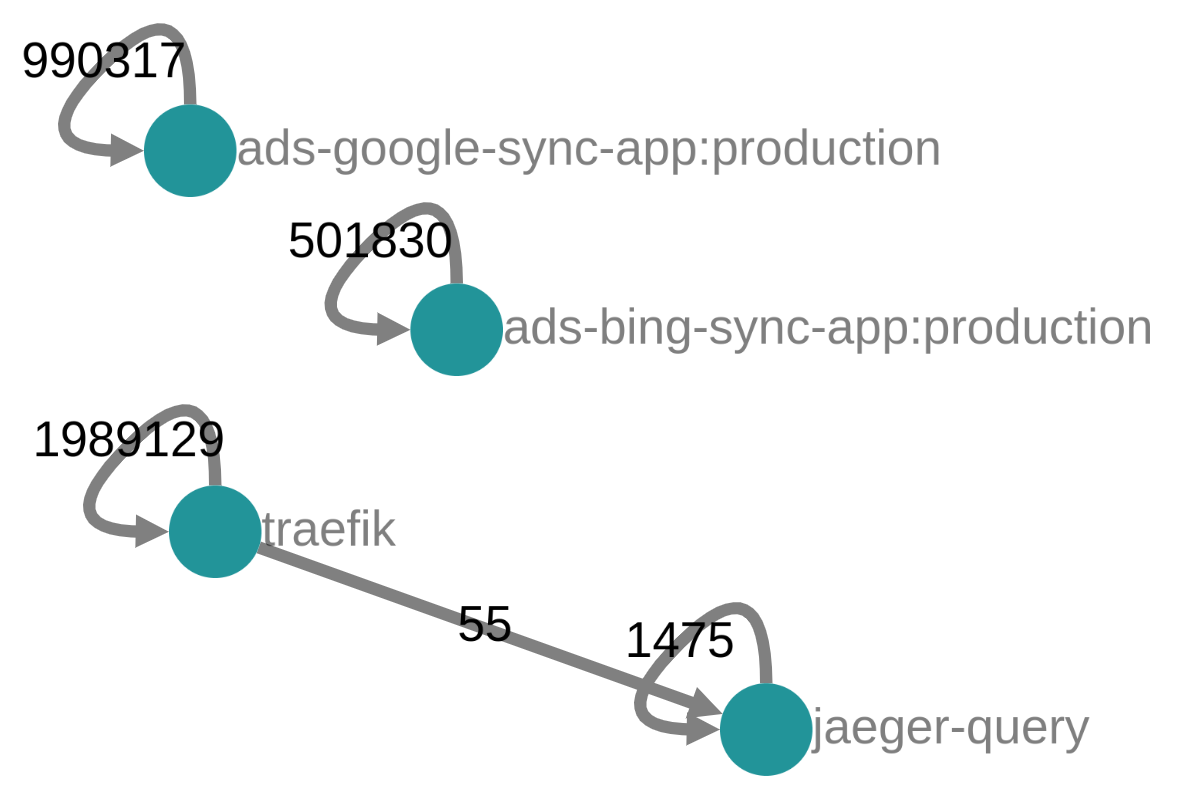
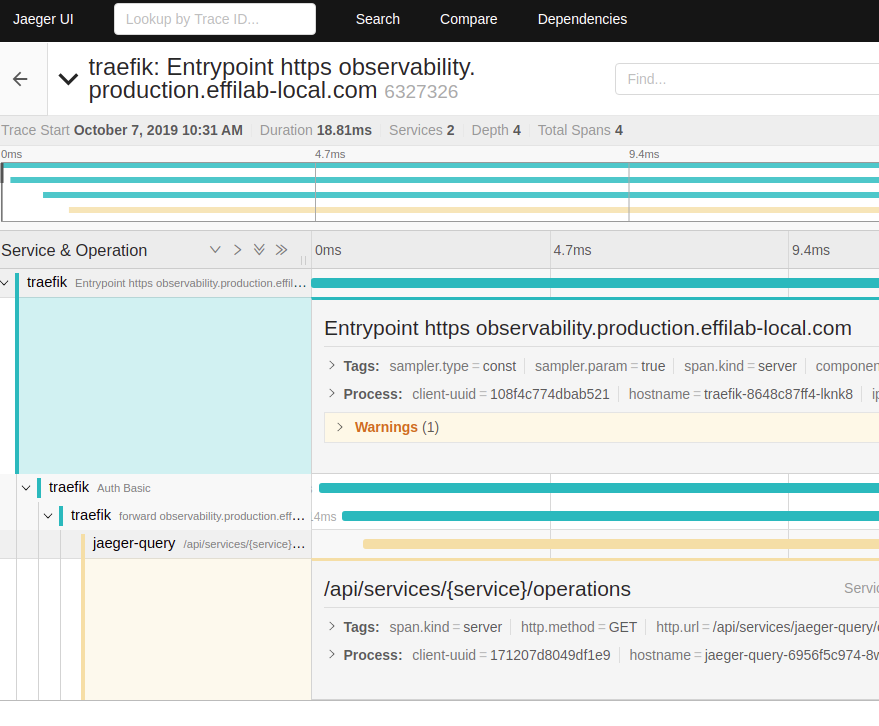
Jaeger: Dependencies
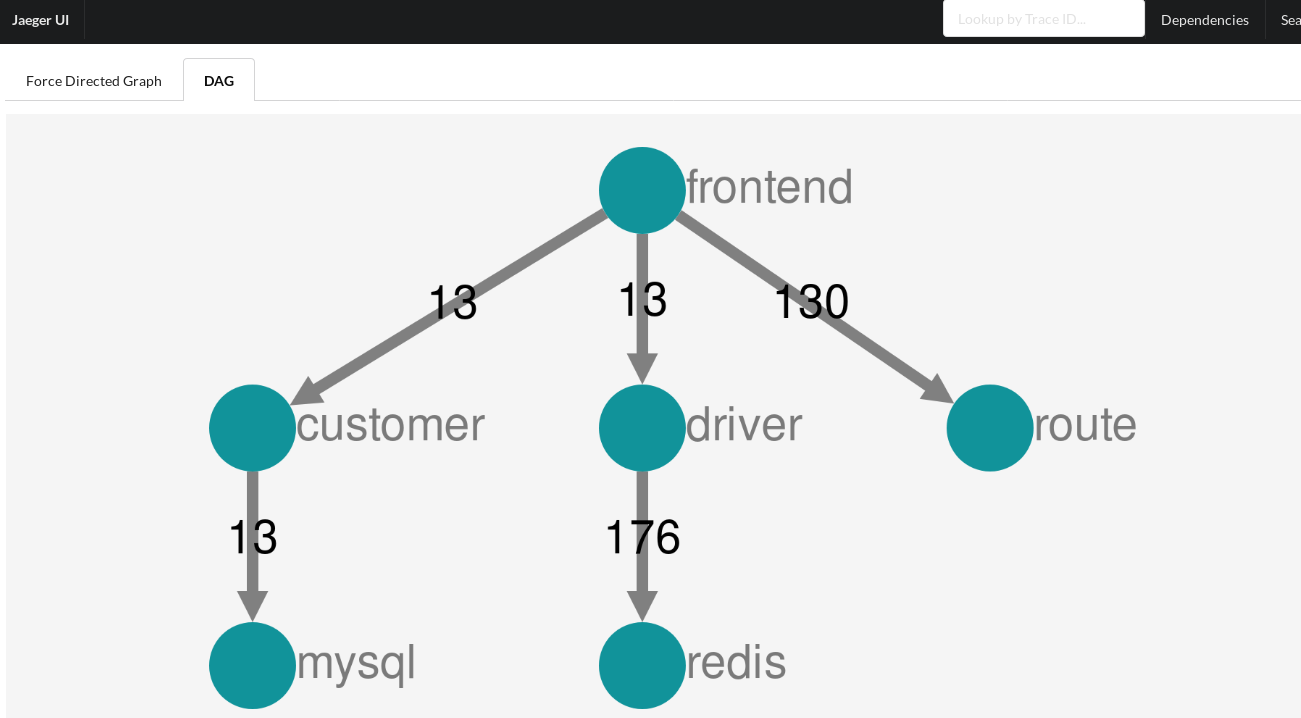
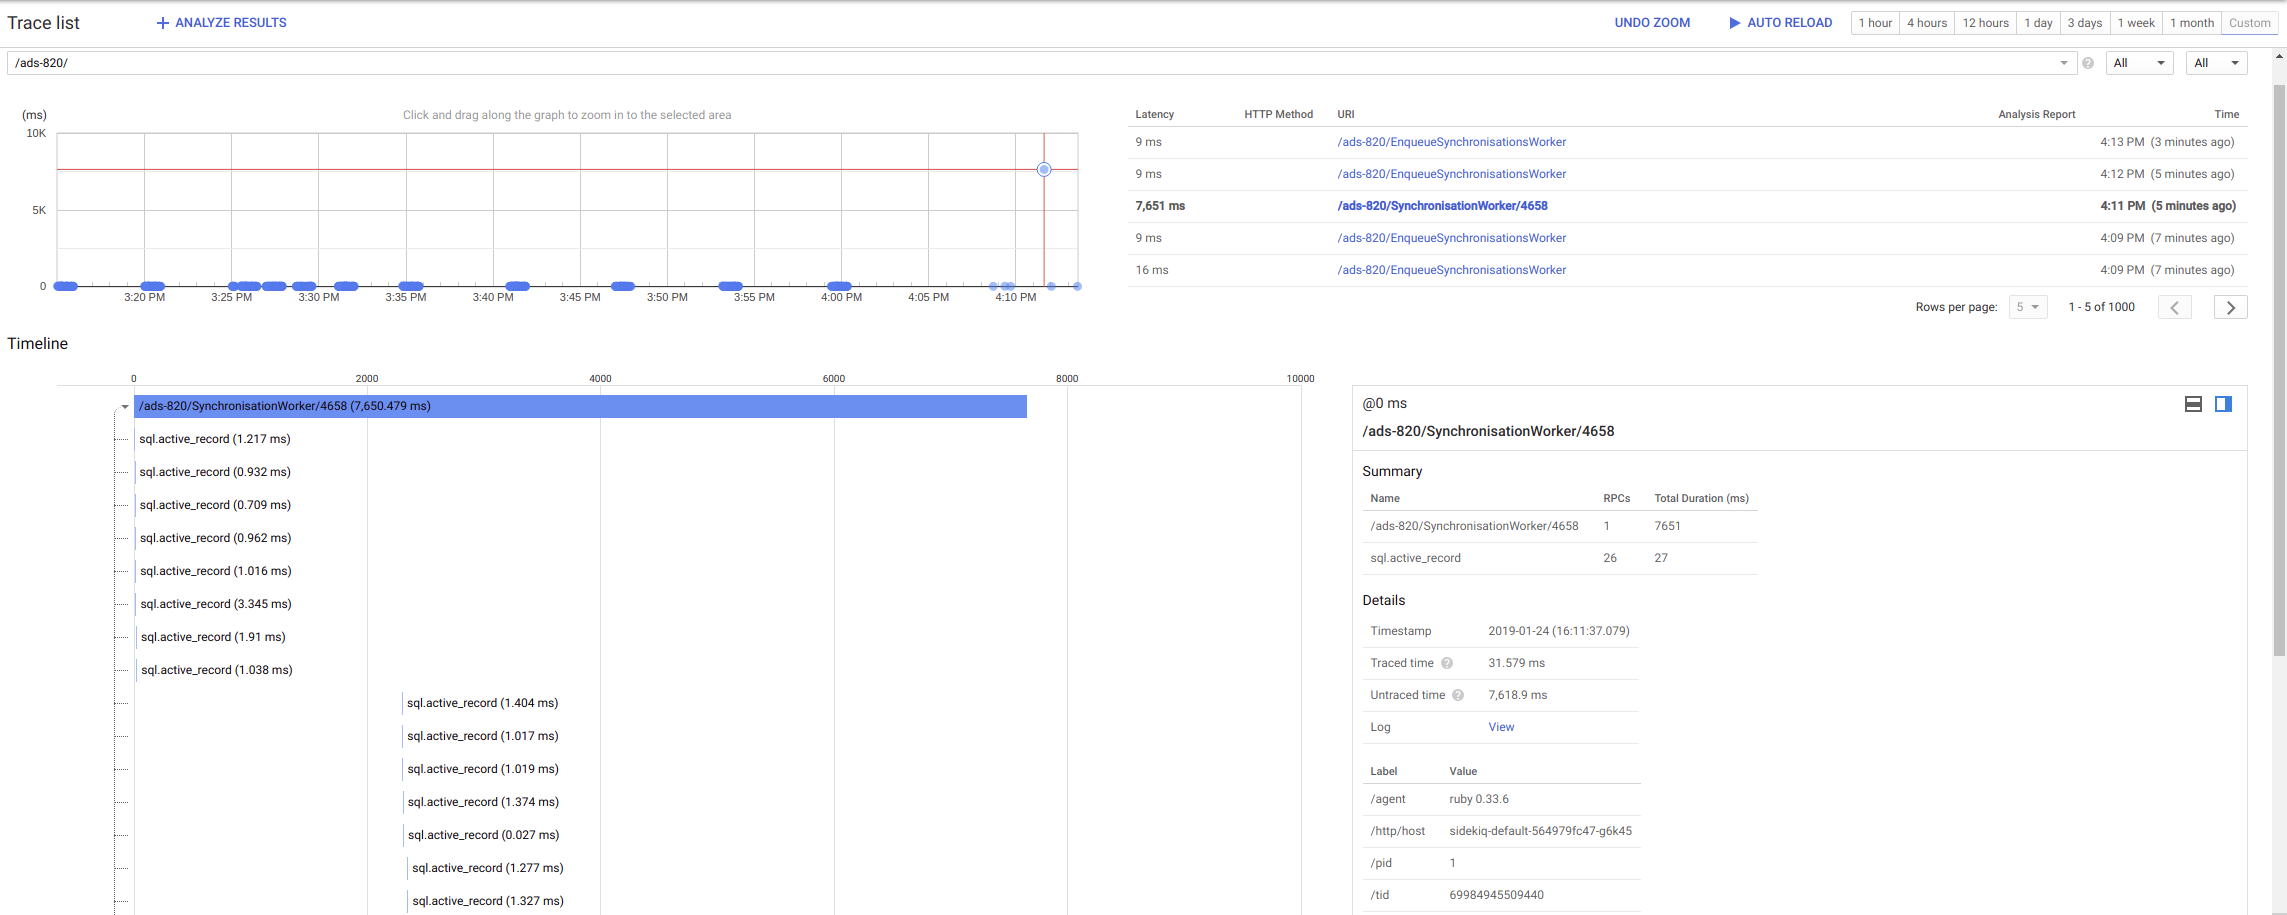
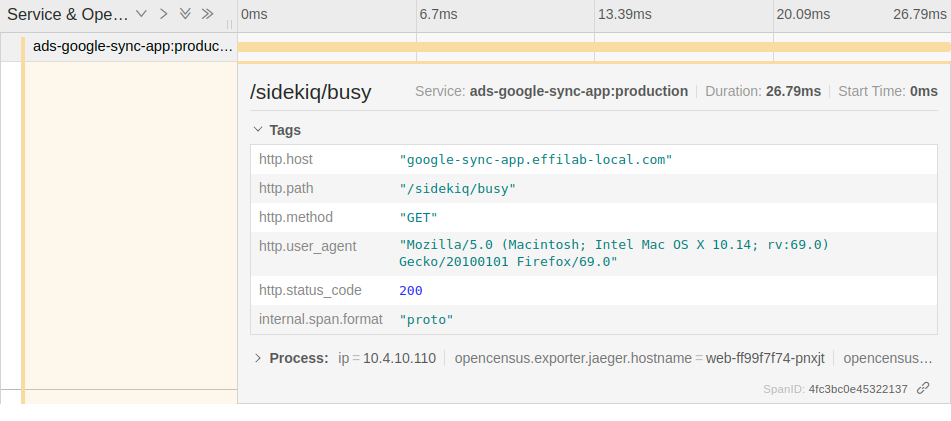
Jaeger: Distributed trace
Other considerations
- Integrated solution
- Support
... but the main concerns were ...
App memory footprint
- Metrics: little memory usage
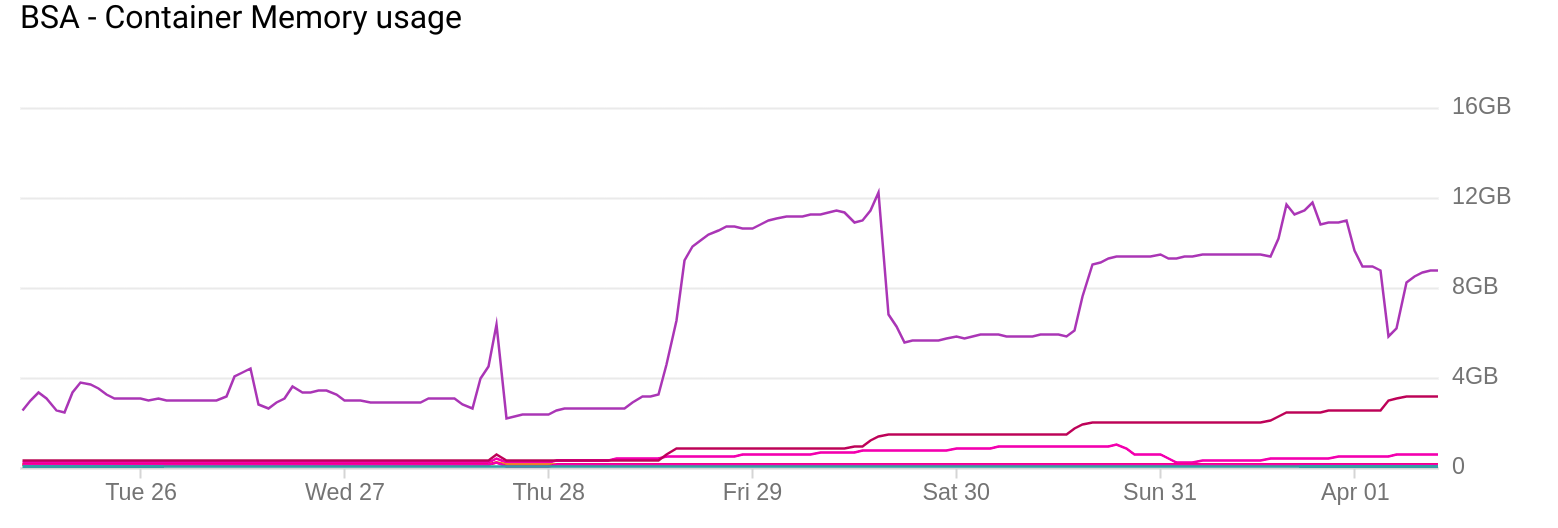
- Stackdriver RAM: 12GB (70% more)
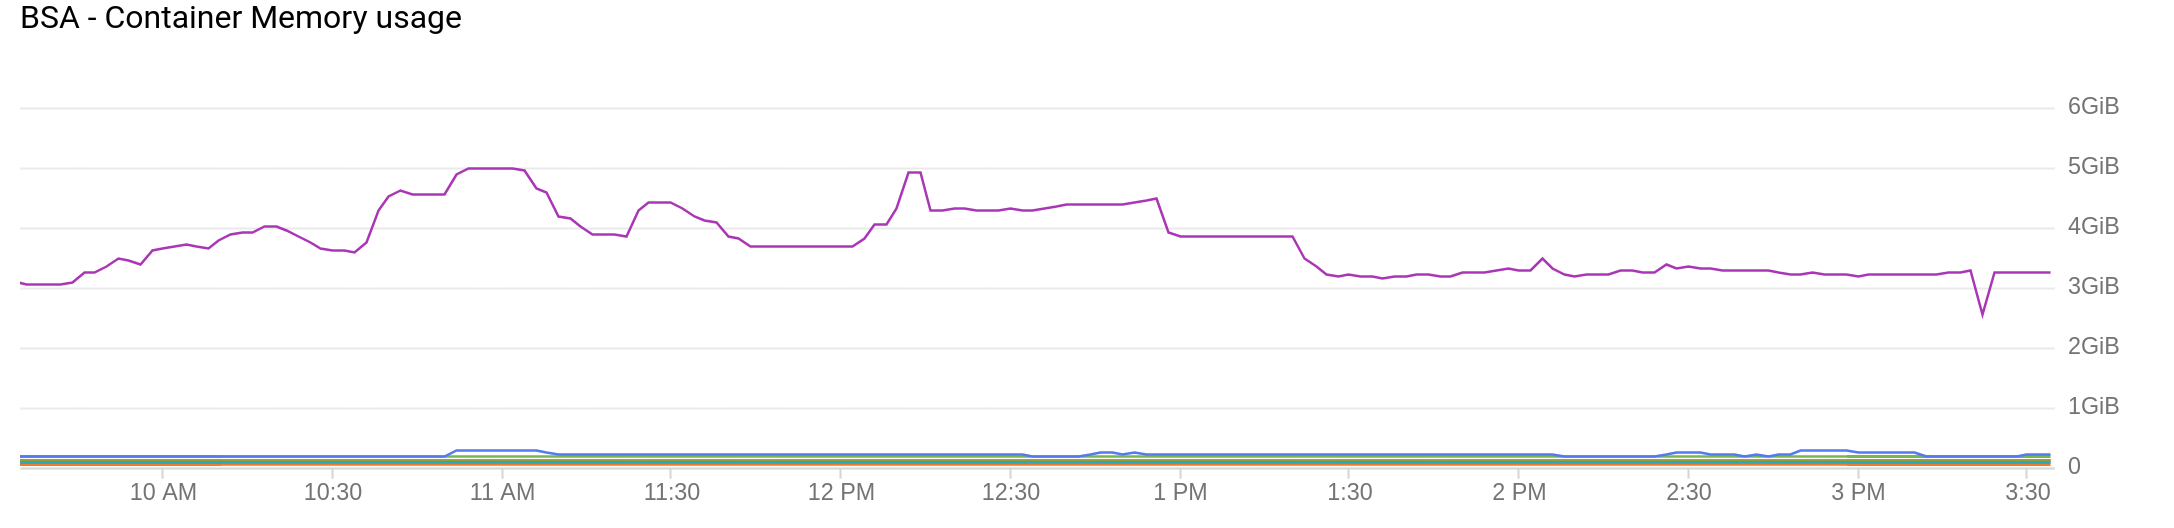
- Jaeger RAM: negligible increase
Cost
- Metrics: est. €50
- Jaeger: est. €50
- Appsignal: see below*
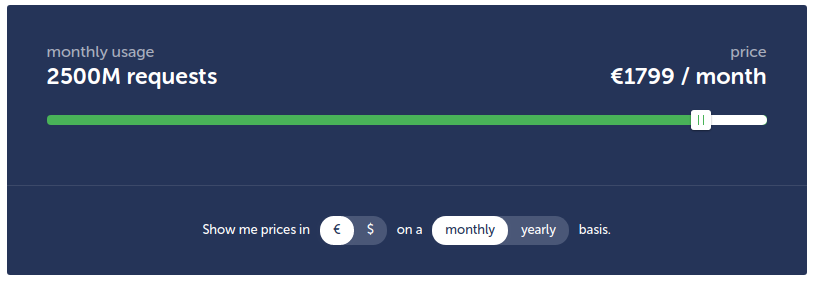
* Pricing initially requested by Appsignal. We negotiated €349/month after removing sync apps
Implementation
... It's not difficult...
OpenCensus - Jaeger
Your code
-> Rails controllers, Sidekiq
-> OpenCensus Gem
-> Exporter Gem
-> Trace
Custom Instrumentation
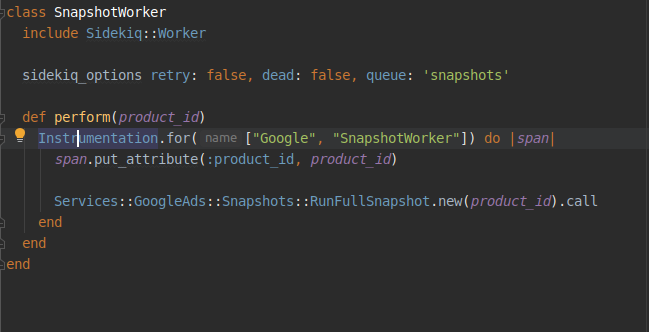
... plus plenty of config options
Try Locally with Docker
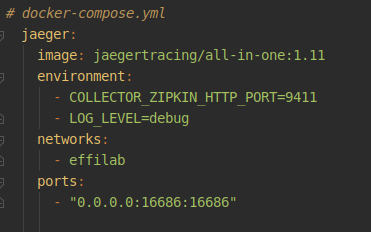
# in Bash console
docker up jaeger
# Browse to http://localhost:16686
Gemfile

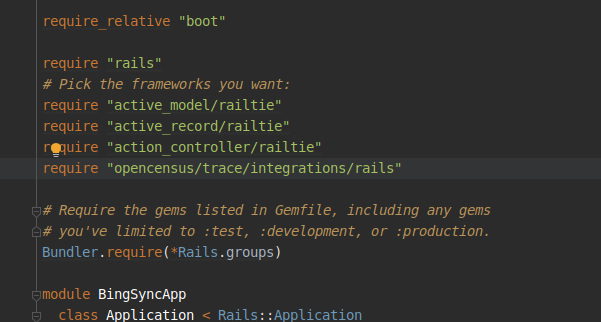
application.rb
Sidekiq config
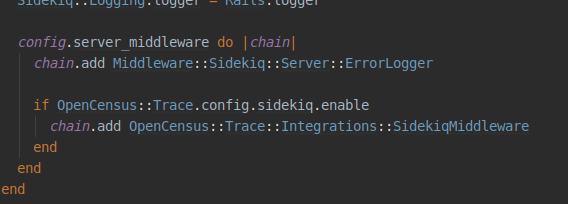
OpenCensus config
- Sampling
- Exporters
- Events
- sample_proc
- Span name
- Span attributes
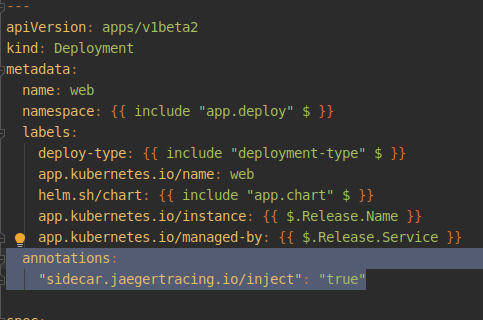
Installation with Helm
All 50 Jaeger Agents (BSA + GSA): 6.4MB
Results
Sync time fix
- < 1 minute to find bottleneck
- < 10 minutes to find cause in code
- < 1h to fix
- reduced sync by 123h/week
Recommendations
Try it out
- Locally
- on PJSA
- on Pulitzer (for Tracing)
- on FB-Trust
I'm happy to help out
Questions?
Jaeger tracing
By Daniel Barlow


