When data journalism meets science
ALESSIO CIMARELLI
International School of Science Journalism
The Digital World (Erice, June 10th, 2014)
Who am I?
aka jenkin
PAST
Master Degree in Physics at the University of Rome "La Sapienza"
Master in Science Communication at the International School for Advanced Studies (SISSA-ISAS) in Trieste
Press officer at the European Laboratory for Non-Linear Spectroscopy (LENS) in Florence
PRESENT
Freelance data journalist, web developer, open data activist, citizen scientist, ...
Dataninja
Data journalism & data visualization made in Italy
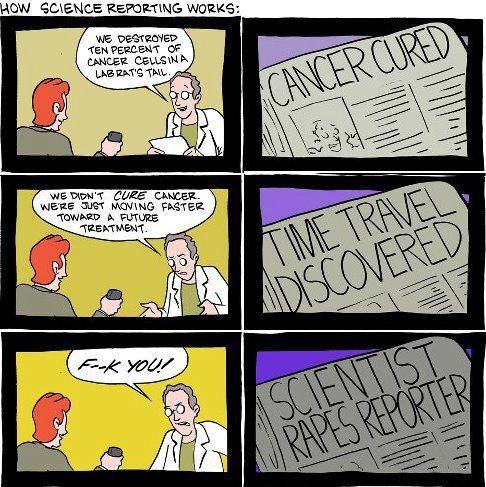
Science journalism
You know very well how it works... :)
Science in journalism
As topic
Stories about the edge of scientific research and human knowledge.
Key role in relationship between science and society.
Science journalist can be a watchdog against false science and scientific frauds.
Science in journalism
As method
It would be evident in investigative journalism, because the workflow is similar to police inquiries or scientific research.
Many informations from different sources, accountability problems, hypothesis and proofs, trial and error cycles, and so on.
Not only a story, but also a discovery itself...
Data-driven journalism
A word in a buzzwords era
There was 5 exabytes of information created between the dawn of civilization through 2003, but that much information is now created every 2 days, and the pace is increasing (Eric Schmidt)
A data journalist is no more than a journalist... when his investigation is ultimately based on (or driven by) digital data, he acquires such prefix.
If a journalist want to tell the world, and the world is now made of digital and quantitative informations, he has to acquire skills in management and interpretation of data, or he will miss an opportunity.
Skills involved in data journalism
Teamwork and multidisciplinary
Journalism
Nose for news, public interest, intuition based on contest knowledge
Data science / statistics
Analytical mind, mathematical and statistical skills, intuition based on science of numbers
Skills involved in data journalism
Teamwork and multidisciplinary
Software developing / hacking
Problem solving, hi-tech knowledge in hardware and software, nerd (or geek, if you prefer) mood
Design
Artistic sensibility and intuition, knowledge in User Experience theory and techniques
Workflow of data journalism
Miners, dustmen, researchers, and story tellers
Find the data
Public search engines or deep web? Official 5-stars open data or web spiders and screen scrapers? Monitor and keyboard, smartphone and touch, or boots and mud?
Control, verify and clean
Data should be read by machines and not by humans! Datasets could hide errors, inconsistencies, lies... or show only a part of a story.
Workflow of data journalism
Miners, dustmen, researchers, and story tellers
Analyze the data
Normalizations and comparisons, filtering, grouping, aggregation, correlations, ...
Visualize this!
How to represent numbers and relations among numbers? Yes, with arabic numerals, but
pictures are worth a thousand words...
as long as you keep in mind that there are facts behind the numbers, and facts are sacred (copyright of The Guardian).
Science in data journalism
In method
You run into a dataset and feel the presence of a possible news...
OR
... you have an interest, an idea, a thesis, so you are looking for data.
Having quantitative data about a phenomenon means that somewhere there is a measurement procedure you have to understand, test, verify... and interpret!
Data themselves can suggest new ways for your investigation or even falsify some hypothesis or assumptions.
Common sense, intellectual honesty, professional ethics
Data journalism about science
Some random examples
Data Journalism Awards 2014
- Health
- Environment
- Astronomy
- Energy
-
Biomassa (Planbureau voor de Leefomgeving)
Data flavours in science
Research data, science world, citizen science
Research data
Hard sciences and social sciences
Ok, neither LHC petabytes are for journalists, nor statistical data from epidemiologic surveys.
But synthetic datasets in scientific reports, or (open) data from national health systems, why not?
If you are not specialized in a specific topic or if you lack the knowledge about the framework, you can ask to an expert you trust.
You can also use numbers not in an investigation, but to tell a complex story using infographics and interactive visualizations.
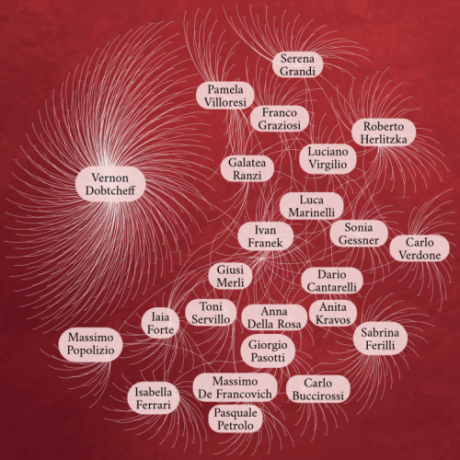
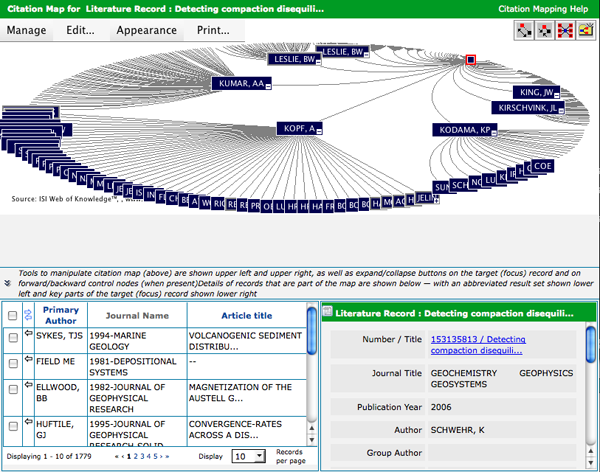
Data about science world
Bibliographies, social networks of scientists, infrastructures
Science is a human activity and an industry (almost) like any other.
How are the European funds invested in scientific research? Where are the centers specialized in the treatment of specific diseases? Why some well known monitoring technologies are not used in some countries?
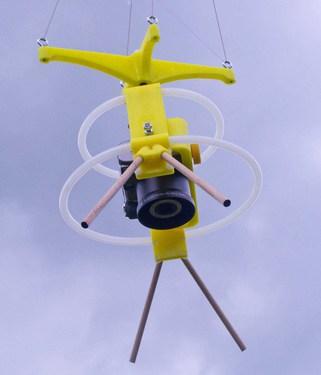
Data from citizen science
Sensor-based journalism
Cheap electronics and sensors
+
open hardware
+
free information sharing
=
data from stakeholders other than scientists
It's early, but promising:
Data journalism as a toolbox
for science journalism
Not THE way to make today's journalism,
but A way can be useful in some circumstances
If you have data, it's better if you know how to deal with them.
If you think you may find some data, it's better if you use them.
If someone use data, it's better if you can check his claims.
Play with data is funny!
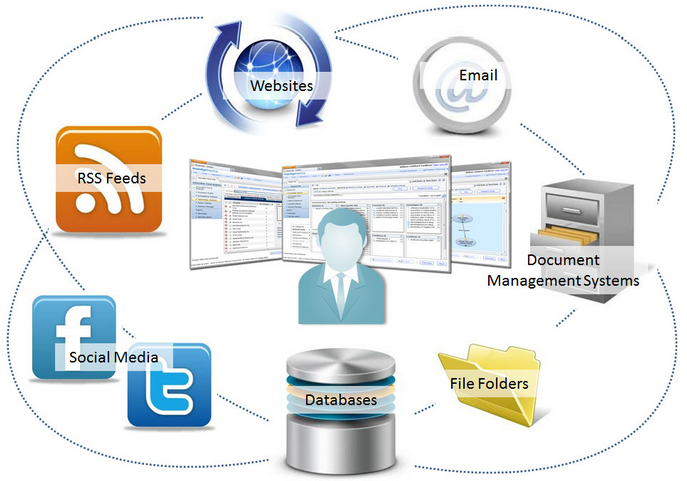
Data sources
Welcome to the jungle!
Data sources
Some examples
- Public administration
- International organizations
- NGOs
- Civic activists
- Press offices
- Leaks
- Social networks
- Journalistic sources
- Single journalists
- Ourselves...
Open data
Data made public and reusable
"A piece of data or content is open if anyone is free to use, reuse, and redistribute it — subject only, at most, to the requirement to attribute and/or share-alike.” - See more at opendefinition.org
Big Data
Remember the buzzword era?
"Big data usually includes data sets with sizes beyond the ability of commonly used software tools to capture, curate, manage, and process the data within a tolerable elapsed time. Big data sizes are a constantly moving target, as of 2012 ranging from a few dozen terabytes to many petabytes of data in a single data set." - See more at Wikipedia
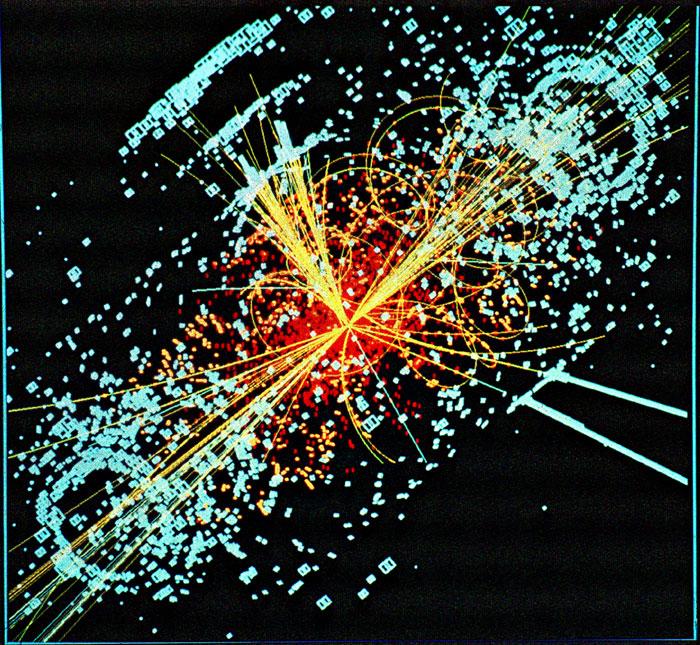
- Data from big science experiments (Atlas, Human Brain Project, ...)
- Google Earth Engine
- Social networks (Facebook, Twitter, but also eBay, Amazon, ...)
Maybe it's not for journalists, but it's a hot topic...
Structured data
For machine, not for human
The keyword is metadata!
A metadatum is an atomic information that describes a given datum, and also describes its relationship with the other data. Structuring a data set means making explicit the meaning and relationships between data.
A well-formed table represent a structured data set. A list of facebook comments, articles of a newspaper, a recorded speech are not structured data (and so are not machine-readable).
Getting (reusable) data
It all depends on the format
If we have Gladstone Gander as best friend:
- spreadsheet (xls, xlsx, ods, csv, tsv);
- not-so-common good formats (xml, sql, json, shp, kml, ...).
If we are not so lucky:
- tables or lists in web pages (html);
- simple tables in well-done pdfs (pdf).
If we have Murphy as worst enemy:
- scanned images, even if in a pdf wrapper (png, jpg, pdf);
- digital data behind complex search engines.
And if we have the best data ever, but under closed license?
Washing & cleaning
Well-formed data sets
Numbers are numbers, strings are strings and not numbers, datetime must always have a single format (ie. yyyy/mm/dd), localization is important, no gender values in names' column or similar mixings, every elements should be named with a Unique Identifier (ID).
Data types computer understands:
- integers (with sign, zero included),
- floating numbers (with sign),
- datetime,
- characters and string (case sensitive),
- null value (the strange case of a value that states "I'm not a value").
And simple comparisons are strictly equalities, also in strings!
Data management and analysis
"If you torture the data enough,
nature will always confess" - Ronald Coase (1981)
Descriptive statistics
Aggregation, average, normalization, relative difference, distribution, ...
Correlations
A single rule: correlation does not imply causation!
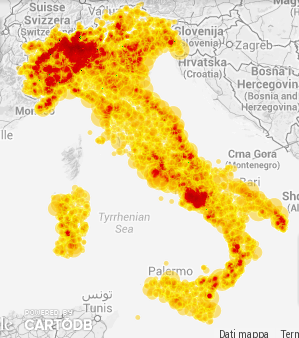
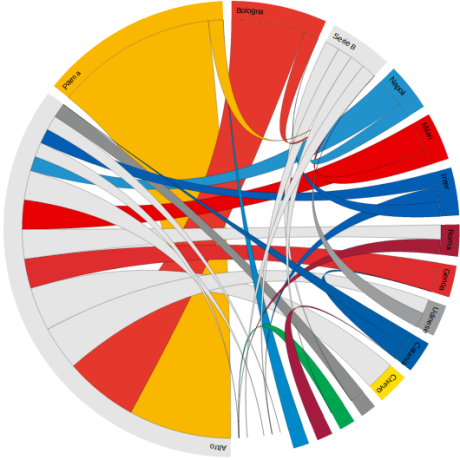
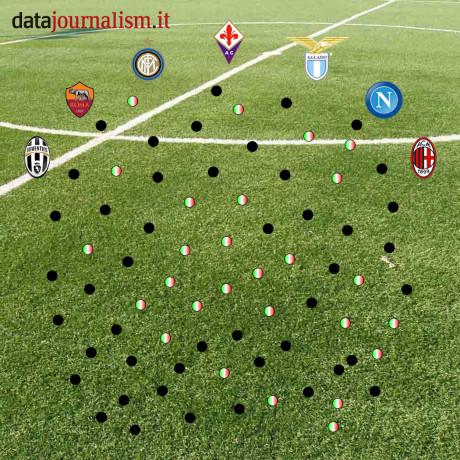
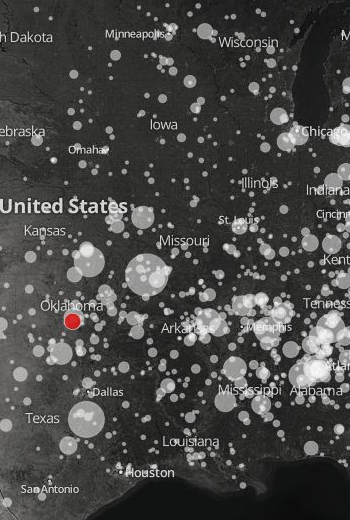
Data visualization
At a glance
Data visualization
With great power comes great responsibility
The basic idea is quite simple: you have quantities expressed in numbers and geometric objects defined by dimensions (ie. radius in a circle), so you just have to decide how connect your quantities to visual dimensions.
There are several (un)common charts and endless combinations: scatter plots, lines, bars, areas, pies, donuts, bubble charts, treemaps, word clouds, alluvional diagrams, dendrograms, networks, streamgraphs, gauges, chord diagrams, motion charts, parallel coordinates, sankey diagrams, maps, choropleth, ...
Journalism as public utility
Building a simple dataset or a large and complex database focused on a topic of public interest leads to a valuable product: the database itself, intended as a collection of (linked) data plus metadata.
Can a public frontend to such database, designed for citizens, journalists, stakeholders, be considered a journalistic outcome? If journalism is a public good, it can be a service, not only a product...
"Open journalism is journalism which is fully knitted into the web of information that exists in the world today. It links to it, sifts and filters it, collaborates with it and generally uses the ability of anyone to publish and share material to give a better account of the world" - The Guardian
Tools
- Scraping
- "Copy & Paste" combo
-
Data Miner for Chrome browser
-
IMPORTXML() Google Spreadsheet function
-
Tabula for simple pdfs
- Python (or other languages) scripts and libraries
- Cleaning
- Filters and "Find & Replace" tools in spreadsheets
-
Open Refine
- Analysis
- Pivot tables and simple charts in spreadsheets
- Dedicated softwares (ie. open-source QtiPlot or QGIS)
- Viz
-
Datawrapper,
RAW,
Google Fusion Tables,
Tableau,
CartoDB,
infogr.am,
easel.ly,
Timelinejs,
Timemapper,
StoryMap, d3js, ...
Readings
- Tina Casagrand, "Data journalism for science journalists", The Open Notebook (2014)
- Paul Bradshaw, "Scraping for Journalists", Leanpub (2014)
- John Mair, Richard Lance Keeble, "Data Journalism", abramis (2014)
- Paul Bradshaw, "Data Journalism Heist"
- Claire Miller, "Getting Started with Data Journalism", Leanpub (2013)
- Nathan Yau, "Data Points", Wiley (2013)
- Simon Rogers, "Facts are Sacred", Faber & Faber (2013)
- Jonathan Gray, "The Data Journalism Handbook", O'Reilly (2012)
- Nathan Yau, "Visualize This", Wiley (2011)
That's all...?
Alessio "jenkin" Cimarelli
jenkin@dataninja.it
Dataninja
Q&A
It's your turn, folks!
Hacking + Marathon = Hackathon
Rapid Alert System
for Food and Feed
The Rapid Alert System for Food and Feed (RASFF) was put in place to provide food and feed control authorities with an effective tool to exchange information about measures taken responding to serious risks detected in relation to food or feed. This exchange of information helps Member States to act more rapidly and in a coordinated manner in response to a health threat caused by food or feed.
European School Survey Project on Alcohol and Other Drugs
This is the report from the fifth data-collection wave of the European School Survey Project on Alcohol and Other Drugs (ESPAD). It is based on data from more than 100,000 European students. Over the
years about 500,000 European students have answered the ESPAD questionnaire.
A total
of 36 countries and regions have contributed data to the 2011 ESPAD Database. Drugs list includes cigarettes, alcohol, cannabis, other illecit drugs, tranquillants and sedatives without prescriptions.