Cecilia Payne-Gaposchkin
the woman who explained the stars
Daina Bouquin
Head Librarian
Center for Astrophysics | Harvard & Smithsonian
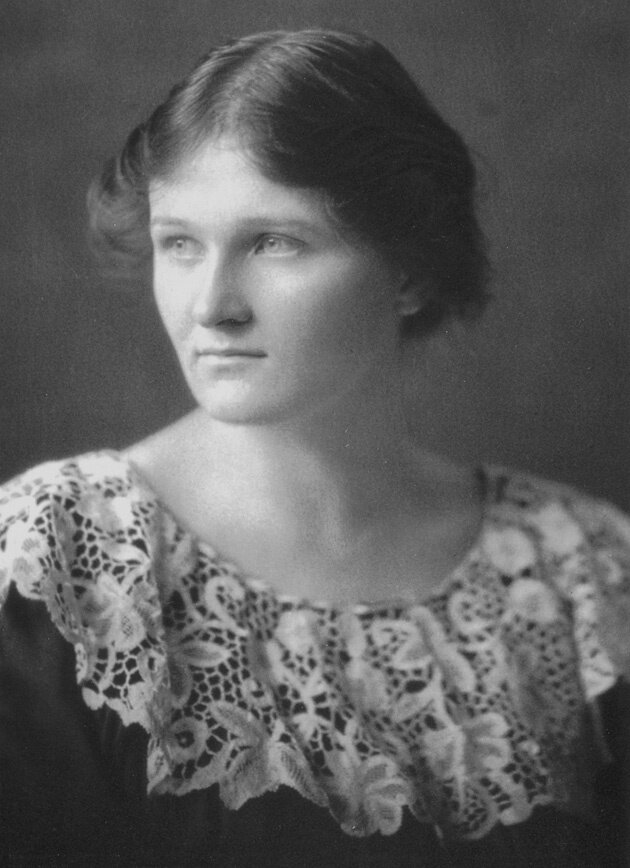
Cecilia Payne was born into a moderately wealthy family that lived in the English countryside.
She was tutored alongside her two brothers in poetry, music, math, but not much science.
Even when she went away to a girl’s boarding school she was unsatisfied with the available labs, antiquated equipment, and the inadequate staff to teach her.
1900 - 1979

Newnham College
Cambridge
Studied with:
Ernest Rutherford
J.J. Thompson
Niels Bohr
Arthur Eddington
Cambridge refused to issue degrees to women until 1948
Having met Harlow Shapley at Cambridge and being awarded a Pickering Fellowship, Cecilia traveled to the US in 1923.


Women Astronomical Computers

Cecilia finished her thesis in 1925.
Both she and the scientific community were using predictions from quantum theory (fully developed that year) and data from experiments on Earth, to identify spectral "fingerprints" to understand what was being seen out in the universe.
Her thesis used the magnitude of particular spectral lines from metal ions, combined with ionization theory equations, to determine not only how much of which elements were present in the stars, but also stars' temperatures.

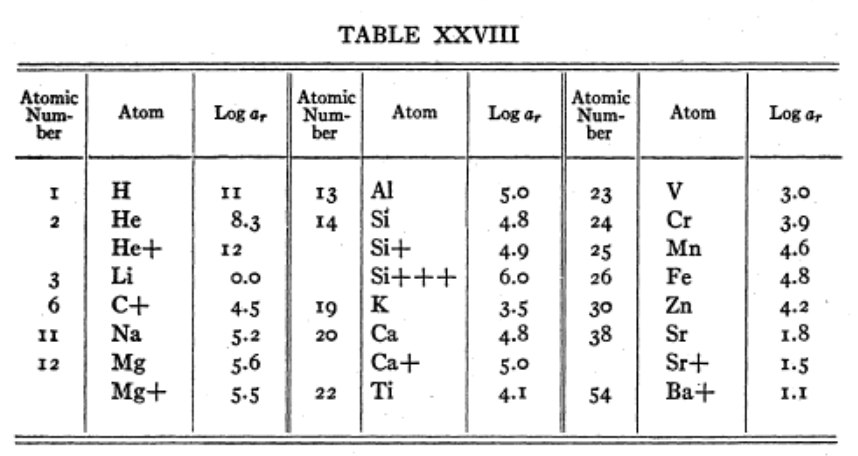
Stellar temperature scale, derived using stellar spectra and their line intensities, combined with the most recent developments in quantum theory and physical chemistry.

The Saha equation links the composition and appearance of the spectrum with the temperature of the light source and can thus be used to determine either the temperature of the star or the relative abundance of the chemical elements investigated.

Meghnad N. Saha
1893 - 1956
Cecilia's work also used Edward Milne's and Ralph Fowler's equations of spectral intensities

Edward Milne
Ralph Fowler

“I was to blame for not having pressed my point. I had given in to Authority when I believed I was right. That is another example of How Not To Do Research. I note it here as a warning to the young. If you are sure of your facts, you should defend your position.”
Cecilia Payne-Gaposchkin: An Autobiography and Other Recollections
Cecilia's PhD thesis was dubbed by Otto Struve as
“the most brilliant PhD thesis ever written in astronomy.”


Plate I38737. Harvard College Observatory. March 25, 1914.
Currently on display in the Wolbach Library

Plate X5058. Arequipa, Peru. July 29, 1893.


Working with negatives
Plate C493. Harvard College Observatory. April 23,1887.

White lines are actually dark absorption lines
It was also necessary to write on the back of the plate in order to not damage the emulsion, so the spectra looked reversed when they were analyzed.


Ti
Ca
Ca "K"
Hε + Ca "H"
Hδ
Hε + Ca "H"
Hγ
Hβ
Procyon


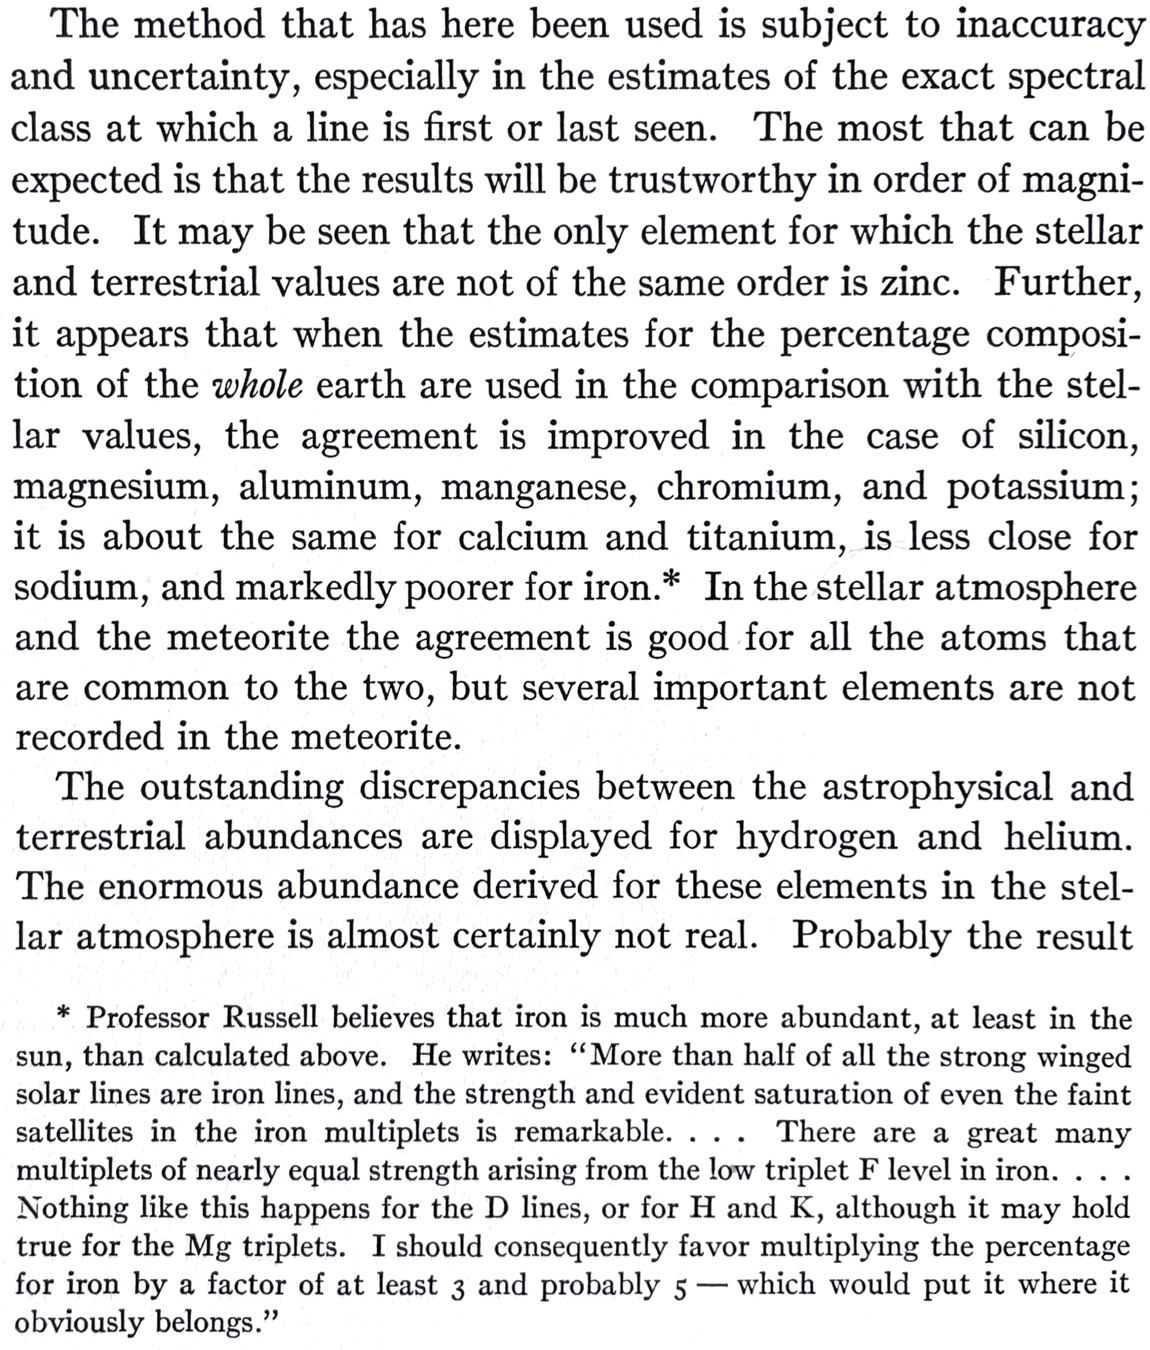
mechanical "microphotometer" machine
You could now precisely measure what percentage of a beam of light could pass through any spot on a glass plate photograph.

n = amount of background noise (determined by eye)
m = photometer measurement
(light passing through negative image)
l = spectral line depth
(light passing through the dark spectral absorption line)
no light passing through
clear film
For each peak, the background n, photometer reading m, and total dynamic range of the photo, l+m+n, were carefully measured by hand with a glass rule etched every half millimeter.

indicates
normalization
The full dynamic range, l+m+n, might vary slightly across the length of the spectrum, so one value was chosen to use for analysis. The columns n and m+n with bars above indicate when measured values have been normalized to the dynamic range chosen for the analysis.

A value of 590 was chosen for analysis of this plate. You can see that the third column shows ranges of 595 and 600 instead of 590. Thus, the values in the fourth and fifth columns have been adjusted slightly downward to compensate.
The response of the photochemicals used on the glass plates varied non-linearly as they got closer to full exposure and slightly with the wavelength of the incident light.
The coating could also potentially vary from
batch to batch of plates.
Taking at least two different-length exposures of a spectrum on each plate allowed astronomers to graph a "material" curve at each wavelength to take this into account.
A shorter exposure has fewer photons hit the plate than a longer exposure, giving two chemical response points for a given wavelength peak.
Plates aren't perfect

Plate c493 has 4 exposures of different lengths.
Microphotometer traces of the Hδ line in the spectrum at each of the four exposures.
The shortest exposure was the upper curve, with exposure time increasing as the curves get deeper.
The lowest curve was overexposed as the chemicals in the center of the line were saturated and couldn't respond to any more light.

Cecilia chose four peaks from the trace of c493 to create a calibration curve.
The four lines include one that got close to full exposure in the longer exposure and one that did not show in the shorter exposure .
The Y-axis values for these curves are the manual measurements from the microphotometer trace.
The X-axis values are deflection of the galvanometer leaf within the microphotometer (the displacement of a small, electric-charge sensor that would become excited with the touch of light).
The deflection of the leaf was measured in half millimeter increments, with the minimum deflection calibrated to Darkness and maximum deflection calibrated to Clear Film.
Cecilia showed that it wasn't necessary to create a calibration curve for each individual line in the spectrum to be analyzed.
Any change in the plate response must be locally linear, i.e., smooth and gradual. If it isn't, then something drastic happened, like a cloud passing or the chemicals being spread unevenly on the plate.
Thus, the overall plate response could be calibrated by choosing two exposures for each of enough spectral lines to span the full dynamic range, and then overlapping these lines to get the calibration, or "reduction", curve for the entire plate.


dl = measured line intensity expressed in % light loss
“Young people, especially young women, often ask me for advice. Here it is, valeat quantum. Do not undertake a scientific career in quest of fame or money. There are easier and better ways to reach them. Undertake it only if nothing else will satisfy you; for nothing else is probably what you will receive. Your reward will be the widening of the horizon as you climb. And if you achieve that reward you will ask no other.”
Cecilia Payne-Gaposchkin
- Boyd, Sylvia L. (2014). Portrait of a Binary: The Lives of Cecilia Payne and Sergei Gaposchkin. Penobscot Press.
- Gingerich, Owen (1982). Cecilia Payne-Gaposchkin. Quarterly Journal of the Royal Society. Vol. 23, p. 450-451.
- Haramundanis, Katherine (1996). Cecilia Payne-Gaposchkin: An autobiography and Other Recollections. Second Edition. Cambridge University Press.
- West, Doug (2015). The Astronomer Cecilia Payne-Gaposchkin - A Short Biography. C&D Publications.
- Wargelin, Peggy (2019). Cecilia Payne-Gaposchkin: life, work process, and contributions to science. https://library.cfa.harvard.edu/cecilia-payne-gaposchkin
Cecilia Payne-Gapschkin
By Daina Bouquin


